Massive Crowds for MLK Weekend 2022 at Disney World
Winter is here at Walt Disney World, but off-season crowds are nowhere to be found in January 2022. Wait times are up for MLK Day Weekend, and will only likely worsen heading into February and its bevy of holidays. This report shares recent data, thoughts on why this is happening, and why wait times don’t tell the full story of “feels like” crowds in the parks.
Let’s start with the why of this, as we’ve received a ton of reader comments over the last several days using words like “abnormal” and “atypical” to describe the heavy crowds at Walt Disney World right now. While the assessment that current congestion and wait times are bad is accurate, these are not an anomaly.
Martin Luther King Day Weekend is usually busy. It’s like Veterans Day: many (most?) people don’t have it off work, so they assume it won’t be busy–but it’s a holiday for enough people that it absolutely does move the needle on crowds. This weekend is one of several holidays that makes winter a time of ‘peaks and valleys’ at Walt Disney World, and not strictly the off-season.
In our 2022 Walt Disney World Crowd Calendar overview, we took that a step further, warning that this winter “off-season” would catch Walt Disney World visitors by surprise with heavier than normal crowds. (Even before that, back when Festival of the Arts was announced on October 22 of last year, we made this exact same prediction.) In the crowd calendar analysis, we wrote that if omicron weren’t in the mix, our prediction was baseline crowds in the 7/10 range for most dates, hitting 9/10 and higher on holiday weekends.
That prediction was due to postponed trips, pent-up demand for international travel, snowbirds resuming their normal Florida travel plans, the return of runDisney and youth sporting events, and people remembering how low crowds were this year. That confluence of circumstances meant much more demand than normal in early this year. The lack of discounts through March 2022 was also concerning and suggestive of more travel, and my expectation was/is that attendance will follow suit.
That crowd calendar analysis went on to explain that one big reason that attendance was so low last winter was because of the post-holiday surge in cases and resulting travel trepidations. The same thing happened again in August through October, with some cancellations driven by Florida’s delta surge. If history is any indication, there have been cancellations once again due to omicron. The question is not one of “if” but rather “to what degree?”
When this wave first started, our projection based on early and incomplete information was that omicron’s impact on crowds at Walt Disney World would be negligible. Insignificant as compared to last winter’s wave or even the height of delta. This was due to much more fatigue and polls showing that Americans are “done” with disruptions to their plans. People are ready to move on with life, which is pretty obvious even without polling data–just look at Spider-Man’s box office results or TSA traveler numbers for the holidays.
Suffice to say, that’s why Walt Disney World’s current crowds should not be surprising. Don’t expect things to get any better from here, either. With that said, let’s turn to the latest Walt Disney World wait times…
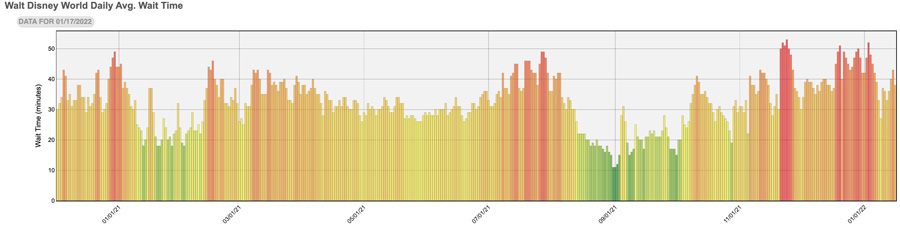
We’ll start with a high level look at weekly wait time averages across the entirety of Walt Disney World. (As always, all graphs and wait time stats courtesy of Thrill-Data.com.)
It’s hard to see specific dates on that condensed graphic, but the highest and reddest lines on the far right are the weeks of Thanksgiving, Christmas, and New Year’s. After that, there’s a gradual drop-off with the middle of last week having the lowest posted wait times since mid-November. However, that’s not the full story…
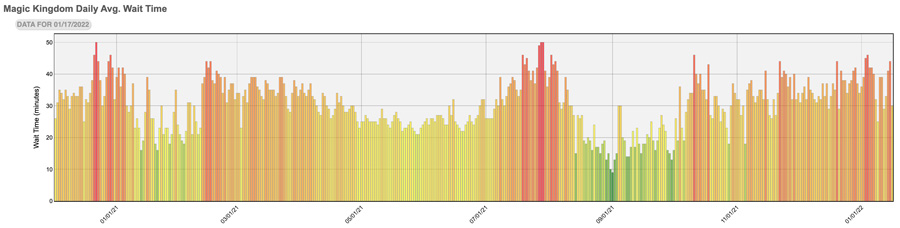
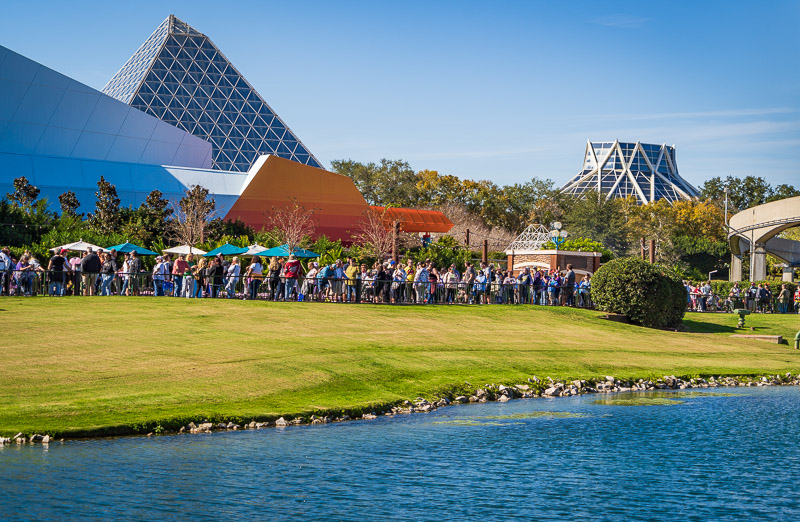
Breaking this down by park, where we’ll first look at Magic Kingdom.
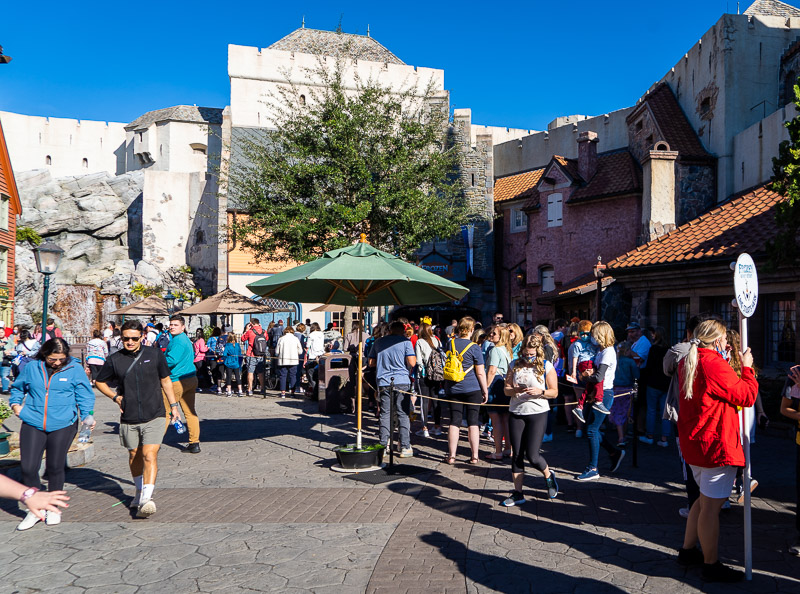
Magic Kingdom wait times have been all over the place during the last couple of weeks, but had 9/10 and 10/10 crowd levels on Friday and Saturday. Sunday was only a 5/10, which was almost certainly a result of the stormy weather (there was a tornado warning for Orange County and other areas of Central Florida), which likely cut down on the number of locals in all of the parks. Even without that, Saturday would’ve been much busier than Sunday.
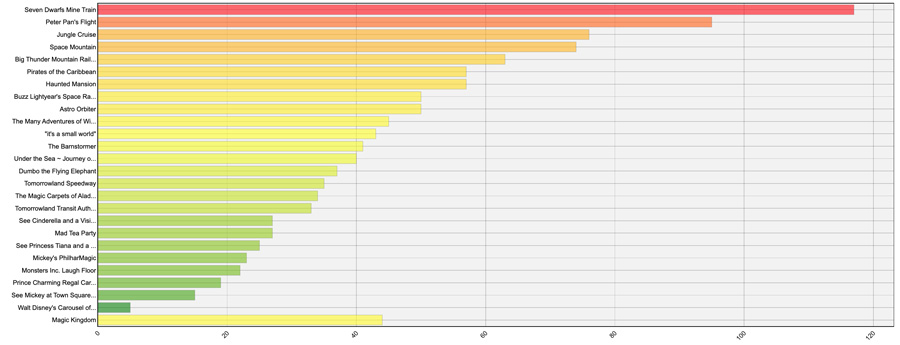
Above is a look at Magic Kingdom average daily wait times by attraction for Saturday.
Here are the specific numbers:
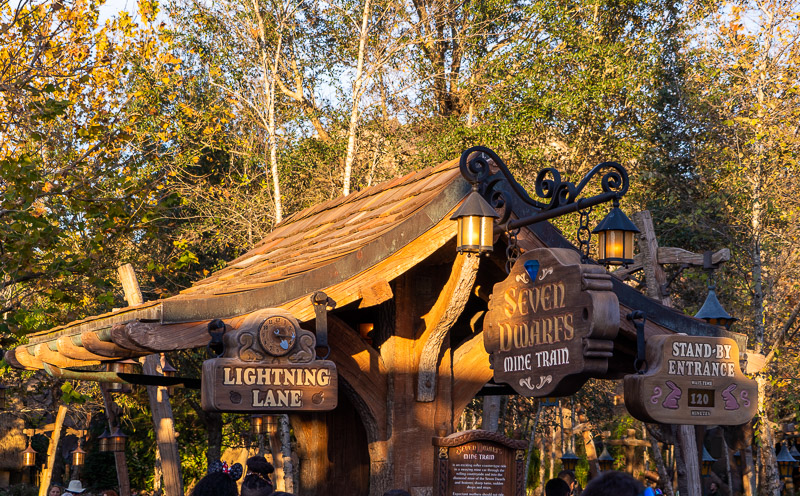
- Seven Dwarfs Mine Train: 117 minutes
- Peter Pan’s Flight: 95 minutes
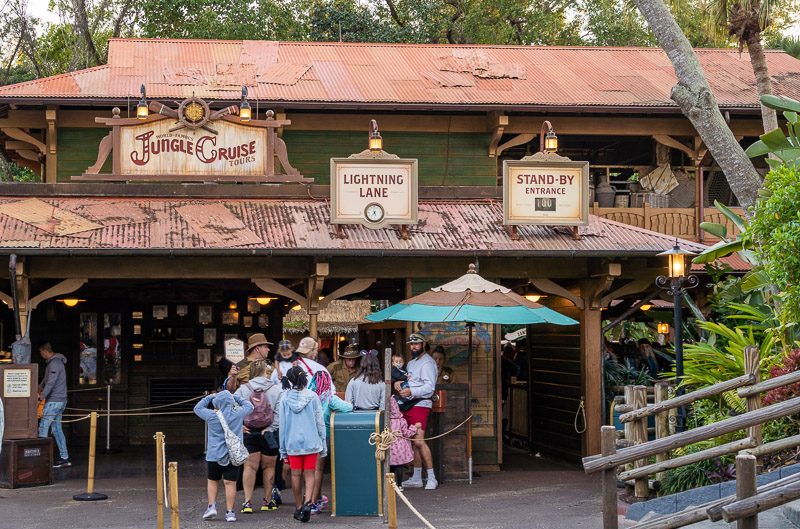
- Jungle Cruise: 76 minutes
- Space Mountain: 74 minutes
- Big Thunder Mountain Railroad: 63 minutes
- Pirates of the Caribbean: 57 minutes
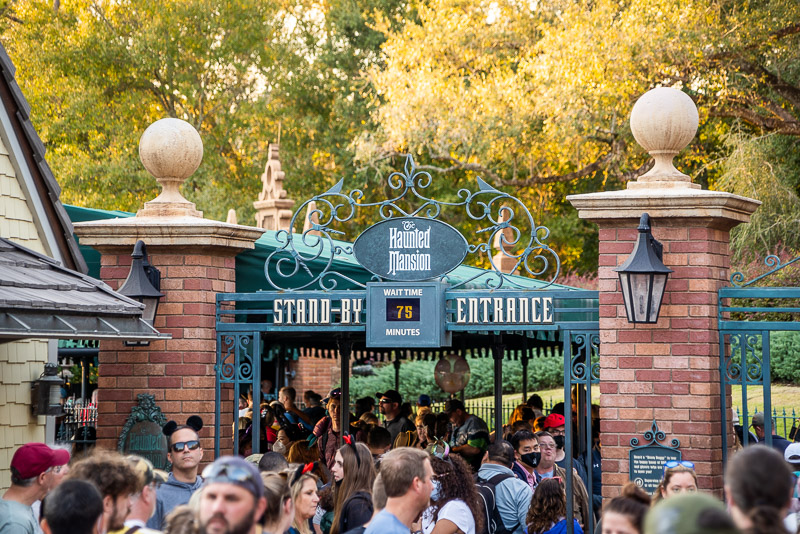
- Haunted Mansion: 57 minutes
These wait times were worse than many days during the holiday season–bad enough to rank as the 13th busiest day in the last 411 days at Magic Kingdom.
The refurbishment of Splash Mountain almost certainly resulted in higher wait times for Big Thunder Mountain and some other classic attractions. On top of that, it seemed like several attractions were simultaneously down throughout the day, which also would’ve inflated waits elsewhere.
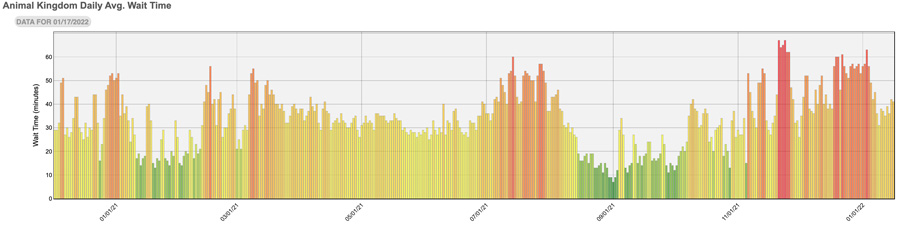
Animal Kingdom wait times tell a very different story, having fallen off significantly since January 9.
With that said, those are still 7/10 and 8/10 crowd levels–just not quite as out of control as during the holiday season when things got really bad.
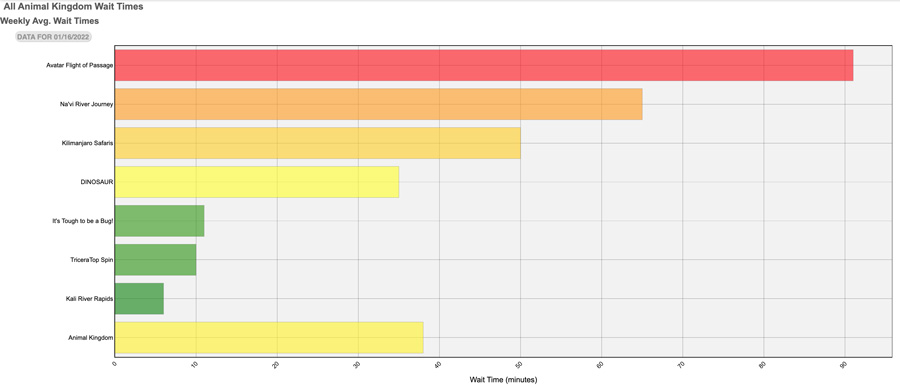
Over the weekend, Avatar Flight of Passage averaged 91 minutes and Na’vi River Journey averaged 65 minutes, numbers that are still high but down significantly since Christmas. Kilimanjaro Safaris was at 50 minutes, while Dinosaur averaged 35 minutes.
Also relevant here is that Expedition Everest is down for refurbishment until mid-April 2022. In another park, this would displace guests and result in higher waits elsewhere. To some extent, that’s probably happening. However, with so few rides in Animal Kingdom, it’s more likely that people are just finishing the park faster and leaving earlier. That would also explain some of the drop-off in average wait times–as would the return of Kali River Rapids, just in time for the coldest weeks of the year!
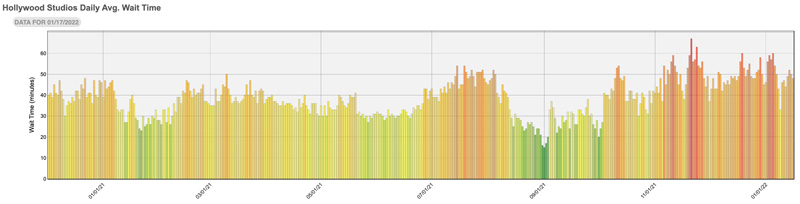
Then there’s Disney’s Hollywood Studios. After colossal crowds throughout the holiday season, it’s now “only” averaging 7/10 to 9/10 crowd levels. Downright delightful by comparison!
It’s doubtful that anyone in the park would agree with that assessment. Hollywood Studios is unpleasant when wait times are 8/10–it’s downright miserable at 10/10. DHS simply cannot absorb crowds with its current lineup, and “feels like” crowds are pretty bad once the crowd level is at 6/10 or above.
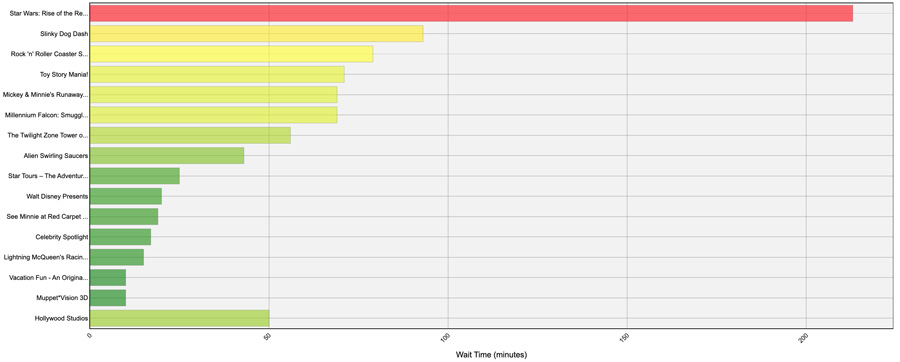
To illustrate, above are the average wait times by attraction. At first blush, those yellows and greens look pretty good, right?! Look closer at the scale, because Star Wars: Rise of the Resistance is really skewing it!
That’s an average 213 minute wait time for Star Wars: Rise of the Resistance (we saw it get up to 285 minutes!), along with Slinky Dog Dash at 93 minutes, Rock ‘n’ Roller Coaster averaged 79 minutes, Toy Story Mania averaged 71 minutes, Mickey & Minnie’s Runaway Railway averaged 69 minutes, Millennium Falcon Smugglers Run at 69 minutes, and Twilight Zone Tower of Terror hit 56 minutes.
The total average time it would take to do all 7 of those rides is exactly 650 minutes–or almost 11 hours. Despite a lower crowd level, this is actually more time than the same 7 headliners would’ve taken on most days during Christmas week. The difference is that more wait times have been added for things that don’t draw lines, like Celebrity Spotlight.
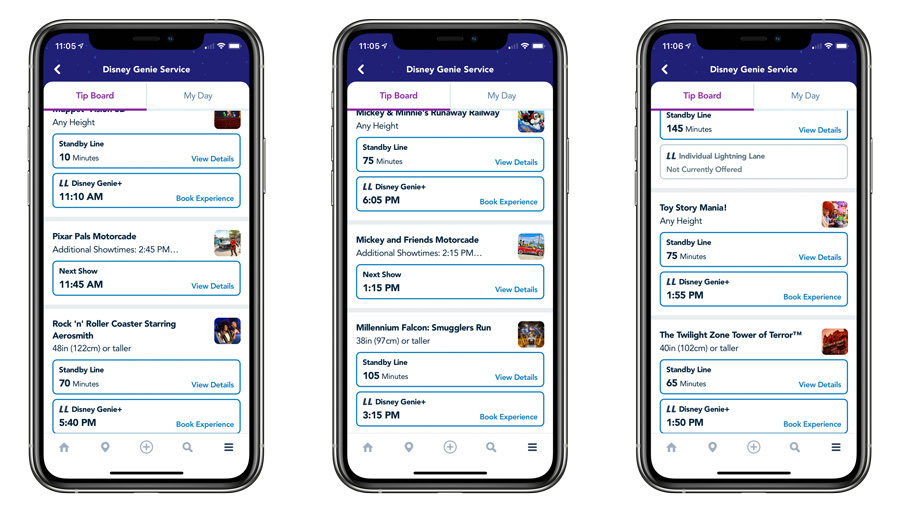
This is why Genie+ is worth it at Disney’s Hollywood Studios, even if you’re only able to knock out 3 headliners with it. That’s the likely scenario given that Slinky Dog Dash is gone within seconds and Millennium Falcon Smugglers Run fills up in under 2 hours after that (the latter is often refilled throughout the day, though). From our perspective, spending $16 per person to save 3+ hours on vacation is worth it.
Follow our Speed Strategy for Genie+ Selections and DHS Lightning Lane Ride Ranks to max out your Genie+ count at Disney’s Hollywood Studios. For comprehensive advice for all parks, see our Guide to Genie+ at Walt Disney World.
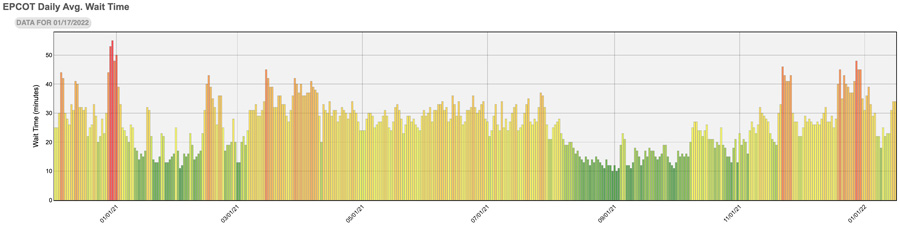
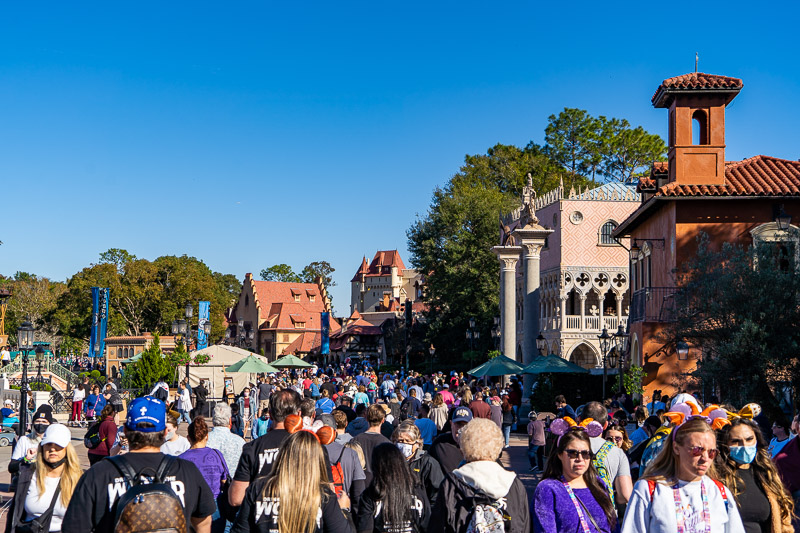
Continuing to Epcot, where attendance once again spiked over the weekend and hit 8/10 on the crowd calendar after several weekdays of 2/10 and 3/10s.
As always, “feels like” crowds at Epcot–especially in World Showcase–are always worse on weekends and evenings. We spend a ton of time at Epcot and we are almost at the point where we’d recommend disregarding crowd calendars entirely for this park as they’re practically useless. Wait time data simply does not tell the full story–or even the best story–when it comes to Epcot. There are simply too few rides and too many other reasons why people visit Epcot.
Exacerbating this discrepancy (for now) is that Remy’s Ratatouille Adventure doesn’t appear in the data for some reason. I assume this is because it just switched over from a virtual queue to a standby line and the team at Thrill-Data didn’t capture that change.
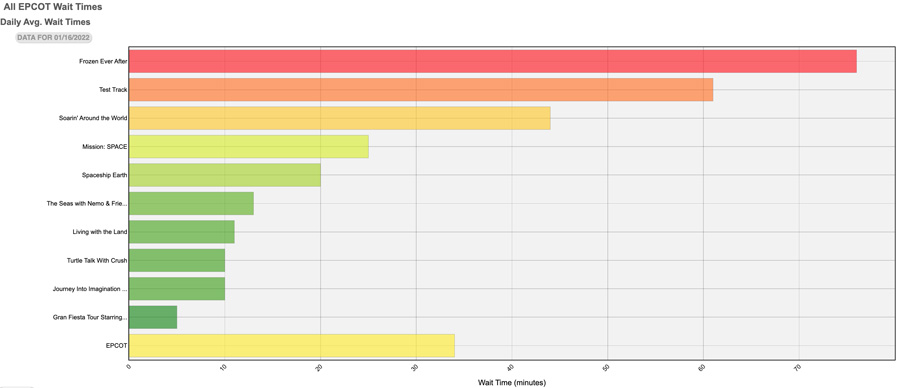
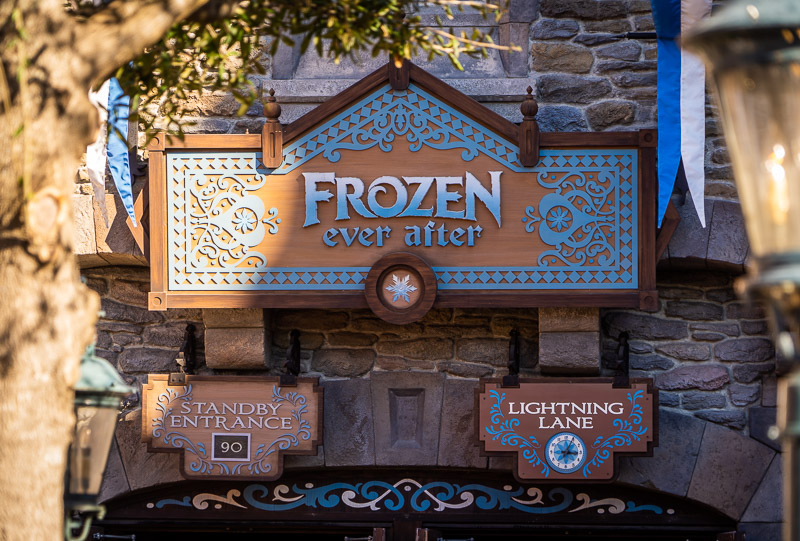
Previously, Remy’s Ratatouille Adventure virtual queue waits were being tracked, so there has always been something funky going on with that attraction. Setting that aside, average waits for headliners are still high: Frozen Ever After is averaging a 76 minute wait, Test Track is at 61 minutes, and Soarin’ Around the World is at 44 minutes. As we’ve mentioned before, Future World becomes a ghost town after 8 pm and ~95% of the guests in Epcot all cram into World Showcase.
In addition to omitting Remy’s Ratatouille Adventure, which (conservatively) would’ve averaged at least an hour wait, that data misses the festival crowds and food booth lines.
That includes the line for the Figment popcorn bucket, which was the longest of this year (or last) at Walt Disney World on Friday, but “only” a couple of hours most of the day on Saturday and Sunday.
With the start of the 2022 Epcot Festival of the Arts, many locals, snowbirds, and other Walt Disney World regulars are visiting the park without rides as their focus.
We aren’t fully representative of this demographic, but we spent almost two full days at Epcot over the weekend without doing a single ride. While many locals will do some attractions, their average daily ride count will be far lower than tourists.
Anecdotally, this weekend was the worst “feels like” crowds we ever remember experiencing at Epcot in January. Word has gotten out about Festival of the Arts (it only took 5+ years!), and we’re actually thankful for that, as it’s the one festival that definitely deserved much more love than it was getting.
Likewise, Magic Kingdom was really bad on Saturday. The difference there was that congestion more or less matched wait times. If anything, the park felt less busy after our experience with Epcot on Friday and with Magic Kingdom throughout the holiday season. However, wait times were actually longer than many days during Christmastime, and overflow queues seemed even worse. (We didn’t do Disney’s Hollywood Studios or Animal Kingdom over the long weekend.)
As we’ve stressed repeatedly, wait times are not conclusive of attendance. There are several other variables that can impact “feels like” crowds, from festivals at Epcot to weather to ride breakdowns to operational efficiency.
Beyond that, wait times can be manipulated by Disney, are often inflated, or otherwise inaccurate. They’re an imperfect measure of raw attendance or crowds.
With that said, wait times are still the best measure of crowds. The alternative is relying on individual guest perceptions, which are much more flawed and incomplete.
We are in the parks often, and I could easily identify the difference between a 5/10 and 10/10 day from congestion–but not between an 8/10 and 9/10 day. It’s impossible for us to be everywhere at once, and hard to know whether we’re in a pocket of crowds, what efficiency issues exist, and whether guests are disproportionately doing attractions or loitering about.
All of this is why we try to offer a blend of data plus color commentary with our anecdotal observations in these crowd reports. Now more than ever, it’s important to know that many guests aren’t visiting Epcot for attractions, that the front of the park empties out in the evening (and wait times plummet), and weekends are subjectively much worse than weekdays (they’re also objectively worse).
In a nutshell, this is why we share these crowd reports and add our own on-the-ground commentary to fill in some of the gaps and explain when, to us, the situation is better or worse than the wait time data suggests.
MLK Day Weekend has been one of those times when the actual on-the-ground situation is worse than the wait time data suggests. This is likely compounded for anyone who visited at this same time last year and found it delightfully uncrowded, as the circumstances are very different thus far this winter.
Looking forward, you can expect high crowd levels throughout much of this winter “off-season” (air quotes) at Walt Disney World. On the plus side, it’s still likely that the days and weeks between holiday weekends won’t be bad, and there will be some relative lulls in the crowds. Check out our January 2022 Crowd Calendar and February 2022 Crowd Calendar for more forward-looking predictions on that. With that said, even the “quiet” days this winter are going to be nothing like last year. That was an anomaly unlikely to be repeated–heavier winter crowds are likely to be a fixture going forward in 2023 and beyond. If you want off-season crowds, stick with September.
Planning a Walt Disney World trip? Learn about hotels on our Walt Disney World Hotels Reviews page. For where to eat, read our Walt Disney World Restaurant Reviews. To save money on tickets or determine which type to buy, read our Tips for Saving Money on Walt Disney World Tickets post. Our What to Pack for Disney Trips post takes a unique look at clever items to take. For what to do and when to do it, our Walt Disney World Ride Guides will help. For comprehensive advice, the best place to start is our Walt Disney World Trip Planning Guide for everything you need to know!
YOUR THOUGHTS
If you visited Walt Disney World for MLK Day Weekend or during the week before it, what was your experience with wait times and crowds? Predictions on crowds for the rest of this month and February 2022? Thoughts on our forecast, analysis, or anything else? Agree or disagree with our take on “feels like” crowds v. wait times? Any parks or times of day noticeably worse than the others? Do you agree or disagree with anything in our report? Any questions we can help you answer? Hearing your feedback–even when you disagree with us–is both interesting to us and helpful to other readers, so please share your thoughts below in the comments!
We were there the 14-20. We skipped parks on Saturday for a pool day and did Epcot on Sunday. I only bought Genie plus for MK and we only waited longer than 40 min once. I think people were turned off by the posted wait times and therefore wandering around making the walkways crowded. Otherwise is was an easy week. Disclaimer :we usually go on race weekends, so this weekend seemed mild in comparison.
We visited January 10th-12th and had very high wait times on all 3 days. We used Genie on Monday at Magic Kingdom and waited in two lines (Jungle Cruise 60 minutes Space Mountain posted time was 65 ended up being almost 90) and left at about 3 p.m.. We did extra Magic hours at Epcot and were able to walk on Soarin waited about 30 minutes for Test Track and then we were told Ratatouille and Frozen were broken before closing at 11 p.m.. There were a lot of glitches with the also we were very surprised by the wait times at Epcot and Hollywood on Tuesday. Wednesday morning at Hollywood we got lucky with the wait times but at about 10 a.m. everything was showing an hour plus and we left at 11 after watching a parade. Friends of ours were there the Thursday-Sunday before us during the Marathon and they said most of the rides were walkons.
Hi Tom,
I enjoy your posts. They are very helpful when I plan my trips to Disney! I did an overnight solo trip for the Arts Festival on Sunday-Monday. Based on your previous post about Caribbean Beach, I stayed there. It was a very nice room and taking the skyliner to EPCOT was indeed convenient and fun.
The crowds weren’t too bad on Sunday (because of the weather) but they were insane on Monday! Also, during my last two solo trips to Disney, I have not been able to eat at a sit-down restaurant. I haven’t been able to snag a reservation in advance, and surprisingly, have not been able to walk up either. I went from Topolino’s to Le Cellier to Steakhouse 71 on Sunday night and not a single one of them could seat me. I finally ended up eating an okay burger at the hotel at 8:45 pm. Same thing happened when I went on to MK/HS on December 10th. It’s getting to be a little frustrating. Have you heard from anyone else that they are having this same problem as a party of one?
Many thanks!
Patty
Disneyland was good during MLK weekend. Busy but not overwhelming. We did not use Genie and the only ride we skipped was Rise of the Resistance because we have done it several times before and did not want to wait 50 minutes or buy passes.
Here right now starting Sunday and so far it has been crazy!! Today was our DHS day and was up exactly at 7am, but by 7:05 Rise of Resistance and Slinky were sold out!! Wait times for both of those soared above 100mins today, Tuesday. That being said DHS should be called “The Park of Temporary Closures” as within the first 30mins from opening Rise of Resistance, Tower of Terror, Runaway Railway and Toy Story Mania were all closed for some period of time. This allowed standby passengers to get lightning lane vouchers for later returns at their convenience which clogged the lightning lanes for those who booked early and/or paid. I can tell you for a fact that the Brazilian contingent has returned as I ran into many guests speaking Portuguese and wearing Brasilia attire. A lot of people at guest services tents first thing which makes me believe these people know how to work the system and are taking advantage of the system to get extras!!