
Off-Season is Ending at Disney World
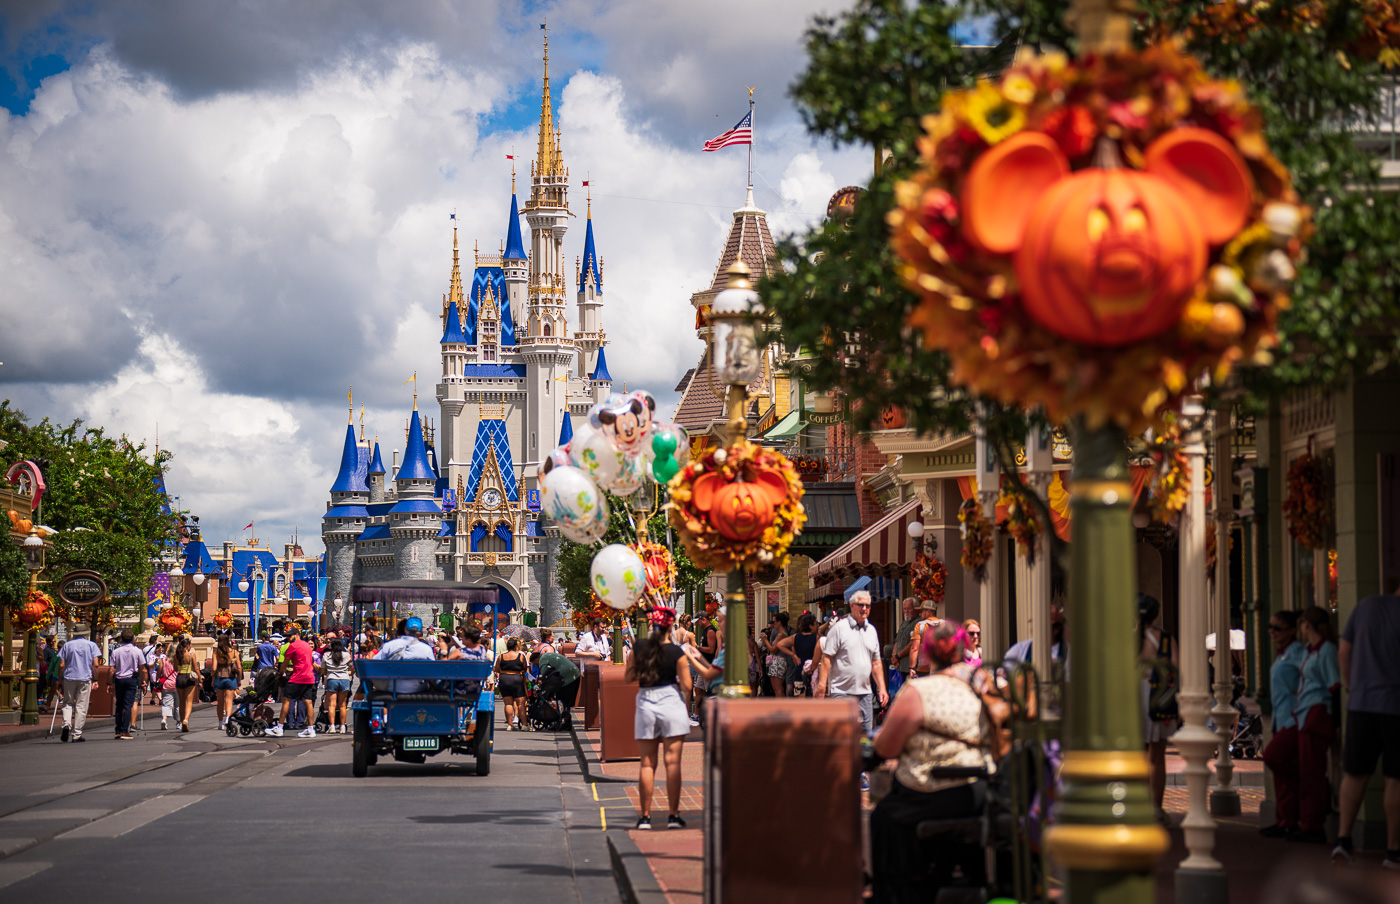
Depending on who you ask, the 2026 off-season at Walt Disney World lasted somewhere between 6 days and 4 months, or didn’t happen at all. Regardless, we all likely can agree that low crowds will not extend deep into October 2026. At least, not with any consistency. This wait times report covers data for September, along with our post-summer experiences in the parks.
As discussed previously, I’m starting to agree with this notion that Walt Disney World’s offseason, in the traditional sense of the term, is disappearing. At least, the clearly-defined offseason that used to start right after back to school in August and continue for the next six or so weeks. That was a tried and true timeframe with reliably lower crowds than May through July.
To the extent that I disagree with the fans who claim off-season doesn’t exist, it’s those who claim that it’s because every date at Walt Disney World is now busy. That there’s never a slowdown. To the contrary, the issue isn’t that the offseason has gotten busier at Walt Disney World. It’s that the shoulder and summer seasons have gotten progressively less busy, resulting in little daylight between random dates in June versus September.
As we’ve been reporting for a while, summer is not peak season (or anywhere close to it). The last two summers have been even slower than the new normal, and there’s a strong argument that Summer 2026 was the off-season. The wait times data for June and July would seem to demonstrate that.
Along with that, there was a slowdown over the course of the last six weeks, but it was barely a blip when starting from that lower baseline. And it’s now likely coming to an end with the heart of the Halloween and holiday seasons on the horizon.

Before we dig into the numbers, we’ll start with the normal asterisk that crowd levels are based exclusively on posted wait time data. It’s valuable for tracking and comparing days, weeks, months, and years. A lot can be learned from posted wait times, but they’re not necessarily conclusive of in-park congestion, despite being referred to as crowd levels.
Posted wait times offer insight into how busy Walt Disney World is, but they are an imperfect measure. They’re almost always inflated, some lines don’t post wait times, they don’t account for Lightning Lane changes, EPCOT festivals, etc. Regardless, wait times are the only objective measure of crowds that we have, so they’ll have to suffice.
If you want to understand more about these reports and crowd calendars, their strengths and limitations, or addressing misconceptions about crowds, see our list of the “Top” 10 Ways Walt Disney World Fans Are Wrong About Crowds. That’s worth reading if you want a better understanding of WDW attendance patterns, feels like crowds vs. wait times, and a few fairly easy ways to “beat” the crowds.
With that background out of the way, let’s take a look at recent Walt Disney World crowd levels. As always, all graphs and wait time stats are courtesy of Thrill-Data.com:
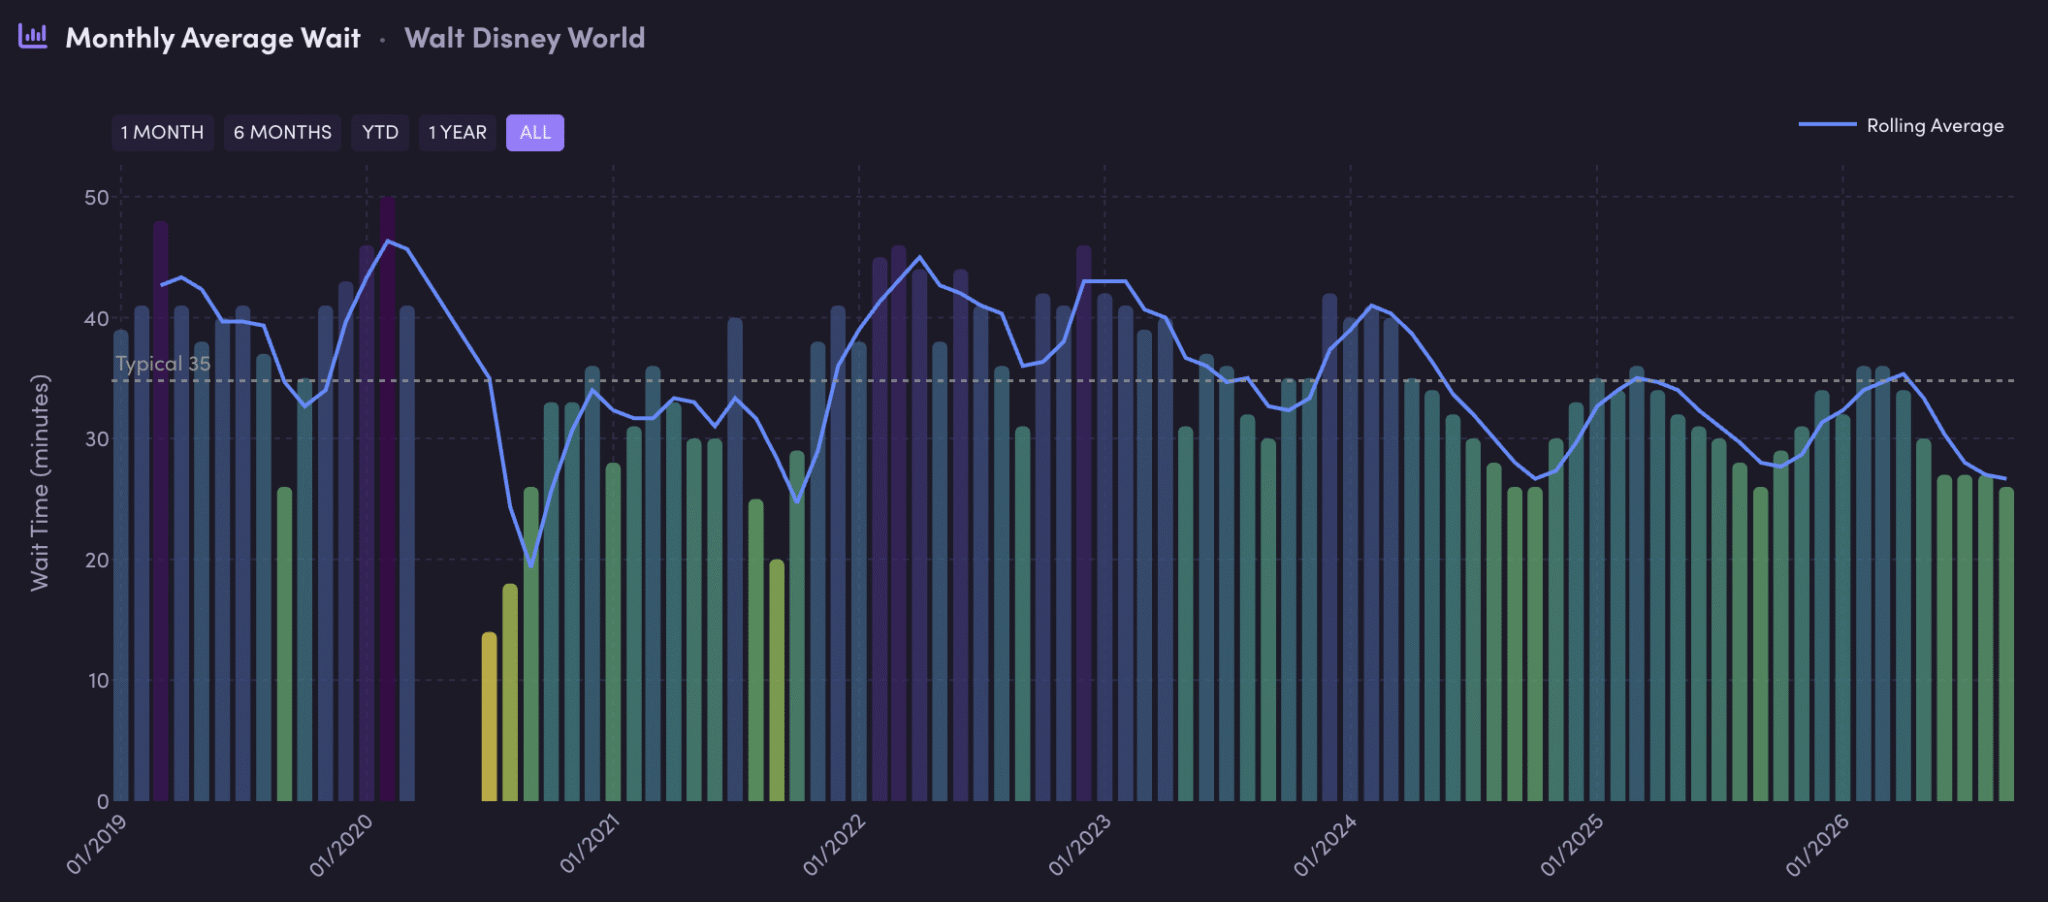
Let’s start by looking at monthly wait times data for Walt Disney World as a whole, which tells an interesting story.
Here are the monthly averages for this year:
- March 2026: 36 minutes
- April 2026: 34 minutes
- May 2026: 30 minutes
- June 2026: 27 minutes
- July 2026: 27 minutes
- August 2026: 27 minutes
- September 2026: 26 minutes
Here are the monthly averages for last year:
- March 2025: 36 minutes
- April 2025: 34 minutes
- May 2025: 32 minutes
- June 2025: 31 minutes
- July 2025: 30 minutes
- August 2025: 28 minutes
- September 2025: 26 minutes
When it comes to summer vs. off-season, this one chart tells the tale. Last year’s dynamic is precisely the contrast you’d expect in a normal, and consistent with previous years. Wait times peaked in March, and then decreased every month until bottoming out in September.
They then typically increase again starting in October, climbing every month until peaking the following March. That’s roughly normal for crowds between spring break and fall break, with further spikes for the holidays and winter months. Hence the title that off-season is ending. The next several months will presumably follow this trend, with heavier crowds than the last 5 months.
The normal dynamic played out in 2026 for spring break and into shoulder season. The difference is a sharp drop-off in June and July 2026 that was more extreme than normal, and on par with last year’s August and September off-season. That’s what created the ‘problem’ we described above. Given the drop for summer, there was less room for even more of a slowdown and August and September.
If we stopped here, it would be a pretty open and shut case. Depending on the story you wanted to tell, either the entire summer is now the off-season, or the off-season is dead and has been replaced by an extended ‘summer season’ defined by higher heat and lower crowds, but not a sharp slump.
The good news is that August 2026 was down year over year as compared with August 2025, and September was down slightly as compared to this August but flat year over year, making it the slowest month of both years. Off-season lives! However, the average tourist isn’t visiting for an entire month, so it’s worth delving deeper and seeing what weekly and daily trends emerge…
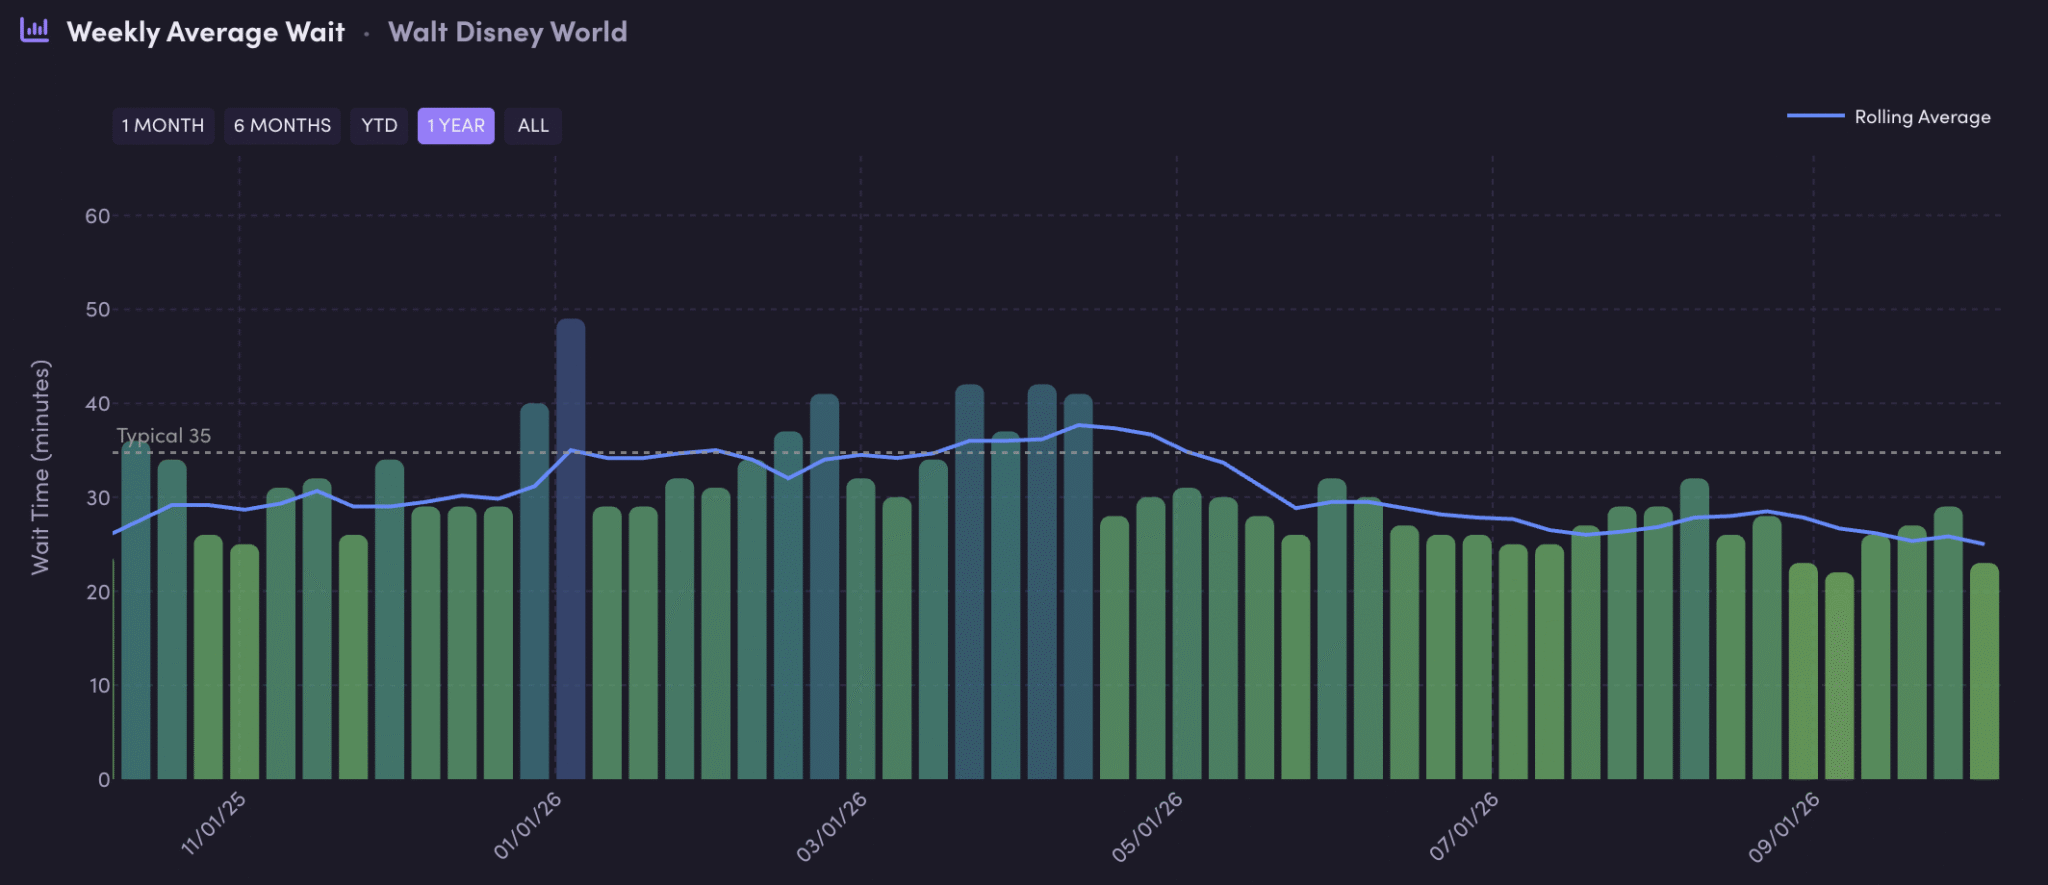
Here’s the weekly view for the last year, which shows the slowdown in action since shortly after Easter, about halfway into the graph. There are two milder slowdowns, one shortly after Memorial Day and another following back to school in the second August.
There are typically two peaks in summer. The first is at the end of June, and it did not happen this year. That was replaced by the week around the Memorial Day long weekend, which was also the kickoff of Cool Kids’ Summer and the launch of several new offerings.
The second is usually in the second half of July and into early August. That one was longer and higher than expected, especially the later portion, with the first week of August 2026 being tied for the busiest week of summer with Memorial Day.
Crowds decreased dramatically after that, on par with past off-seasons. The two slowest weeks ended up being the last of August and first of September 2026. As you can see, there’s actually been a slight increase since, but still consistent with off-season.
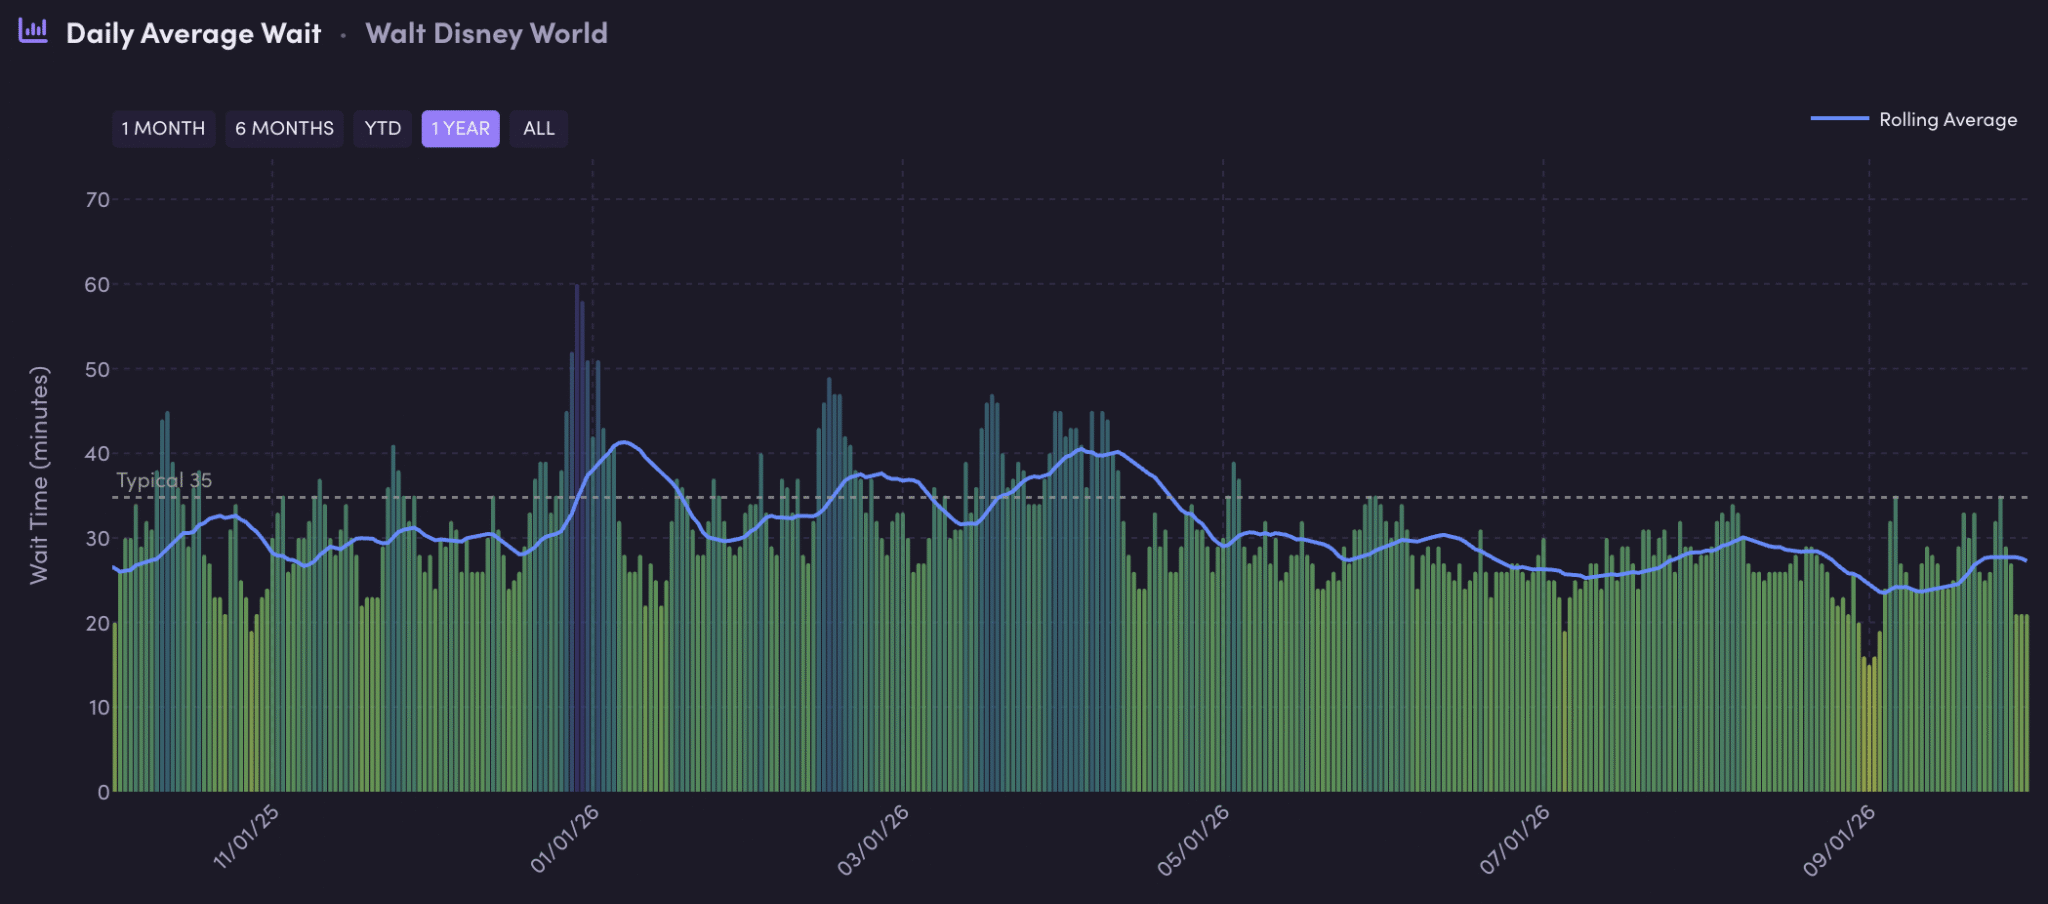
Here’s a look at the daily data for Walt Disney World as a whole. The busiest days of summer were those immediately after Memorial Day and August 3-7, 2026. Late July also got progressively busier, but it was still firmly in low-moderate territory.
At the other end of the spectrum, Sunday, July 5, 2026 was the least busy at Walt Disney World of summer. We’ve already covered this at length, but Independence Day is a consistently great time to visit.
Then there’s the absolute slowest stretch of not just this off-season, but any 4-day period (August 31 to September 3, 2026) since 2021. Here’s the data from those days:
- August 30, 2026: 20 minutes (1/10 crowd level)
- August 31, 2026: 16 minutes (1/10 crowd level)
- September 1, 2026: 15 minutes (1/10 crowd level)
- September 2, 2026: 16 minutes (1/10 crowd level)
- September 3, 2026: 19 minutes (1/10 crowd level)
- September 4, 2026: 24 minutes (1/10 crowd level)
After that, crowd levels actually did, with the Saturday and Sunday of Labor Day weekend having 4/10 and 5/10 crowd levels. Although we predicted those would be the busier days of the holiday weekend, they were admittedly much worse than anticipated.
Even Labor Day itself was a 2/10 crowd level, which was higher than our “dead” forecast. We were in the parks to take advantage of the anticipated lower wait times, and were taken aback at the year-over-year increase. Thankfully, the days that followed were slow, with Monday at 2/10 and the three days that followed all at 1/10 crowd levels and 24 minute averages.
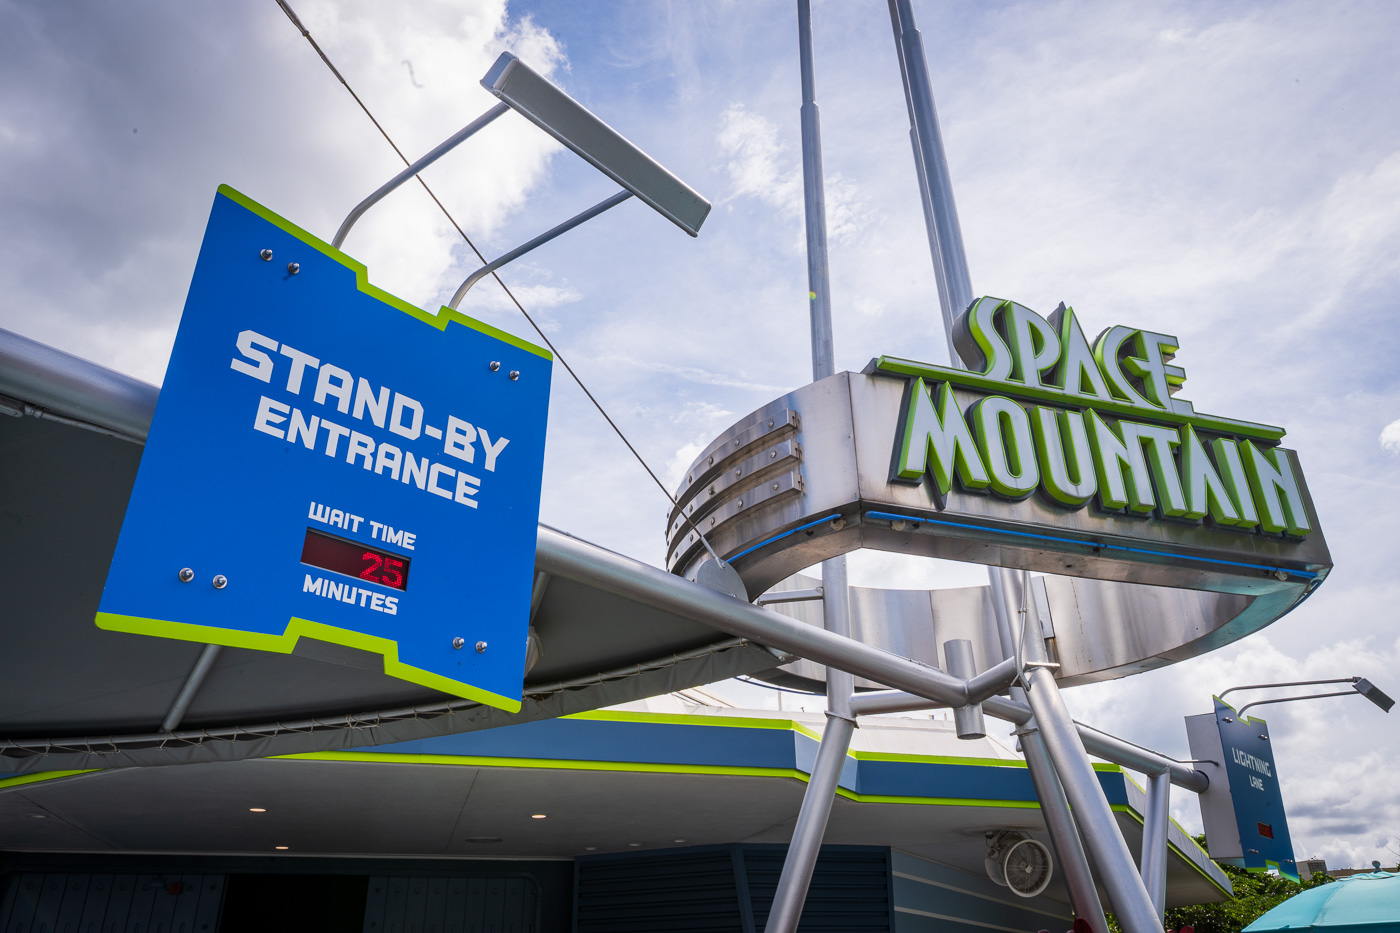
To put the above numbers into perspective, anything at or under 26 minutes is a 1/10 crowd level. The crowd level with the highest range of possible waits is 10/10, which can be 52 minutes to infinity minutes.
Second behind it is 1/10, which can be 0 minutes to 26 minutes. The other crowd levels have ranges of 1-2 minutes, which I personally feel is a bit too narrow to be meaningful, but no one asked me. I’m not a statistician or data scientist or whatever.
Those are all 1/10 crowd levels, but anything under 20 minutes is what we’d consider “downright dead.” For reference, July 5, 2026 is in the same ballpark; it had a 19 minute average. Even the Fourth of July was only 23 minutes. From that, it should be clear that the best times to visit over the summer and off-season are Independence Day and the last week of August into early September.
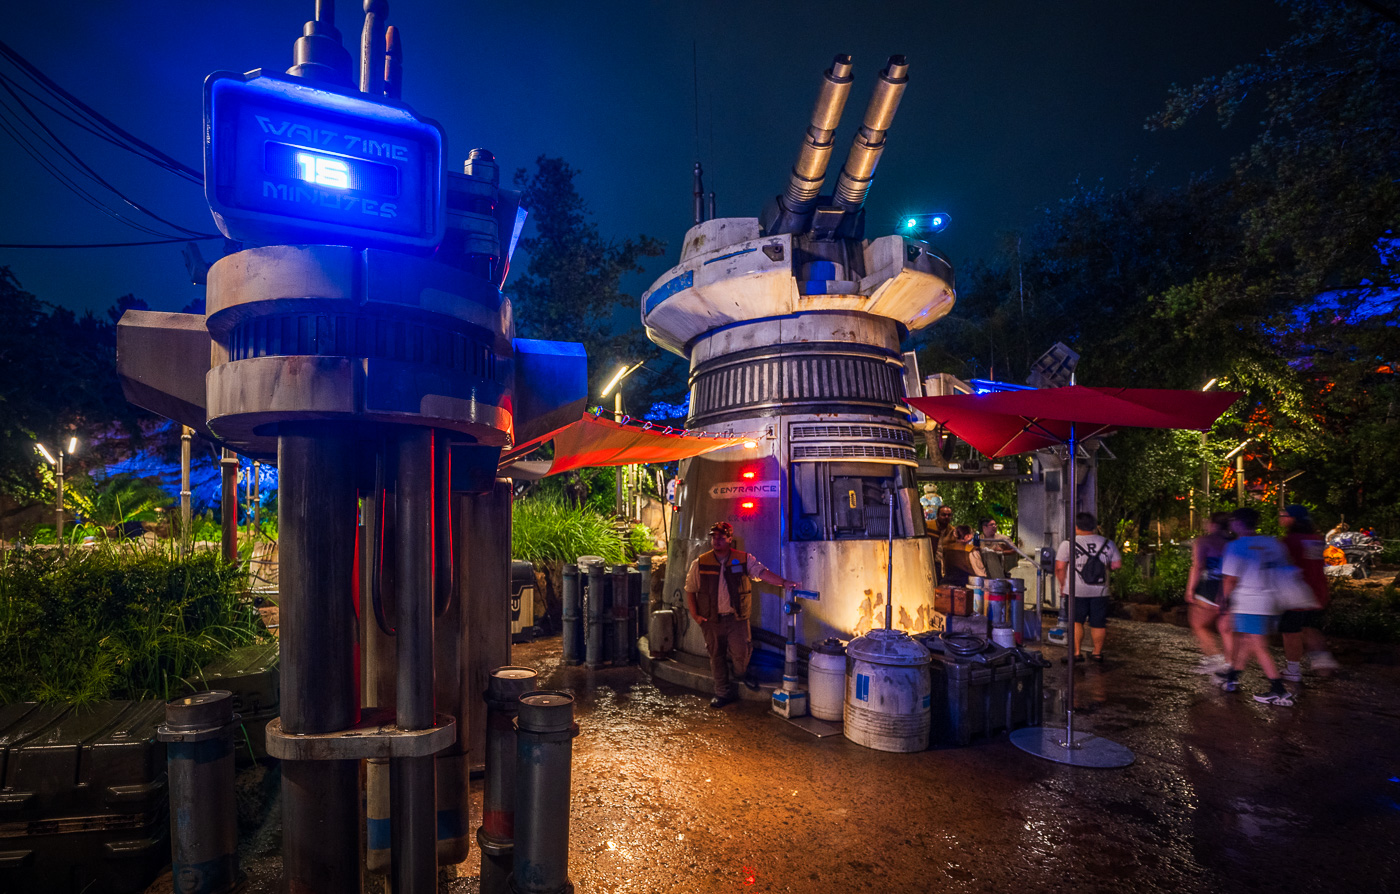
The last few days have also been slow, with September 29 through October 1, 2026 all having 20 minute averages and 1/10 crowd levels. This is also fairly consistent from year to year, but the trouble with it is the timing of the Florida resident ticket deal coming to conclusion, which varies from year to year. The last day of use is October 3, 2026, which should spike crowds on Friday and Saturday.
After that, Sunday and the first half of next week will mark the end of off-season at Walt Disney World. This doesn’t make our list of best weeks, but it’s usually in the ballpark of 3/10 crowd levels.
We’ll be in the parks once again over the weekend and into early next week to take advantage, while also enjoying the 55th festivities (and getting in one last trip for our daughter before the dreaded age 3 pricing cut-off).
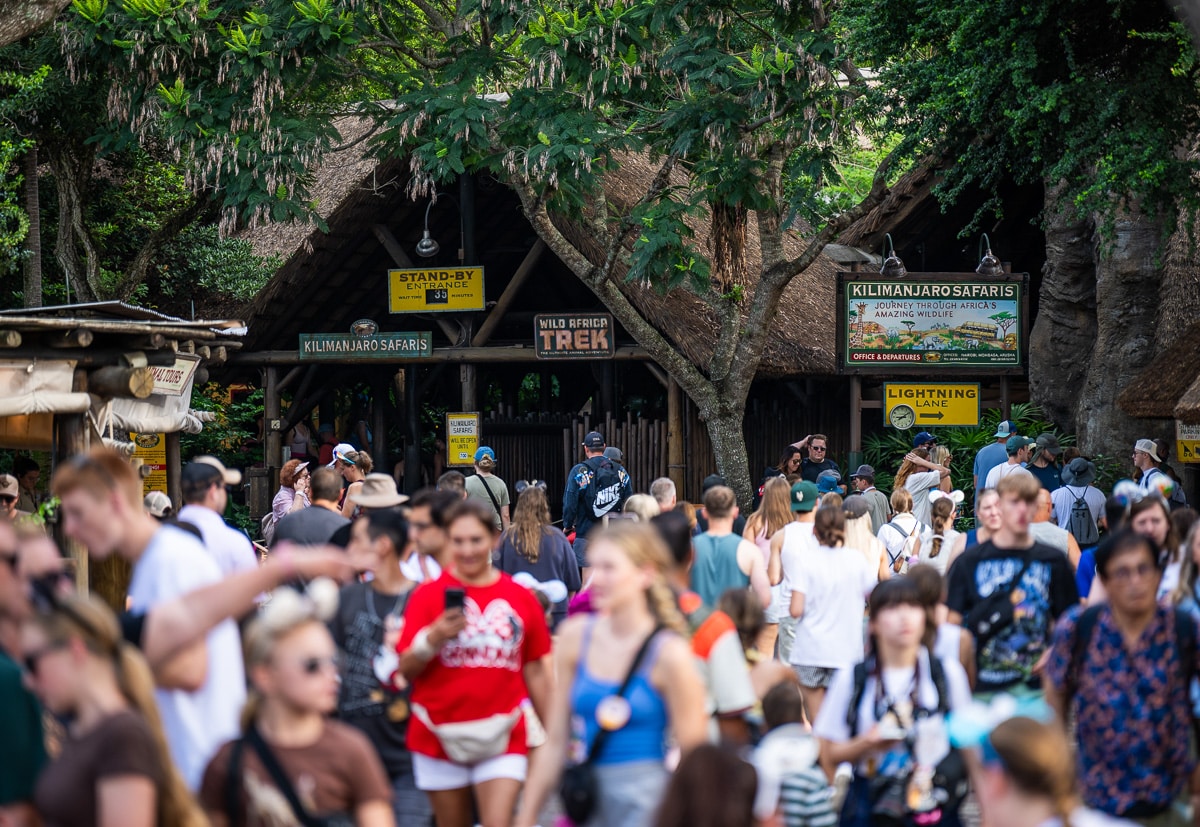
What several of our recent visits have underscore is that there’s a very pronounced “feels like” difference between the lower of those 1/10 crowd level days and anything above 3/10.
That’s especially true since individual parks can vary considerably, and Party Season is prone to wider swings than the rest of the year; we even had a couple of 7/10 days despite Walt Disney World as a whole never going above 5/10.
Whereas we’ve almost exclusively done party-shortened days in Magic Kingdom (and they’ve been glorious), our experiences in EPCOT and (especially) Disney’s Hollywood Studios have been much more of a mixed bag.
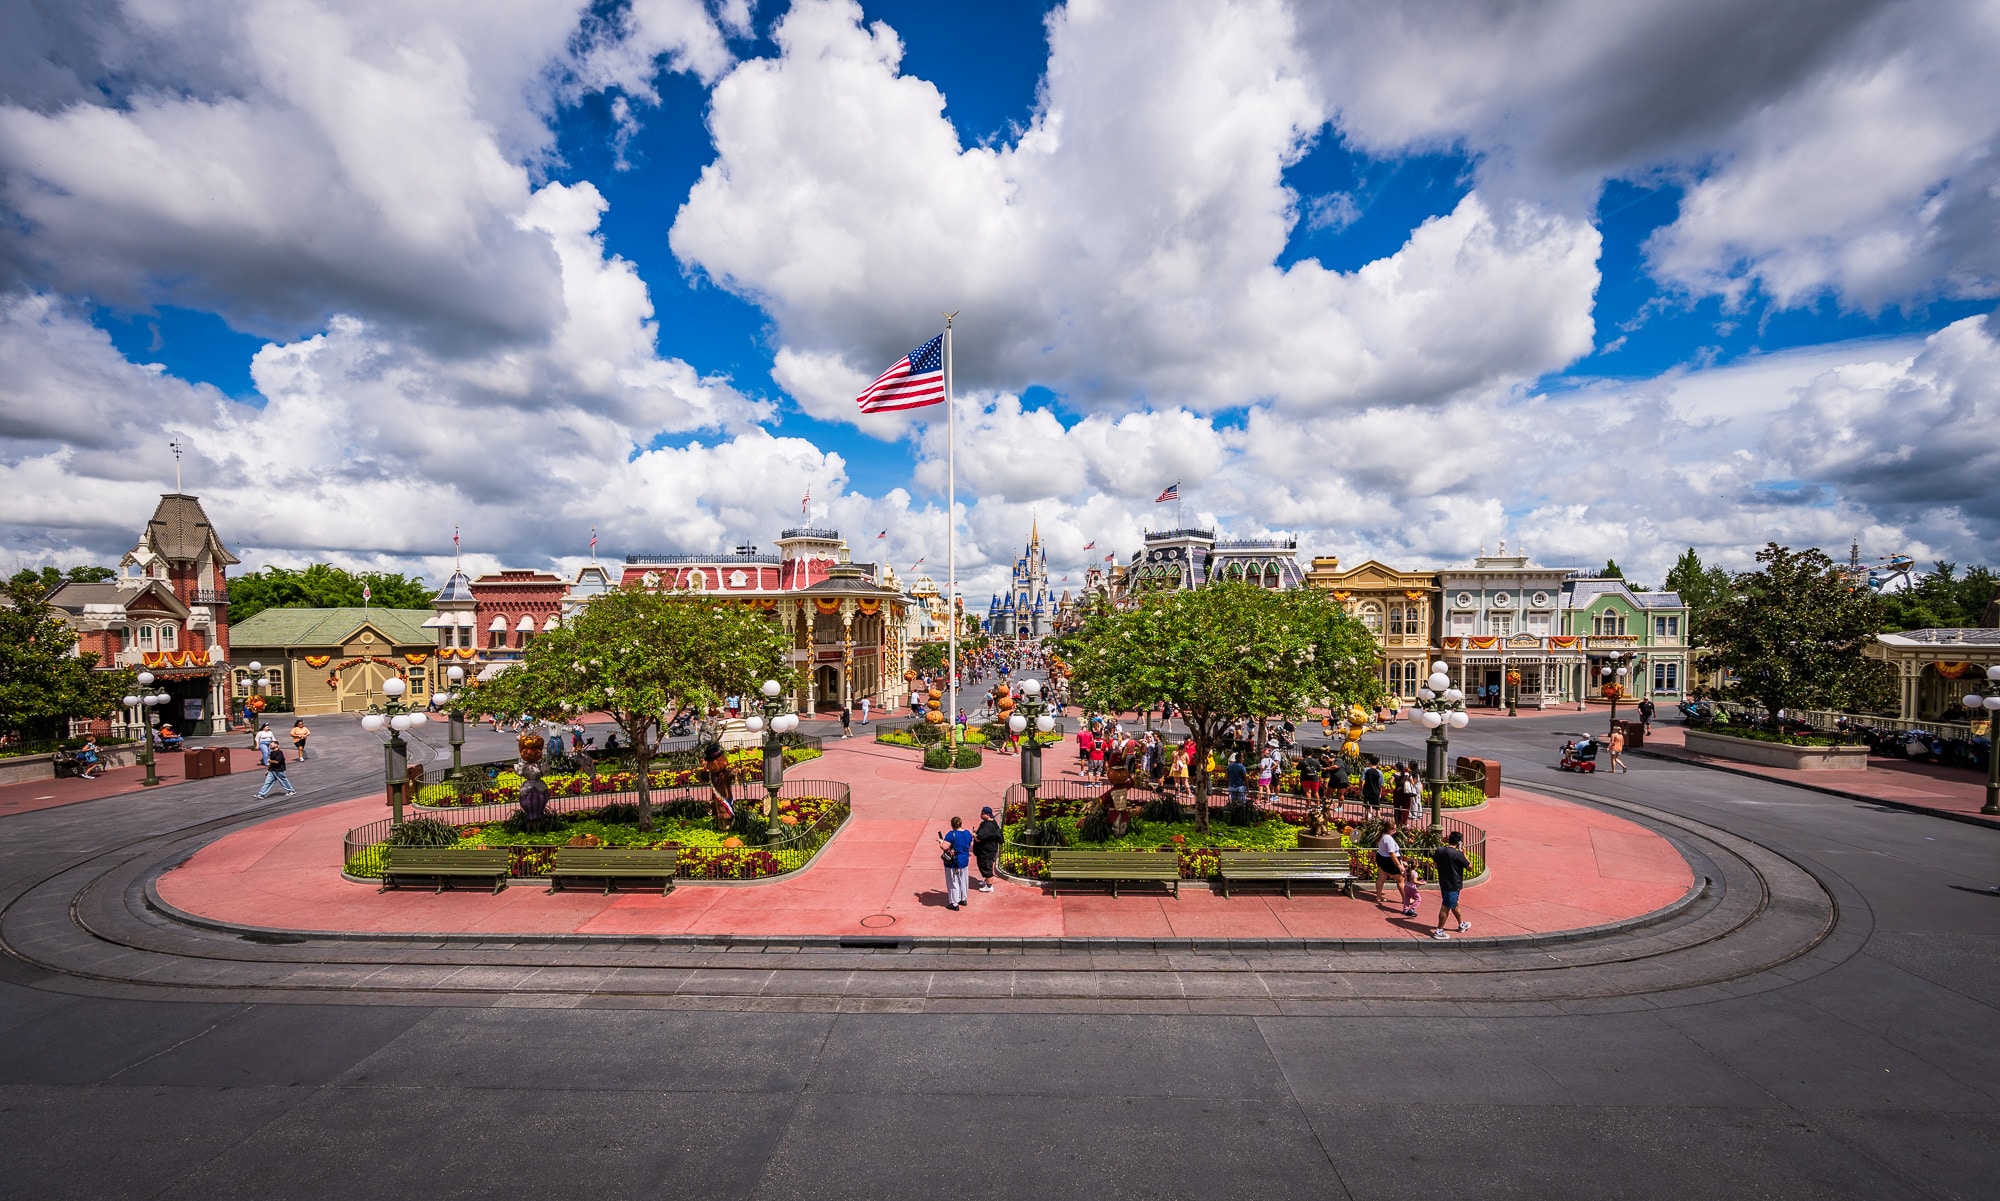
We’ve experienced low lows and higher moderates (not sure what the term is for that) with trips that overlapped slower and busier dates.
Three of them, in fact: the busier Memorial Day into the quieter early June window; the ‘last hurrah’ before back-to-school into the start of off-season; and again with the dates before and after Labor Day contrasted with the weekend itself. I assume the same is going to happen again with late September and early October, versus a likely spike this weekend.
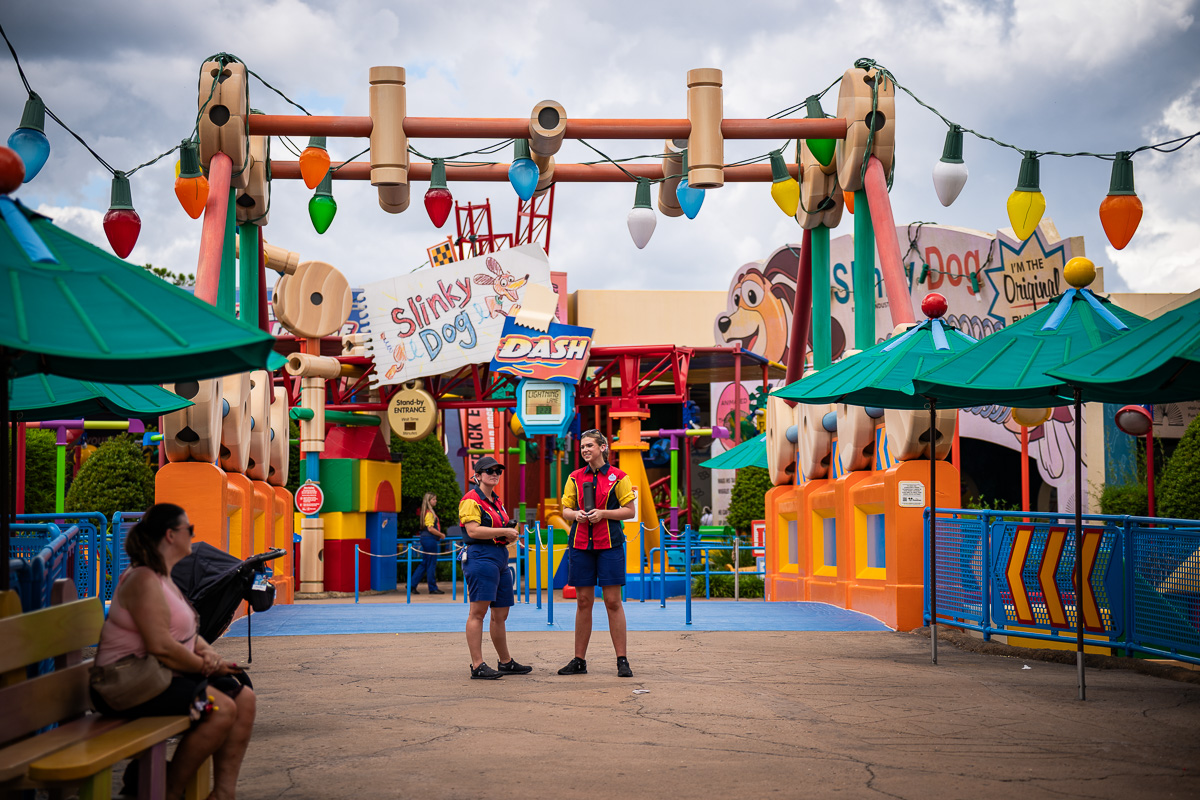
Weather and attraction downtime also come into play. Beyond Slinky Dog Dash, which has had issues beyond just its multi-day closure, we’ve noticed what seems like an inordinate number of delayed openings, breakdowns, and extended downtime during our days in the parks. The weather also has a push-pull effect, with the combo of high heat and intense storms clearing out crowds, but then those showing up in full force when conditions have improved.
The swing in average wait times may not seem extreme, and it certainly isn’t like going from early December to New Year’s Eve (now that is truly a huge spread). But even differences of a few minutes add up, and are typically much more significant at popular attractions. You can also feel a pronounced difference if you visit on a truly slow day versus even a moderately crowded one.
Anyone who thinks the off-season no longer exists should take a trip during the back-to-school overlap, from late August/early September, or even the current week. Context and frame of reference are key in “appreciating” low crowd levels, and here we’re only talking about going from (overall) 1/10 crowd levels to 3/10-5/10.
It’s not like any of these dates went from 1/10 to 9/10 or 10/10! Many Walt Disney World guests who visit during slower timeframes are unaccustomed to just how bad truly busy really is, comparatively.
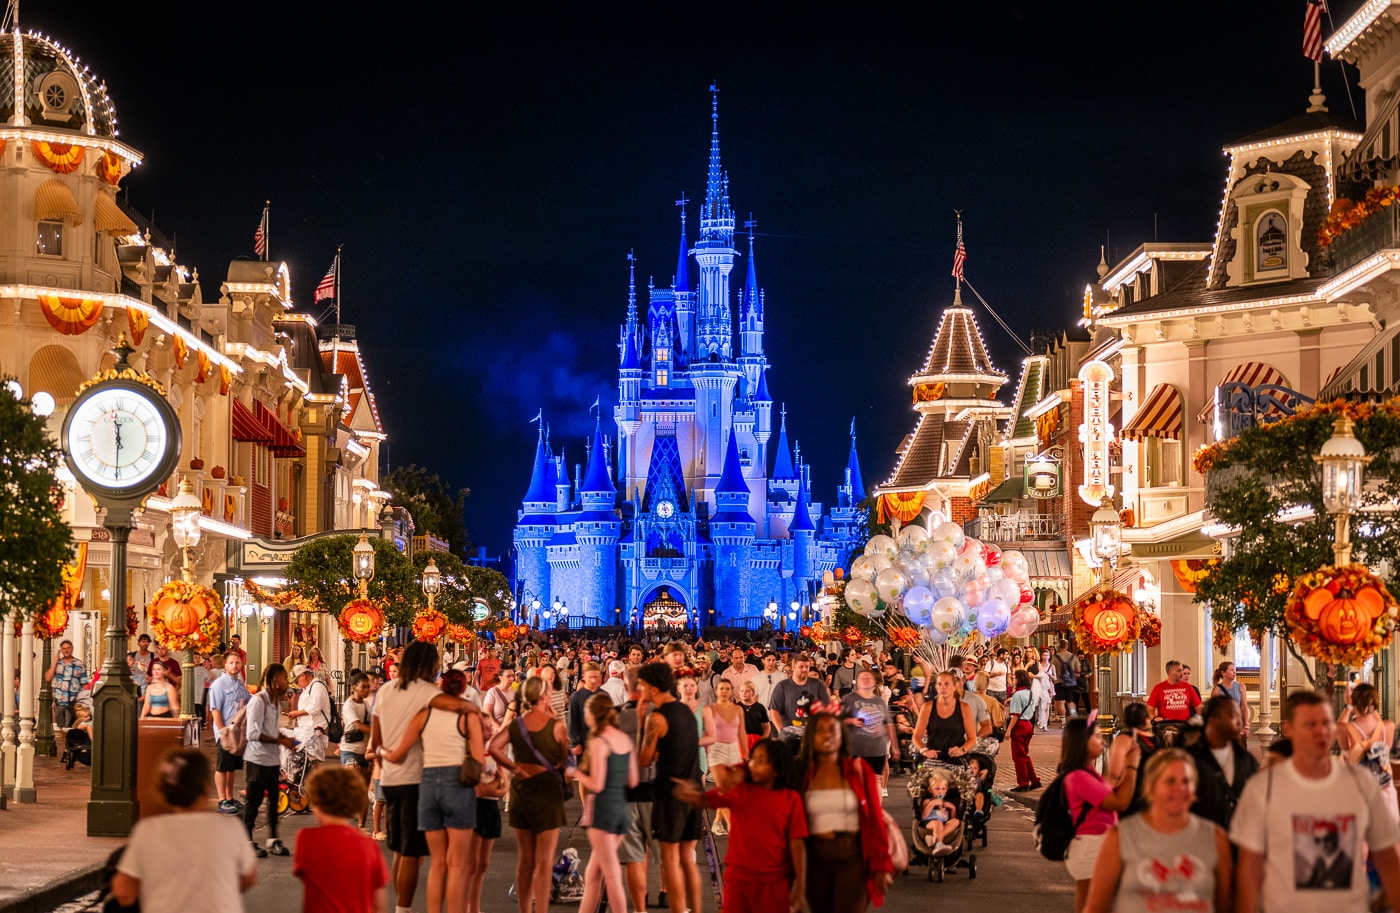
Even as off-season comes to an end (whether that means a multi-week stretch since back-to-school or multi-month window spanning pretty much the entirety of summer is your call), the good news is that the final three months of the year are not wall-to-wall people. October through December will get progressively busier, but there are reprieves from the crowds, including several fantastic times to visit.
Looking forward, there’s a reason our 10 Best and 10 Worst Weeks to Visit Walt Disney World in 2026 to 2028 target 4 different weeks in October through December–that’s 40% of the list! These are optimal times to visit not just in terms of crowds, but also weather and seasonal offerings. They are veritable oases amid a series of school breaks, holidays, and surprisingly busy stretches, many of which will also put the contrast between slower and busier timeframes at Walt Disney World into sharp relief.
Planning a Walt Disney World trip? Learn about hotels on our Walt Disney World Hotels Reviews page. For where to eat, read our Walt Disney World Restaurant Reviews. To save money on tickets or determine which type to buy, read our Tips for Saving Money on Walt Disney World Tickets post. Our What to Pack for Disney Trips post takes a unique look at clever items to take. For what to do and when to do it, our Walt Disney World Ride Guides will help. For comprehensive advice, the best place to start is our Walt Disney World Trip Planning Guide for everything you need to know!
YOUR THOUGHTS
What are your thoughts on off-season crowds at Walt Disney World? If you visited recently between roughly Memorial Day and start of October 2026, have you felt a noticeable difference in crowds and wait times? Do you agree or disagree with our assessment? Any questions we can help you answer? Hearing your feedback—even when you disagree with us—is both interesting to us and helpful to other readers, so please share your thoughts below in the comments!





Our family was there 09/01 – 09/08 and for sure felt the smaller crowds early in the week. The weekend picked up for sure, especially at Epcot with the locals coming in for the first weekend of Food and Wine. I will say that the heat and humidity, coupled with the rain every late afternoon and evening, will keep us away from returning at this time in the future. We were also disappointed with Slinky Dog being down multiple days (thankfully we got it in on the 7th when it surprisingly came back online as we were rope dropping DHS). Was also disappointing to have the whole first half of Rise down. My daughters were excited for that ride and didn’t get to experience half of it. Not as exciting walking up the stairs of the First Order’s office building and onto the Star Destroyer. Just sayin. 🙂
I would recommend mid February or May during the shoulder season. Weather is far better and the crowds are great!