
It Was NOT Winter’s Worst Week at Disney World
For over a year, we’ve been raising ‘red flags’ in our updated 2023 Walt Disney World Crowd Calendar about last week due to the confluence of holidays, special events, and school breaks. In this wait times report, we’ll see how those predictions compared to reality, covering what we got right and wrong.
Going into last week, expectations were incredibly high. In addition to the flagging that week for a while, we had a standalone post at the start of this year warning that the the Worst Week of Winter is Coming at Walt Disney World. Our forecast called for last week to be the busiest week of the first quarter and said it could be one of the 5 worst weeks of 2023–right up there with Thanksgiving, Christmas, New Year’s, and the peak of spring break.
That timeframe we identified for these colossal crowds was approximately February 17 to February 26, 2023. This particular week and the weekends around it were expected to be very bad due to Presidents’ Day and Mardi Gras once again coinciding. The last time that happened, all 4 parks hit capacity, park hours were extended at the last minute, and the parks experienced peak crowd levels.
Despite the two holidays not coinciding last year, it was a very similar story. The week of Presidents’ Day was still one of the worst weeks of the year–right up there with the peak of Spring Break, and Thanksgiving. It was surpassed by Christmas and New Year’s Eve by a pretty wide margin, with far higher wait times than the low to moderate weeks before it in January and February.
In particular, the Wednesday after Presidents’ Day was the busiest day of the year for months after, “thanks” to a 10/10 crowd level and average wait time of 61 minutes. It was not dethroned until the Monday of Thanksgiving finally surpassed it, with a 64 minute wait. During winter break after Christmas, many other days ended up having similar 61+ minute average waits. But for several months, no week was worse than that of Presidents’ Day.

Compounding the crowds this year, there were several cheerleading events at the ESPN Wide World of Sports on both weekends bookending the holiday and the 2023 Disney Princess Half Marathon Weekend. That meant more school breaks due to both Mardi Gras and Presidents’ Day happening simultaneously, plus those sporting events drawing even more guests to Walt Disney World.
At least in part, we already have an idea of how crowds played out at Walt Disney World over the holiday week. As discussed in Genie+ Sold Out for the First Two Times Ever at Walt Disney World, the paid FastPass service stopped sales on Presidents’ Day and the Sunday prior to it, with the paid FastPass service selling out between noon and 2 pm those days. This was despite it reaching its record price point on both–$29 per person, before tax.
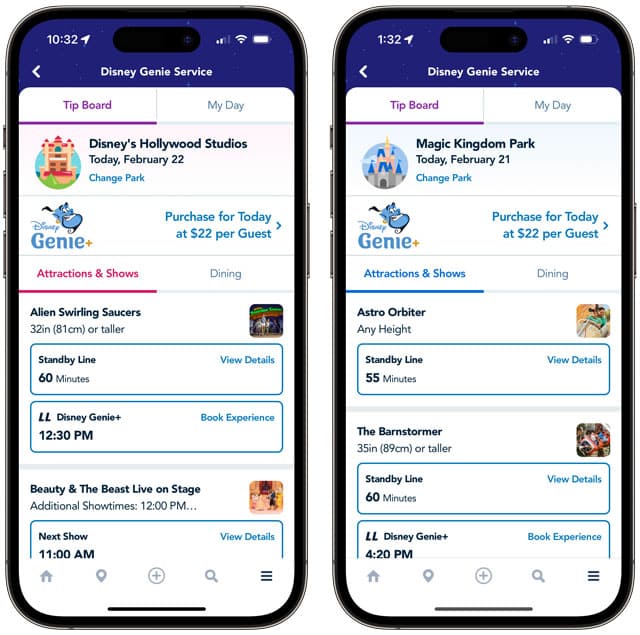
On Tuesday, the price of Genie+ dropped back down to $22 per person (pre-tax) and the paid FastPass service did not sell out. It stayed at that price point through Friday, and then dropped even further to $20 for the weekend. Genie+ prices are usually a strong indicator of internal attendance forecasts by Walt Disney World.
As a result of this, you might be inclined to assume that Walt Disney World was less busy on Tuesday. However, that was not the case according to wait time data. Across the entirety of Walt Disney World, the average wait time was 56-57 minutes on Saturday through Monday–the holiday weekend days when Genie+ was $29 per person.
Tuesday ended up being the busiest day of the holiday week, when the average wait time across Walt Disney World was 61 minutes. Sound familiar? It’s essentially a repeat of last year, right down to the same exact wait time. The only difference is that the peak occurred on Tuesday instead of Wednesday this year, but there’s not really any significance in that.
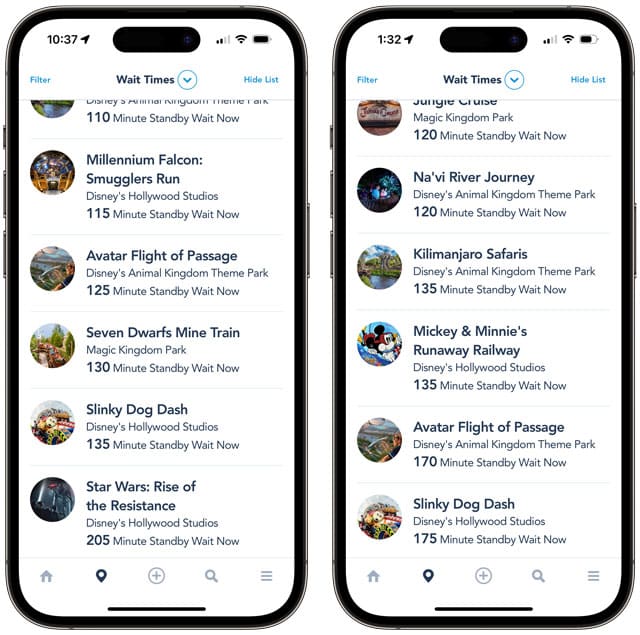
What’s more interesting is what happened the rest of the week, and for that, we’ll turn to posted wait time data. As always, all graphs and stats are courtesy of Thrill-Data.com:
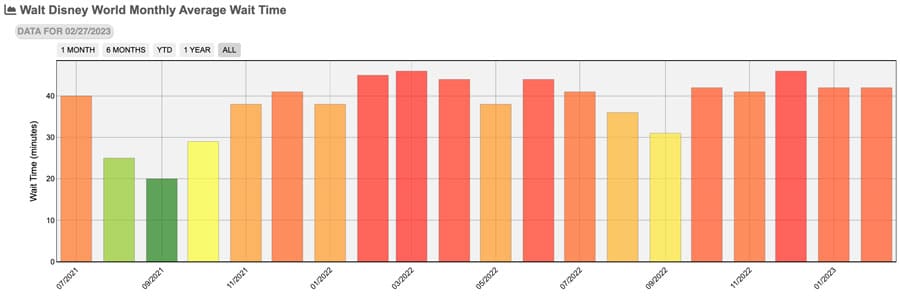
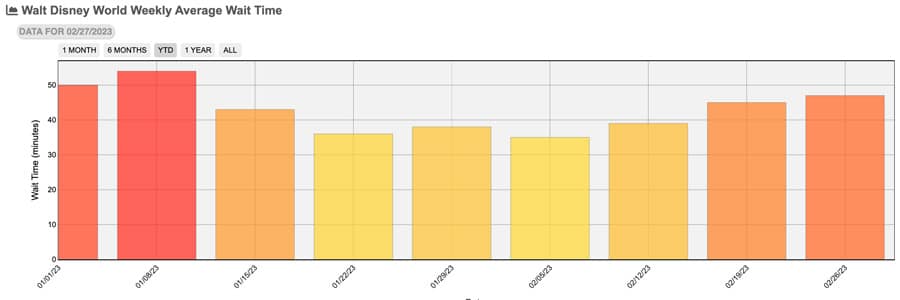
Let’s start with the monthly average. Up front, we need to acknowledge that August through October 2021 are still really skewing this. If you don’t recall, those are when mask rules were reinstated and Delta spiked, causing massive cancellations. At this point, those have zero bearing on current crowds, and those months ‘falling off’ the chart will help reset crowd levels based on actual current trends.
In any case, January/February 2022 to January/February 2023 is an apples to apples comparison. This January was much worse than last year, whereas this February has been slightly better than last year. The average wait time this month has been 42 minutes, versus 45 minutes last February. Let’s drill down a bit further to see when weeks and days are skewing the data…
For January, it’s unsurprisingly the beginning of the year. We ‘warned’ of this before it happened, but haven’t really touched on the aftermath of winter break post-New Year’s Eve. In any case, you can plainly see that week is the worst of the year thus far, with higher average wait times than both the week of New Year’s Eve and this past week. That alone makes the titular headline in our last post wrong.
In fact, last week was “only” a 9/10 on the crowd calendar based on these wait times, which puts it (roughly) on par with Thanksgiving rather than Christmas, New Year’s Eve, or the post-NYE week (which is actually both the worst week of winter and of the last 500 days). We already know there were several 10/10 days during the last couple of weeks, so let’s drill down further to see why the weekly average was only 9/10…
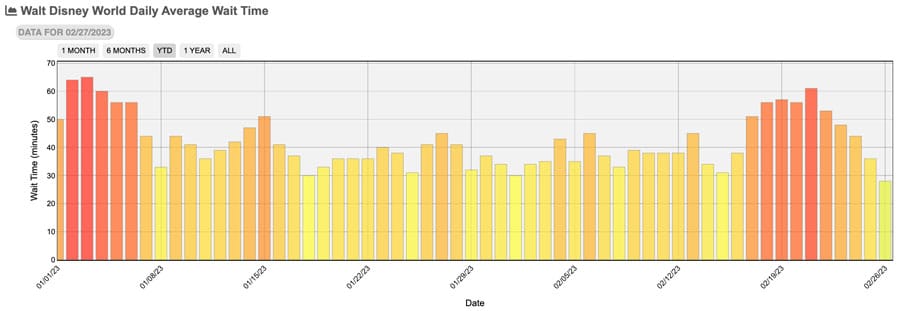
Above is a look at daily crowd levels based upon posted wait times thus far in 2023. As previously mentioned, the highest bar on the right is the Tuesday after Presidents’ Day. That’s a 10/10, and so are the Saturday through Monday before it, and the Wednesday after it.
What’s really skewing the data is the days following that. In particular, yesterday was only a 1/10! This is actually not totally unprecedented, but the degree to the dropoff is a bit staggering. Normally, the day of major runDisney events sees lower wait times–it’s an observable trend that happens with each event (take a look at January 8, the lowest bar among reds and oranges) and has for years. However, I’ve never seen it drop all the way to 1/10 during an otherwise crowded week. That’s a new one to me!
It’s a similar scenario prior to the start of the holiday weekend, when crowd levels were in the 2/10 to 5/10 range. That part is no surprise; we didn’t expect (or predict) that days before 2/17 would be busy. So that week having its average dragged down was to be expected. But I never expected that to occur with the tail-end of the week of Presidents’ Day and Mardi Gras, especially heading into a runDisney event weekend that should’ve helped offset those heading home from holiday break on Thursday through Saturday.
I don’t think the individual parks really add much to help understand what happened, but here those are anyway:
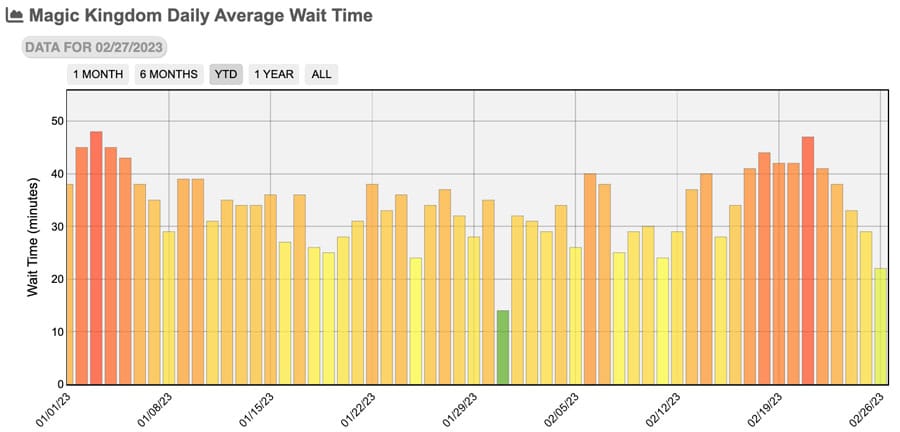
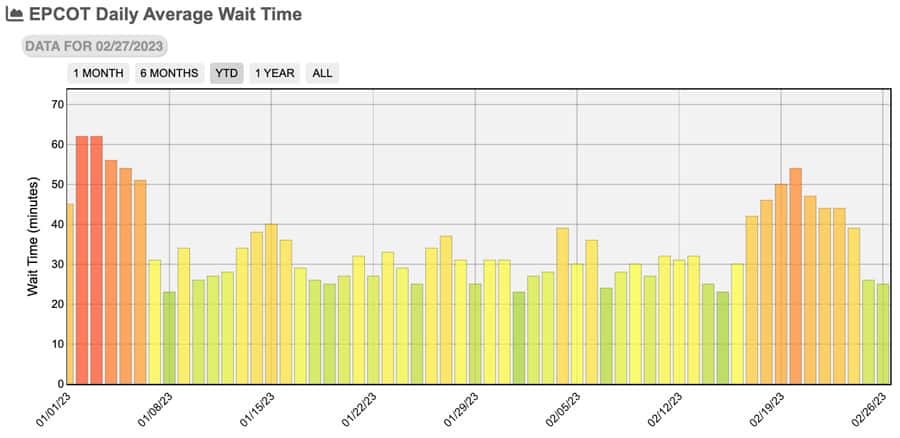
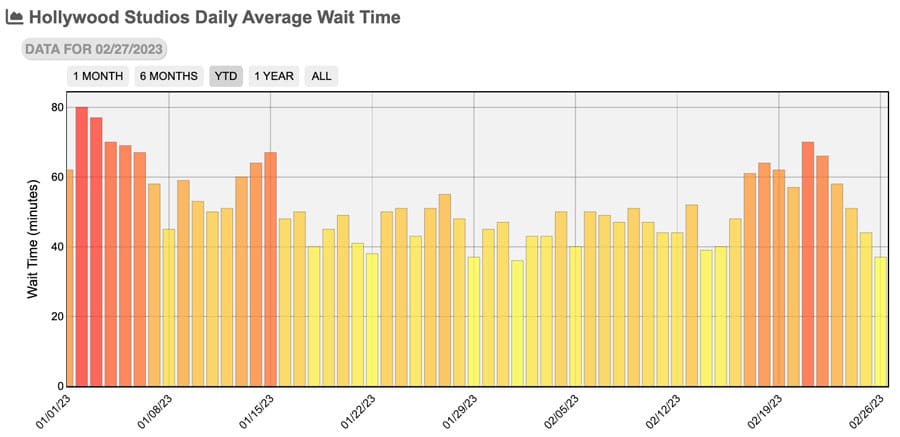
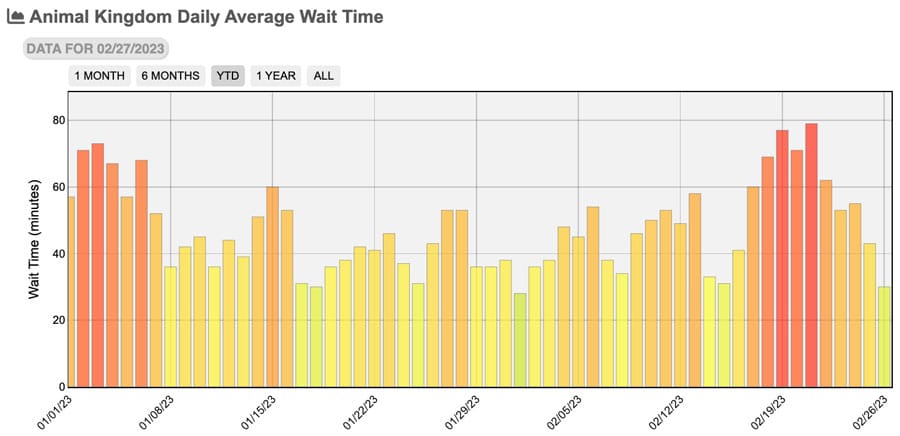
The crowd dynamics are pretty consistent across the board. Wait times spiked leading into and out of Presidents’ Day, but fizzled out toward the end of that week, falling from moderately high on Thursday and Friday to flat-out light levels on Sunday.
Despite that, we could claim this as a victory, as crowds did hit 10/10 for several consecutive days during what was expected to be the heart of the holiday break. I’d hazard a guess that most people visiting last week felt the parks were quite crowded.
Personally, I’m more focused on what we got wrong. For one thing, the prediction was “worst week” and not “series of 10/10 days.” My expectation was that the entire week would at least be on par with last year, especially given the timing of Mardi Gras. The fact that it wasn’t is surprising. (Honestly, I expected most days last week to be high 10/10 days, not normal ones almost on the cusp of 9/10.)
I’m also wondering why there was such a sharp drop-off leading into (and out of) Princess Half Marathon Weekend. This does not align with what happened last year, and is a bit perplexing as a result. Did more runDisney participants come down for the race but not visit the parks? Did people cut their holiday breaks short and head home early?
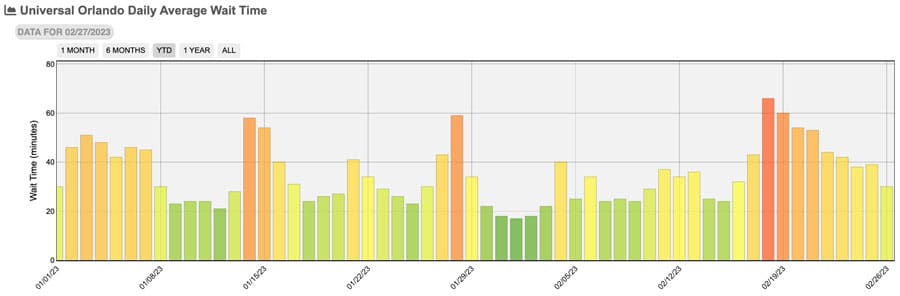
For those inclined to think that Universal Orlando pulled people away from Walt Disney World…don’t. Crowd levels were 9/10 or 10/10 there Saturday through Tuesday, but similarly dropped off after that. In general, Universal has had a relatively quiet winter.
As we discussed in our last crowd report, Universal’s parks are once again closely following seasonal attendance trends and tourism data for Central Florida. For a couple of years, conventional wisdom was that Universal gained market share on Walt Disney World among Floridians as they’ve catered to locals more aggressively and actually sell Annual Passes. Based on everything we saw, that was true between Summer 2020 and 2021. It appears to have stopped being the case at the beginning of last year, though.
With that said, it’s tough to fully explain the lower wait times (relatively speaking) late last week and over the weekend at Walt Disney World. In particular, wait times falling as the Princess Half crowd arrived is pretty perplexing. Perhaps it is a matter of runDisney diehards no longer having Annual Passholders and not wanting to pay for multi-day tickets. Airfare and hotel costs might’ve pushed non-runners on holiday break to leave earlier.
It’s also possible that weather is the primary explanation, with little change in ‘behavior’ on the part of runDisney participants. Much of the United States experienced extreme weather late last week and into the weekend, with snowstorms across the country from Maine to Southern California. Many areas that didn’t experience snow instead were treated to rain and hail. This resulted in thousands of flight cancellations every day starting Thursday–and double or triple the number of delays. That probably played a significant role, too.
Setting all of that aside, one thing that I do think is really fascinating is the difference between the first week of January (the actual worst week of winter) and last week. Since 2019, the first week has been getting busier and busier due to Osceola and Orange County schools being out of session (and a growing number of locals), plus the lifting of Annual Pass blockouts, plus Walt Disney World Marathon Weekend in the last 4 years or so. It was really bad in early 2020 (especially at DHS, where many locals were experiencing Star Wars: Rise of the Resistance for the first time), but 2023 is the busiest that week has ever been–by far.
It’s impossible to “untangle” the various variables impacting crowds in early January, but the explosion of the local population is the one thing that has changed during that time. Additionally, the 2023 Florida Resident Ticket Deal for Walt Disney World was NOT offered then (but was offered this past week). This suggests to me that a lot of locals are still Annual Passholders, getting in when sales reopened and not letting their passes lapse since.
I would guess that this is an “underappreciated” demographic, especially on sites like this one where we hear complaints from aggrieved Annual Passholders who aren’t renewing and also from those new locals who are unable to purchase new passes. Meanwhile, there are probably plenty of local APs who are doing their thing, visiting the parks, without voicing their opinions online.
Given the Walt Disney World wait time data and how it doesn’t always track with Universal or MCO’s traveler volume, it’s probably safe to say that Walt Disney World has a very healthy number of Annual Passholders in Florida. (That would also partially explain why AP sales haven’t resumed, despite restarting in California.)
Ultimately, it was still a (mostly) very busy week at Walt Disney World. Anyone who hasn’t visited the parks during winter in the last 4 years–or didn’t realize Mardi Gras is a big holiday break for some school districts–was probably blown away by the high wait times. Several consecutive 10/10 days is not exactly uncrowded, after all.
Nevertheless, Walt Disney World wait times were not as high as we anticipated, nor were crowds elevated for the entire duration of dates were predicted. For the most part, this was not bad forecasting–we had historical precedent and wait time data to go by, making those predictions almost obvious. (The one exception was Sunday–based on recent runDisney events, we should’ve had that as a moderate day. Even that would’ve been wrong since it was only 1/10!)
If anything, this should reinforce the reality that there are no “sure things” in Walt Disney World crowd predictions. Weather (both locally and across the country), flight cancellations, average airfare and hotel costs, and other variables all can throw a monkey wrench into things.
It would be wise for everyone to keep that in mind when reading and relying upon our Spring Break 2023 Crowd Calendar for Walt Disney World. We’re fairly confident in those predictions, but nothing is ever 100% certain. And as always, savvy strategy is going to beat picking the “right” dates 9 times out of 10.
On a positive forward-looking note, the crowds that Walt Disney World saw over the weekend should be a sneak peek of what’s in store for the next two weeks. Very few major school districts have breaks in late February or early March, there are no major events on the calendar, and it’s not really a popular time for getaways to Florida. All things considered, it should be a really good time to visit Walt Disney World. That won’t last long, as spring break kicks off in full force starting March 10, 2023.
Planning a Walt Disney World trip? Learn about hotels on our Walt Disney World Hotels Reviews page. For where to eat, read our Walt Disney World Restaurant Reviews. To save money on tickets or determine which type to buy, read our Tips for Saving Money on Walt Disney World Tickets post. Our What to Pack for Disney Trips post takes a unique look at clever items to take. For what to do and when to do it, our Walt Disney World Ride Guides will help. For comprehensive advice, the best place to start is our Walt Disney World Trip Planning Guide for everything you need to know!
YOUR THOUGHTS
Did you visit Walt Disney World during Mardi Gras and Presidents’ Day 2023? What did you think of the crowds? Any parks, times of day, or days of the week noticeably worse than the others? Did you find the past few days to be noticeably less busy than the first half of the week or previous weekend? If you’ve visited in past weeks before/after Mardi Gras, did you notice a big difference in crowd levels? Do you agree or disagree with anything in our crowd report? Any questions we can help you answer? Hearing your feedback–even when you disagree with us–is both interesting to us and helpful to other readers, so please share your thoughts below in the comments!


Thanks for the report, Tom. We were there for RunDisney weekend (it was so much fun!) and I have a few theories about the crowds. One, with the price increases for RunDisney events, I think attendees are dividing into a couple of camps: those who offset the price increases by not purchasing as many days of park tickets and those who still have the budget to buy park tickets but don’t need to use the tickets for ride access (where folks feel the pinch of the higher crowds). We went on only two rides and saw maybe a half-dozen shows over three days. Our park time — particularly after the 10k and half-marathon — was used primarily for celebratory meals, medal photos, and chatting with other participants/cast members.
My second theory is that the elevation for the half-marathon for this February Princess weekend contributed to crowd dynamics. The elevation is about double what it is for the November Wine & Dine course which means more people rested in preparation beforehand and in recovery after.
Third, because Disney is keeping that virtual queue for the RunDisney Expo shopping (boo!), it’s challenging to plan ADRs and park days around it. We’ve given up our Thursday park tickets because of this since we have no idea when we’ll be allowed to shop the Expo until Thursday morning at 7am.
I was in MK Tuesday after 5pm, and it was definitely 10/10. Back in the parks Friday thru Monday, and I can attest to the 1/10 on Sunday. We were able to get both Galaxy’s Edge and Toy Story Land done by 10am, with only SDD being a LL. I was shocked by how light the crowds were and commented that we were in for a small crowd Monday. I was surprised to wake up to have Genie+ still at $20, and the parks were much more crowded than Sunday, IMO rivaling Saturday as well.
Any insight as to why Monday was so busy on a “non-holiday” week? Even today seems to be busy looking at wait times on the app
I was there for Princess Weekend and was absolutely expecting the worst (especially since when checking wait times earlier in the week I saw RotR hit 305 minutes). We only did 2 park days – MK on Friday and Epcot on Saturday and we were pleasantly surprised. Epcot was downright empty on Saturday! I haven’t seen that much open space in World Showcase since early 2021.
We’re from Manchester England and we were there last week because it was our half term.
We were last there in October 2022 between the 12th – 17th with my husbands parents.
All Disney Hotels were full but I don’t remember any of the parks reaching capacity that week.
We stayed at the Four Seasons and had a brilliant week.
We booked last April to go in February 16-26 2023 with my parents. When we booked we didn’t know about President’s Day or Mardi Gras. I found out about those in October when we returned from our last trip and instantly panicked about the crowds. My parents were last in Disney World 6 weeks after 911. As you can imagine things were different then. I remember being in Sea World and everyone standing up to applaud those from overseas who didn’t cancel and had made the trip over.
I met my husband in 2009 and we must have been 7/8 times to Disney between then and now. We have gradually seen Orlando get busier and busier and have gotten used to it. My parents remember a different era and I was worried they were going to find the crowds to much.
I considered cancelling but my parents had already booked an onward trip to California from Orlando so we were committed.
Well, we got home Yesterday and we had a brilliant week and I was pleasantly surprised.
I expected far worse. The parks were more than manageable. I expected shoulder to shoulder and they weren’t like that at all.
I actually think Epcot was quieter than when we were there in October. I think the Food & Drink Festival in October was busier.
I’ve never been in a sold out park before but we did Hollywood Studios Sunday 19th Feb and it was fine. It wouldn’t put me off going into a full capacity park again. We didn’t do Smuglers Run or Rise Of.
We had already decided early on when we found out how busy it was going to be to buy Genie+ each day.
I’m going to be controversial here but I like Genie+ and prefer it to the old fast pass system.
Whilst the old system was fair and free, having to book rides 60/90 days in advance was a bit of a pain, not very flexible on the day and must have been daunting for newbies who have no idea of the parks or the rides they want to go on 2/3 months in advance.
I also prefer Genie + to Universals fast pass. I like that Genie+ gives you an hour return window which structures your day. Once you check in rides are generally a walk on or very low queue. When we last did Universal every ride had long fast pass lines, you had no idea how long it was going to take.
We have a 7 year old and a 2 year old. Whilst Genie + is expensive, especially on the days it was $30, for us we think it works, we just can’t spend hours in long lines. Especially for rides our 7 year old can go on but our 2 year old can’t. We bought it early each morning and got 3/4 rides out of it each day. We would have got more if we were prepared to stay later in the parks.
I expected the wait times for the rides to be much higher than they were, I didn’t think they were much higher than the wait times for the week we were there in October which I don’t think had any parks which sold out. Magic Kingdom and Hollywood Studios were full for several days last week. Mickey and Minnie’s railway was 110 mins at one point but I don’t remember it being much lower in October either.
Same for rides such as Flight of Passage, Rise of, they are always long wait times whenever you go. Hence we have never done them.
One thing I did notice from Saturday 18th to about the 22nd we’re a lot of large groups/families seemed to be using Disney Guides. I’ve never really noticed them before but spotted a lot in the parks this time around.
We stayed offsite last week on Champions Gate and had a great time. The only down side was the traffic, the I4 was mental all week.
We also skipped a day in the parks on President’s Day itself and did the extra magic hours at magic kingdom and had a brilliant time! We did everything it would normally take us 2 days with Genie + to do in one night and it was really special.
To get through the week we just made the most of our body clocks being 5 hours ahead, got in the parks early, used Genie + wisely and we’re prepared to miss out on some of the headline rides. We only queued for 2 rides all week, Test Track and Everest which were 50 mins each.
We did notice a slight drop off in crowds from Wednesday onwards. We did Magic Kingdom on Sat 25th which seemed quieter and I expected to see more Run Disney participants. Noticed a few but not a lot.
We did Blizzard Beach twice, Tuesday 21st and Friday 25th and they were great. Walked on to all slides both days.
The weather was a real bonus last week. I was not expecting in to be so hot which was a nice surprise.
All in all I am so glad we went. It was a great experience and atmosphere. Everyone was very pleasant everywhere we went. Everyone just seemed to get on with it. All the cast members were brilliant and didn’t seem to let the crowds bother them.
Already planning our next trip in 2024.
Thanks for all the tips and tricks.
Since NYD was a Sunday, it was the most crowded Winter Weekend at WDW this year. Very important to know for travelers going Thurs-Tues rather than Sun-Fri.
(I guess I was expecting less crowds than we got Friday and Saturday because of the two holidays the following week, like a strong version of the JERSEY WEEK phenomenon.)
I wonder if the crowds were the same, but because of lack of proper maintenance, more and more rides were down for extended periods over the holidays- skewing the wait numbers?
Out of state passholder/RunDisney participant. I noticed how much more pleasant this year’s Princess Weekend felt on property than last year’s. I think myself and many other runners eschewed the parks. I know a lot of people just weren’t going to pay the steep ever-increasing ticket prices and undertake all the work to visit the parks every day after waking up at 2 am and needing to go to bed at 7 or 8 pm (if doing multiple events), and passholders like myself figure we can do the parks another time. Last year I brought my family to Princess, but with the cost of tickets this year, my RunDisney trips are now solo or girls trips. As a family, we will come for a long weekend in the fall and do MNSSHP when I don’t have early wakes/bedtimes. Looking back on this weekend, I went to all four parks and spent maybe 8 hours total in the parks over four days. I road the railroad and nothing else. I ate, I shopped, I took in the vibe, took photos, and left. I also spent a day working remotely instead of being in the parks. I popped into MK for some castle medal photos today and Main Street wasn’t crowded at all, so I bet this week is lovely. As for the comment about people not wearing their medals, well, the shirts are so cheaply made they’ve been snagging on the medals (or for no discernible reason), and the medals are so cheaply made that the paint has been peeling off (also for no discernible reason). I think people have been cautious about wearing them. I carried mine around in a small pouch and just took them out for photos. Alas.
I appreciate that you followed up on your predictions with a recap of the actual results! Gives me even more confidence in your analysis knowing you fact check your own work! I can’t speak to last week, but my family spent today at EPCOT. It was a wonderful day! Crowds seemed very manageable all day. First couple hours of the day were very light, and moderately picked up by mid-morning. Also, if you can ignore the construction walls, the park looks gorgeous! The flower displays are fantastic.
Somebody needs to speak TO DISNEYfor the fans. Disney keeps taking things away and raising prices. I thought Iger was going to make changes but don’t see it yet. Give us back the AP… I am not returning unless I have it. Lower the price as well. “VACATIONERS” are now going to UNIVERSAL for better deals, food, and shows. VACATIONERS are the ones that spend money in the park. Local people don’t spend that type of money. If we see we cannot aford lodging and passes don’t expect us to show up to spend money in the Park. Last Sept/Oct 2022 we went back for many thing including the dinning tour. Stayed at the Wilderness cabins 10 nights. Ate at (in order) Whipering Canyon Cafe, Diamond Horseshoe, La Hacienda, RainForest (Breakfast), Hoop Dee Doo, The Plaza, Tony’s Town Square, Space 220, and the Boathouse. MOSTALL OF THESE WERE SUBSTANDARD FROM GOING TO THEM DURING THE 50TH ANNIVERSARY LESS THAN A YEAR PRIOR. From WORST to BEST. 1) The worst was the Plaza, over an hour wait with a resevation made 60 day in advance, for was cold small potions and poor service. 2) Diamond Horseshoe same as last year as it is a buffet type. Service good but meat was fatty and none of it taste “Like it Did” 3) Tony’s Town Square, a favorite but not like it was. AND WHEN DO YOU GO TO AN ITALIAN RESTAURANT AND HAVE TO PAY “EXTRA” FOR BREAD. 4) Did not know where to put this in the list but BIGGEST disappointment was Space 220. As hard as it is to get into here I expect the BEST. Last year I got in and upgraded to the Lobster. THIS WAS THE BEST, so I ordered it again. Smaller that before it was over-cooked and burnt alon with my wifes steak. The rest was good but a HUGE disapointment as I waited a year to return. 5) DITO on the HOOP DEE DOO. Outstanding Oct 2021 but aweful 2022. Show was still good. 6) Breakfast at Rainforest again was great the previous year but would not make my cut for this year. 7) New on my list was La Hacienda, this was better than expected and I would try them again. 8) Also new on my list was Whispering Canyon Cafe, this food was good and service was great. I had not been here for years but then it was breakfast… Still stands “DO NOT ASK FOR KETCHUP! 8) The BOATHOUSE my best meal. They always have been outstanding and service still remains TOPS!
OK so Disney if you are hearing me you need to stop raising prices when you TAKE AWAY items. Make it more expensive for the locals that can come in for peanuts, creat long lines, that make someone paying top dollare to be there. THE MAKE YOU G.D. FOOD BETTER — LIKE IS WAS. DINNER TOURS ARE OUT FOR ME RIGHT NOW! The FOOD, POOR TRANSPORTATION, HIGH PRICES, PREVENTED ME FROM RENEWING MY AP. WITHOUT THAT IT WOULD HAVE BEEN AWEFUL.
Thanks for the random offtopic rant, every article needs at least one.
You mentioned local school districts being off the first week of January as a contributing factor to the early January crowds. I think in addition to that, the timing of New Years and the fact that many school district’s winter breaks extended through the first week of January encouraged many families to take trips over that week. Likely going it wouldn’t be “too bad” after NYE passed. I would expect it to happen in 2023 as well with NYE on a Sunday.
We were in the parks Wed-Sat last week. I was there to participate in my first ever 5K and Disney race which was SO fun! I did not anticipate how early I’d be waking up for Yoga and the race, so we definitely headed back to our hotel earlier than we normally would. The waits and crowds weren’t too bad EXCEPT for Friday at Hollywood Studios… we bought Genie that day and it was the first time I’ve ever felt that we wasted our money on it. We usually buy it for every trip at least once and have always felt it was worth the cost. This day however, the Mickey & Minnie railroad ride went down so we couldn’t use it for that ride. They did eventually give us a “free pass” for another ride, but the options they listed were for lame rides that had lower wait times anyway. Also, probably because of that ride going down, when we went to our return LL for Slinky, the line was all the way down to the entrance of Toy Story Land. So we didn’t use genie for that either since the cast member said it would be well over an hour…. For the LIGHTNING lane. I cannot imagine what standby must have been at that point…
So the only thing we actually used our paid Genie service for was the meet and greet for Olaf earlier that day lol Oh well!
We were in parks Thursday through Sunday and were pleasantly surprised by the (relatively) low wait times. A couple thoughts on what might have driven this:
1) There’s an imperfect correlation between wait times and actual crowd levels. This isn’t a criticism of your crowd calendar posts, Tom — you’re doing the best you can with the available data. But it definitely seemed to me that the number of people admitted into the parks did not translate to ride crowding as much as I would have expected. This was most obvious on Sunday, after the half marathon. We were at Epcot, and it was plenty crowded. But a lot of the crowd was made up of RunDisney participants who were celebrating their accomplishments by drinking around the world, not by trying to get on Soarin’. The same thing seemed to be happening, to a lesser degree, on Saturday while we were in Magic Kingdom. I saw a lot of people in RunDisney gear who (1) didn’t have kids with them, and/or (2) were spending their time shopping or strolling around, not standing in line for rides. A lot of those people also seemed to head out of the park early, which isn’t terribly surprising given that they’d either done, or were preparing for, a long run that happens super early in the morning.
2) Related to the first point, determining crowd levels based on standby wait times doesn’t fully account for the effect that Genie Plus and Individual Lightning Lanes are having on crowd control these days. Like Jamie O, we didn’t have any trouble booking things with ILLs/Genie Plus. In fact, we ended each day with more Genie Plus selections available than we wanted to use. The flip side was that wait times for Lightning Lanes seemed higher than normal this time around. I even heard cast members at Seven Dwarves talking about how the ILLs must have been “oversold” given how long the line was stretching. Those ILL/Genie Plus wait times don’t get factored into the standby wait time, though; in fact, ILLs/Genie Plus should ideally make standby wait times lower because they allow Disney to manage crowd flow within the park. So if more people are using paid fast pass options, which seems likely now that people are more familiar with those options, it’s going to artificially deflate the apparent crowd levels when judged based on standby wait times.
3) It was unseasonably hot this week. We usually stay in the parks all day, but this trip we left each day in the early afternoon for some pool/relaxation time. Judging by the crowds at our hotel pool I’m guessing many people did the same. The heat might also have dissuaded some locals from randomly heading to the parks, though that’s just speculation on my part.
Thanks for all you do, Tom. We couldn’t have planned our trip without your widsom.
You’re 100% right about the difference between congestion levels and wait times, and the imperfect connection between the two. Nowhere is this more true than at EPCOT–the disconnect is really bad there, especially during times when locals or regulars are drawn to the parks (runDisney events qualify).
Great point about the hotter weather and pool relaxation time, too. That definitely could have an impact this time of year, when comparing to last February.
Not quite sure I follow the logic on LLs being oversold and the impact that has on standby waits. When Lightning Lanes back up, the guest ratio at the merge point should change, thereby pushing the standby wait time higher to “fix” the problem. If that’s not happening, though, you could be right–because it’d mean that the standby line is moving faster and thus that wait is lower than it’d be otherwise as a result.
Re: the point about ILLs and Genie Plus, my sense was that cast members were being more aggressive in holding the fast pass line and letting the standby line move at a good pace. The last time I was in the parks, during last spring break, my Lightning Lanes were essentially walk ons for most rides. Maybe 5 minutes for the most popular rides. This time it felt like we were being held long before merging with the standby guests. In other words, it seemed like Disney had moved from having a really long standby line paired with a really short ILL/GP line to a system with somewhat more balance that makes GP/ILL guests wait a little bit longer in order to keep the standby experience bearable. Again, this is all anecdotal, but it seemed to be a consistent theme of my visit.
Despite all of your warnings, we went to WDW last week (it was then or never!) and I really appreciated your crowd forecasts. We use DAS for my son, so wait times were not a huge problem for us, but it was incredibly helpful to know that there would be TONS of people there. Managing expectations is key, so thanks for all of your hard work. And important side note…the Louisianians we met were incredibly friendly and kind. One man told me that during “Mardi Gras Week” everyone either goes skiing or to Disney World. I thought the ones who chose Florida added a really nice vibe to the parks.
As someone who should know better than to trade in anecdotes, just about everyone I’ve ever encountered from Louisiana has been friendly and polite. I’d also agree that, as a whole, the crowd during Mardi Gras week has a “good vibe.” Far better than the normal summer vacation crowd.
I think part of that is because the weather is better this time of the year, but I think part of it is a camaraderie among the guests from Louisiana.
I’m not sure if it was because we went into last week knowing it would be busy versus our last trip which was the first week of December in 2021 where we thought it would be moderate crowds and the parks were slammed, but we had a wonderful trip last week! The weather was perfect, we utilized Early Entry, G+ with Standby Skipper, and we have a toddler so our focus for 75% of the trip wasn’t big blockbusters or late nights, but it was perfection. Minus the covid 2 of the 3 of us came home with! Could’ve done without that…
Thanks for sharing your experience–sorry to hear about returning from the trip with covid!
“It would be wise for everyone to keep that in mind when reading and relying upon our Spring Break 2023 Crowd Calendar for Walt Disney World.”
No need for any disclaimers. Your attention to details and comprehensive work provide the best possible predictions available anywhere.
Thanks!
Curious since you mentioned cancelling your trip for last week…any regrets? Or, was this still too crowded for you?
Have been monitoring your posts for this week for a while – we arrived last Saturday night (2/18) and stayed through this past Sunday (2/26). We were there for a mix of Arts Festival, fun, and the 10K. The first few days were insane as noted, but I did expect to see more “runDisney types” earlier than we did. It didn’t really feel like we started seeing them consistently until late Thursday or Friday and even on Saturday in Magic Kingdom, we hardly saw anyone walking around with medals (compared to what we have seen in the past). It did “feel” like maybe the race crowd came in mostly for the race itself and stayed away from the parks. FWIW – we saw more “multi race” people than single race it felt like, so I’d wager people having to get up multiple days in a row at 2:00 a.m. stay away from the parks or are there less? Love all your stuff Tom, thanks for all you add.
Thanks for sharing your observations and insights–that’s fascinating.
I cannot answer your question, but now I’m really curious as to what the parks will look like during Springtime Surprise Weekend. We’re currently calling that the last hurrah of spring break, but now I’m really tempted to adjust crowd levels for that Friday through Sunday downward by a bit.
Was there Thursday through Sunday and I was shocked by how little competition there was in genie for LL and ILL. We got every single ride we wanted at MK and HS with zero trouble. At MK we went in the morning and basically just went around the park in a circle dinging into every ride and nabbing the adjacent one immediately after. It probably wasn’t even necessary that day but it definitely did save us time as we were done and out by 2pm. was able to evening stack everything at HS that way too. I can’t even recall the last time we’ve been able to move that efficiently.
Local AP and DVC here. Our experience, the posted wait times are greatly skewed under or over. I can appreciate it is a difficult “science” to perfect but sometimes it’s so wildly off it almost seems intentional.
My company is exhibiting at a conference this weekend at Disney Dolphin. We tried to book hotel rooms for the conference room block in mid-January but it was waitlist only. I tried to book directly, outside the room block and the Swan was $1,600 a night. The JW down the road was $700 a night so I tentatively booked that. Friday morning, 2/24 I called the Swan to see if anything was now available. The very rude and condescending Swan rep laughed and said I waited too long to ask for a room “at the last minute” (we’d been on the wait list for 7 weeks) and he couldn’t help me. About 2 hours later I looked online again and surprise surprise, the Dolphin had rooms available for $464 a night and the JW had come down in price to $465 a night. I cancelled my previous $700 JW and rebooked at the Dolphin. An hour later the entire wait listed group received a mass email saying new availability for the Dolphin just became available so call them to book our rooms.
Clearly Disney was expecting something big this week and was holding rooms back, which didn’t materialize and now they’re begging us to book with them.
1) You’re totally right about posted wait times being wrong–and typically inflated. However, they are usually “consistently wrong” and inflated by around the same percentage at each attraction. There are a handful of notable exceptions to this, but it’s generally true. Consequently, this doesn’t really impact crowd levels since they’re relative. If everything is inflated, it nets out.
2) That’s very interesting about the Dolphin. That’s a huge hotel for conferences/conventions. Based on what you’re describing, it sounds like a major event cancelled. I suspect we’ll see more and more of that this year as corporations look to cut costs. Too early to say how it’ll impact crowd calendars (as conventions were *just* starting to recover), but it’s something worth watching. Thanks for the heads up on that!