
Disney World’s Crowd Lull Ends as Jersey Week Arrives
It’s time for a look at attendance for the last couple of weeks at Walt Disney World, plus a preview of Jersey Week and early November 2021. In this crowd report, we’ll analyze wait time data following the rollout of Genie+ and Lightning Lanes, and offer thoughts on what’s likely to happen next with numbers at Walt Disney World this holiday season.
This picks up where October Crowds Spike at Walt Disney World left off. That covered low-but-growing numbers through the first half of the month, with the kick-off of the World’s Most Magical Celebration not being nearly as busy (in terms of wait times) as anticipated. Numbers picked up for the Columbus Day/Indigenous Peoples’ Day long weekend and fall breaks, but the month up until that point still wasn’t nearly as bad as originally anticipated.
None of this was super surprising. For the last few months, we’ve been discussing the impact of Florida’s delta surge and Walt Disney World’s reinstated indoor mask rule on cancellations through the end of the year. It would seem that plus hotel unavailability, lack of international travel, etc. has taken the edge off attendance–and will probably continue to do so for the Christmas season. This is precisely why we downgraded forecasts with the latest update to our 2021-2022 Walt Disney World Crowd Calendars.
At that point, the biggest unknown was how Genie+ and Lightning Lanes would impact crowds. Every iteration of FastPass ever has caused an increase in standby wait times, so the same was expected with Genie. It was just a question of by how much, whether it would occur immediately, and to what degree paid FastPass would impact crowd levels.
Now that Genie+ and Lightning Lanes have been available for a couple of weeks, we can dig into wait times and see to what degree there has been an immediate impact…
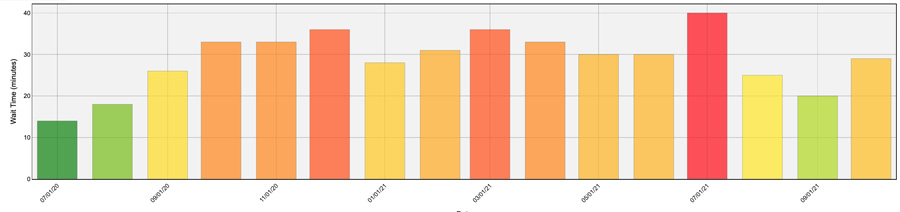
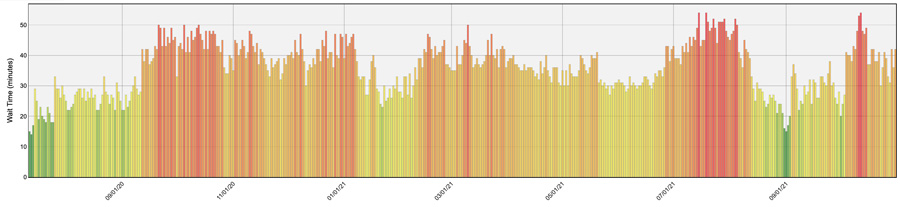
Let’s start with a high level look at monthly wait time averages across the entirety of Walt Disney World. (All graphs and wait time stats courtesy of Thrill-Data.com.)
As of mid-month, the average wait time for October 2021 was 30 minutes. That has since dropped to 29 minutes.
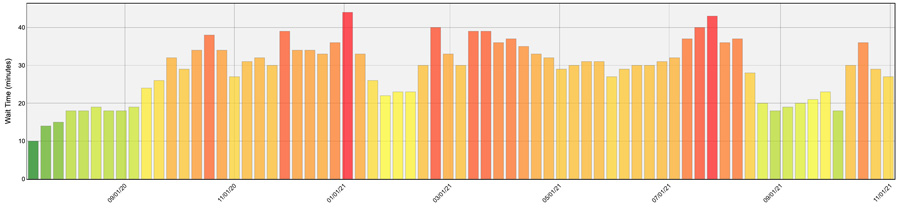
The drop-off in the second half of the month is more pronounced when looking at weekly wait times.
The last two weeks show a slowdown as fewer school districts have fall breaks. Still, not nearly as low as the green bar representing the last week of September/first week of October.
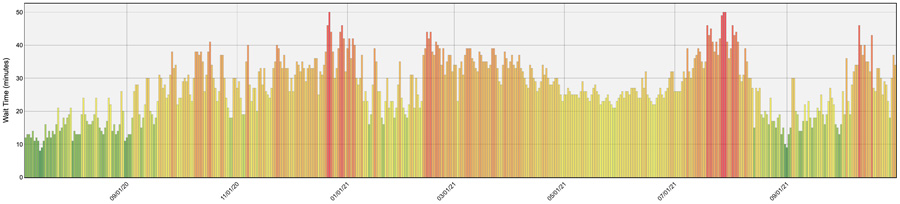
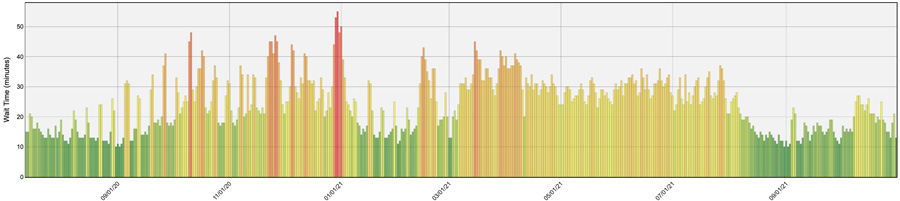
We can see exactly this play out at Magic Kingdom. Crowd levels started low, spiked to 8/10 levels mid-month, before declining again up until this weekend. (Ignore the green bar a few days ago–that’s an anomaly due to severe weather. It was the one day in the last couple of weeks we didn’t do the parks.)
Magic Kingdom crowds have been decidedly average the last couple of weeks, with most dates in the 4/10 to 6/10 range. That is far better than normal for late October, which had become busy in recent years.
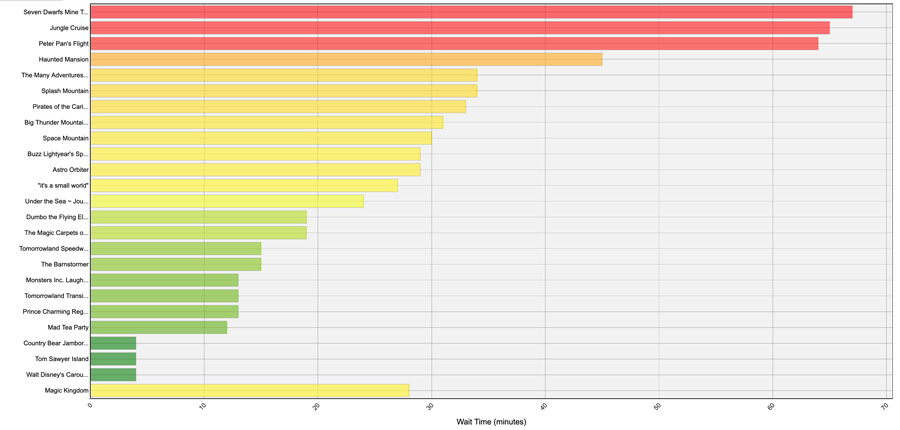
Above is a look at Magic Kingdom wait times by attraction for the last week.
The highest average wait time was Seven Dwarfs Mine Train at 67 minutes, followed by Jungle Cruise at 65 minutes, and Peter Pan’s Flight at 64 minutes. Those are all down from mid-month, and nothing else had a wait time average above an hour. (Splash Mountain, in particular, fell significantly due to cooler temperatures.)
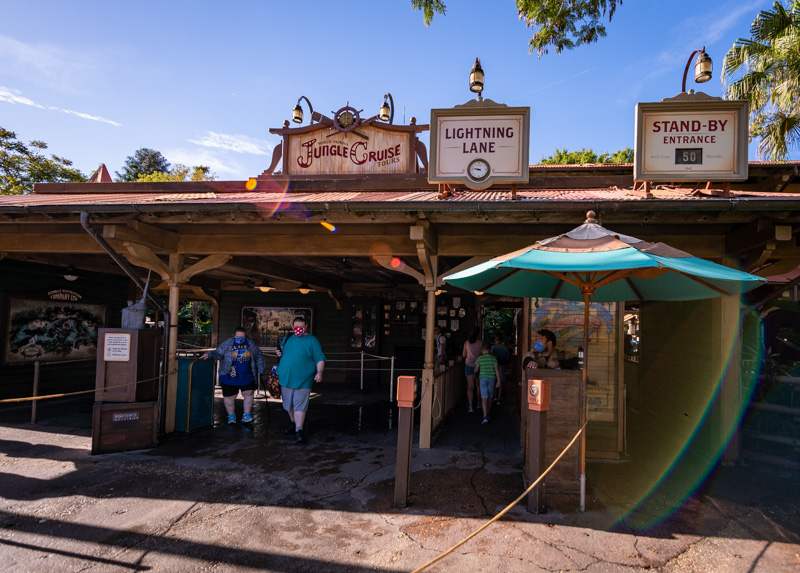
Jungle Cruise has been one of the top 5 wait times in Magic Kingdom for months, and we expect that to remain true throughout the next year. That’s why it’s #1 in our Magic Kingdom Genie+ Priorities & Lightning Lane Ride Ranks.
This continues to catch longtime Walt Disney World fans by surprise, as Jungle Cruise never used to draw this long of lines. Plan accordingly!
Continuing to Epcot, where crowd (or at least wait time) levels have fallen back to lower levels. This park continues to be the outlier–just as it has been since summer–with average waits that put it in the 1/10 to 3/10 ballpark for the last week.
Attractions with the longest wait times were Test Track and Frozen Ever After, at 37 and 53 minutes, respectively. Soarin’ Around the World averaged a 19 minute wait time. Nothing else has been above 15 minutes, which is what brought the overall average down so much. Note that this does not include Remy’s Ratatouille Adventure due to its virtual queue.
Animal Kingdom has also fallen back to lower crowd levels, but has been more up and down in the back half of October.
In the last week, the two Pandora attractions are the only rides with significant waits: Avatar Flight of Passage averaging 56 minutes and Na’vi River Journey averaging 52 minutes. Kilimanjaro Safaris and Expedition Everest averaged 25 minutes and 15 minutes, respectively. All those are significantly shorter later in the day–some are even walk-ons.
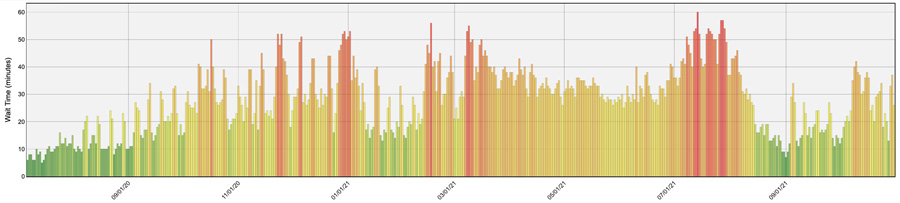
Finally, there’s Disney’s Hollywood Studios.
This continues to be the busiest park at Walt Disney World, with average daily crowd levels hitting 8/10 some dates in the last week–even when other parks have been at or below 5/10.
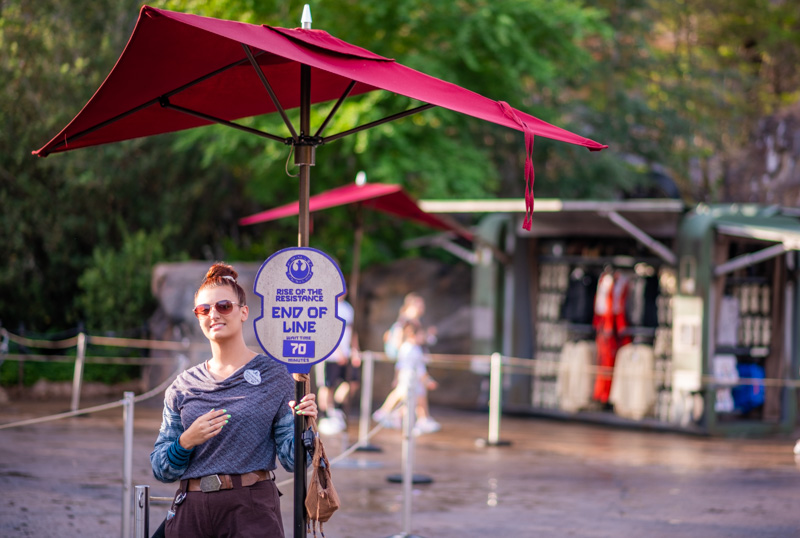
Not that we needed confirmation of this, but in spending significant time at Walt Disney World in the last two weeks while testing Genie+ and standby strategy, it has become very obvious to us that Disney’s Hollywood Studios is still having the most struggles with crowds.
To be sure, wait time averages are skewed by Star Wars: Rise of the Resistance and Slinky Dog Dash. Those are now the two longest lines in all of Walt Disney World. It’s not just those attractions, though. The top heavy ride lineup and continued lack of stage shows and other entertainment just makes everything so much worse.
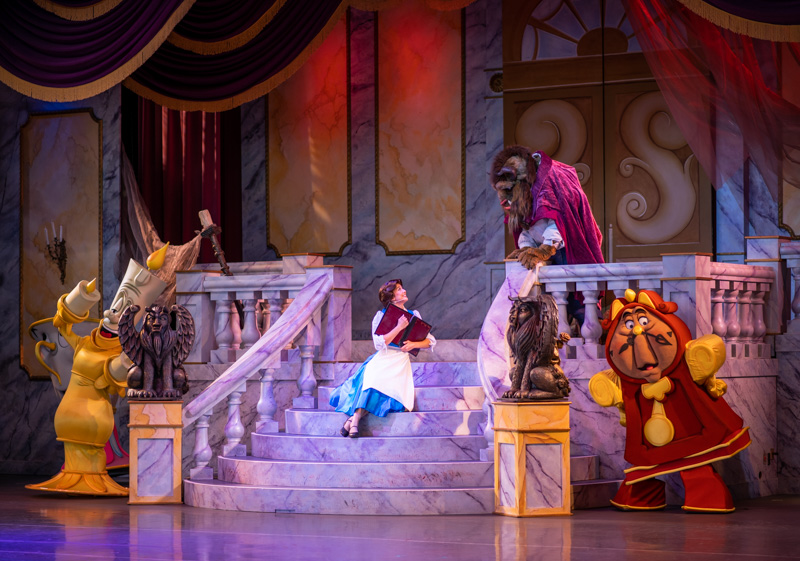
Although it’s most pronounced at Disney’s Hollywood Studios, this is a problem throughout Walt Disney World. The lack of shows, atmospheric entertainment, and ongoing dining constraints (among other things) can result in “feels like” crowds that are worse than what’s reflected in the wait time data.
It’s also likely that with physical distancing gone and “please fill in all available space” back, guest perception of “comfortable congestion levels” is highly variable–especially among those who have largely avoided crowds for the last year-plus.
At this point, it’s still impossible to say what the impact of Genie+ and Lightning Lanes on wait times has been or will be. While it’s true that wait times have actually decreased across the board since the Genie system debuted, we would caution against drawing any conclusions from that, good or bad.
The lower wait times doesn’t mean that Genie has “caused” cancellations or people to avoid Walt Disney World. (That could be true eventually, but we wouldn’t be seeing it in the numbers yet.) It also doesn’t mean that Lightning Lanes don’t negatively impact wait times by much. (That also could eventually be true, but we doubt it–utilization will increase over time, and higher crowds will lead to more guests buying.)
Our only takeaway at this point is that more schools had fall breaks in mid-October, resulting in a lower end of the month with fewer group events to fill the gap. For better or worse, Genie hasn’t changed the equation on crowds much yet. But it’s still early in the game.
Looking forward, you might notice that crowd levels have started to tick up in the last few days on each of those graphs. This is in part driven by Halloween weekend and nice weather, but there’s a bigger culprit: Jersey Week.

Jersey Week is usually a big driver of crowds during the first week of November, and it shouldn’t be any different this year. For some of you, it might stretch credulity that a single state–and one geographically fairly far from Florida–could have such a significant impact on crowds. I don’t know what to tell you other than: it does.
Crowds in the coming week being elevated due to Jersey Week is hardly a bold or new prediction. The annual teachers’ convention has had an outsized impact for as long as I can remember. Speaking of “outsized impacts” that a lot of fans find unbelievable: Veterans Day is the same way for that entire week. Again, nothing new there–all of this is covered in our November 2021 Crowd Calendar.
Additionally, there’s the Reopening of International Travel’s Potential Impact on Walt Disney World Crowds. Our expectation is that there will largely be a lag between the November lifting of the border closure and significant international travel.
However, that doesn’t mean there won’t be some degree of spike of visitors from the United Kingdom, Europe, and beyond at Walt Disney World for this holiday season. Airlines have already ramped up their international flight schedules due to high demand.
Ultimately, the next 2 months are going to be busy at Walt Disney World. Although elevated, the next two weeks are still far from the worst of it. We continue to expect crowd levels of 7/10 or higher for the majority of dates in November and December.
The good news is that crowds during the last two weeks have been lower than we expected, and present cause for mild optimism–especially during non-holiday weeks in November and December. The bad news is that we probably won’t see crowd levels as low as the last two weeks again at any point during the remainder of 2021. Still, we might have more than just a handful of moderate crowd dates, which is much better than previously forecast.
Planning a Walt Disney World trip? Learn about hotels on our Walt Disney World Hotels Reviews page. For where to eat, read our Walt Disney World Restaurant Reviews. To save money on tickets or determine which type to buy, read our Tips for Saving Money on Walt Disney World Tickets post. Our What to Pack for Disney Trips post takes a unique look at clever items to take. For what to do and when to do it, our Walt Disney World Ride Guides will help. For comprehensive advice, the best place to start is our Walt Disney World Trip Planning Guide for everything you need to know!
YOUR THOUGHTS
Predictions for where crowds go from here in the first two weeks of November or once Christmas kicks off? Do you agree or disagree with our assessment of Jersey Week and Veterans Day on crowds at Walt Disney World? Visiting for either? Thoughts on the eventual impact of Genie+ and Lightning Lanes on wait times? Did you visit Walt Disney World during October 2021? If you’ve visited in prior months during the last year, how did crowds compare between then and now? What did you think of the wait times? Any parks or times of day noticeably worse than the others? Do you agree or disagree with anything in our report? Any questions we can help you answer? Hearing your feedback–even when you disagree with us–is both interesting to us and helpful to other readers, so please share your thoughts below in the comments!


We’re here now and predicted weather calls for steady rains this weekend (Fri thru Sat) along with predicted high crowds? Will be interested to actually see.
We stayed at the Yacht Club 10/29, 30 and 31. We went to Hollywood Studios and Epcot. We took advantage of magic hours in the morning for both and that was how we got on the most rides. We had no wait at Rides of the Resistance, short at Slinky however it broke down and we received nothing to come back. Easy to ride Rockin Roller Coaster and Tower of Terror. We were also able to get into Epcot after 2. We are season passholders. Again we got on Soarin and test track and we’re able to get into the Q for Remy.
I think Harmonious was lousy. The music was like a bunch of jumble that made no sense. No melody. We will not be wasting our evening STAYINPBG to watch that. Never missed tapestry of dreams in all the years we went but very, very disappointed in Harmonious.
Lastly, it was not extremely crowded when we were there however when it is I think removing fastpasses which you could get 60 days in advance when you stayed at a Disney resort and replacing with Lightning Genie which you can’t do till the day of is ridiculous. We liked planning our park and our rides and our times at the hotel pool.
Epcot sucked today!!!! Guest relations a total jerks! This is the last trip We’ll never come back to Disney.!!! EPCOT was horrible
Way too many people. Cut right in front of you run right in front of you, not looking where they’re going. People are even rude that are there. And spending so much money here for the last six years. Disgusted with it
I was not born in the state, but it’s my home. Please refer to it as New Jersey or NJ, but it’s like nails on a chalkboard when people refer to it as “Jersey”. Also, “merch” – can’t y’all say Merchandise? A few more syllables, please! 😉 Love you guys!
@Erin Thank you for the explanation!
Tom,
What do you see for wait times over Christmas week?
I am expecting crowds, but what % capacity are the parks at. For the official day of the 50th the park was maxed out and wait times were very good. Do you think it will be a similar situation?
Brazilians are going too, we miss Disney dearly.
@Jared W: Jersey Week is the week of NJ’s teachers convention. For my district, we have half days for MTW (where we do afternoon and evening parent-teacher conferences) and then the kids are off Th and F so the teachers can go to the convention. Some people leave for the whole week (because the kids are just out for half days) and others leave after Wednesday. We went to Disney in 2019 for Jersey Week and knew at least half a dozen other families who went that week.
We were at all parks 12 and 13 October and 18 October and found very long wait times for Rise (120+ minutes), Avatar (90 + minutes) all day. Crowds at Epcot for the Food and Wine Festival were shoulder to shoulder whether it was afternoon or evening. Lines for food were 30+ minutes unless you went to the less popular Morocco or grabbed an egg roll inside China. Rides were much less egregious there. We are slated to return 16 December and it remains to be seen what we will encounter. We are prepared for anything.
Can someone explain what Jersey Week is? Like I have heard of it and the name seems self explanatory but exactly *what* is it? Is it some kind of convention in the area every year? Are there officially sanctioned Jersey Week events? Or is it like Gay Days where it’s a group of people who just collectively decide to coordinate their visits each year?
I wonder how vaccination approval for ages 5-12 will impact crowds? I personally know two families that postponed October trips because they had assumed their younger kids would be vaccinated by October, but they were not yet eligible. With that approval coming any day now, I wonder if more families will feel comfortable?
At the parks last week,did Magic Kingdom on Tuesday.Although there were plenty of people,some ride waits very manageable. I think just 25 minute wait for splash mountain. I really enjoyed both the new fireworks show at MK and Harmonious at Epcot.
I went October 19-24, the first week of Genie+ and didn’t use it. Was able to rope drop the big names at all parks. We did 7 dwarf right after the fireworks. However we got terrible spots to see the projections. I do think it seems more crowded without character stops and entertainment. Nothing was more than a posted 45 min wait, except Jungle Cruise. I’m not tempted to pay for Genie+ yet, but will definitely continue to check this blog for the best tips.
It is kind sad, yet funny if ya think about, Disney can take all the perks away and charge whatever for rides and fast pass, and everything else,( I believe monetized character meet and greets are in the future) and yet everyone still just keeps going spending it and dealing with it, so why even complain, we are all just getting conditioned to paying more for less. Yeah paid fast pass, no more pesky EMH, and good riddance to ME, we never really needed any of that stuff anyway. I am really starting to feel depressed that we are even going next year. I would cancel it sure, however I really think my wife would be heart broken so, you know, line me up as well.
LL at MK on Mon 10/25 was well worth it. Either didnt use early when we rope dropped or didnt wait in any line more than 20 min all day using it or not. Make a plan. Did 7 dwarfs after Enchantment and almost walked on. Only down side was criss crossing the park multiple times to avoid lines or to use LL. Id rather walk extra then stand in line. Rope drop 8:30am(7dwarf down) Space Mtn, Peter Pan, Haunted Mansion, Splash Mtn, and Big Thunder (LL) by 10-1030. 15,000 steps. Fewest of any day
Go Mon-Thur. By lunch time Fri-Sun crowds are out of control. Rope drop early or ride the big rides at the end of the night. Otherwise long wait times or Lightning Lanes will be needed to make it manageable.
Was in the parks Tuesday-Saturday this week and generally had a pleasant experience crowd-wise (my disappointment at my first viewing of Enchantment is a different story, though I was pleasantly surprised at how much I enjoyed Harmonious). Crowds somehow felt lower than my last trip in March (when masks were required everywhere and capacity was theoretically more restricted).
I have visited during every piece of green on those graphs which has led to the skewed perspective on my end that there either are never crowds at Disney World…or that there are always crowds but everybody is avoiding me. Because of that, I’m oddly looking forward to my mid-December trip this year, to see what it usually looks like when I’m not there. Despite being an engineer and loving to analyze trends, though…it seems like there are too many variables to really predict any given upcoming non-holiday day. Still…even when you aren’t right, you’re at least logical!