
Back to School Crowds Going Down at Disney World
As happens every year around this time, crowds are starting to fall before Fall 2023 at Walt Disney World. This wait times report covers data for Magic Kingdom, EPCOT, Hollywood Studios, and Animal Kingdom. It also offers commentary about the why of attendance trends, discrepancies between congestion and wait times (why it might feel worse than the data suggests), and forward-looking predictions for September 2023.
For the most part, crowds have followed a familiar pattern to wrap up the summer tourist season. Late July into early August started out busier as summer wrapped up, with locals and tourists making their last visits before vacation season came to an end. Major school districts going back into session resulted in lower wait times, a trend that has accelerated mid-month when Osceola and Orange Counties in Central Florida started their new academic years.
I don’t think many people would consider August part of Fall 2023, but Walt Disney World begs to differ. The 2023 Mickey’s Not So Scary Halloween Party has been underway for a couple of weeks, bringing shorter operating hours to Magic Kingdom for regular day guests on those evenings. This is something we already covered last week in Magic Kingdom’s Third Slowest Day of 2023! The title pretty much says it all, but the post is worth skimming if you’re somehow still on the fence about doing MK on MNSSHP days.
As always, what’s covered in these “crowd” reports is posted wait time data scraped from My Disney Experience and compiled into graphs covering various days, weeks, and months. Posted wait times are good for identifying big picture trends, but the data is not conclusive of in-park congestion or “feels like” crowds.
Posted wait times offer insight into how busy Walt Disney World is, but they are an imperfect measure of crowds. They’re almost always inflated, some lines don’t post wait times, other attractions that have wait times this year didn’t have them last year or several months ago, etc. Nevertheless, wait times are the only objective measure of crowds that we have. On-the-ground observations can be useful, but they also have tremendous shortcomings–for some reasons we’ll discuss in the commentary.
Beyond all of that, frame of reference is a major issue. Walt Disney World attendance has increased by several million people over the course of the last decade-plus through 2019. Then attendance plummeted for a year-plus, spiked as a result of pent-up demand for 2 years, and is now coming back to reality.
Nevertheless, the vast majority of days in 2023 will be more crowded than their counterparts in 2015 or 2017. Same goes for comparing this year to 2020-2021. Really, the only worthwhile historical comparisons right now are 2023 vs. 2022 or 2019. The good news is that’s what’s measured here: how current crowds in 2023 compare to dates in the last year. (Admittedly, even that is far from perfect.)
We just want to offer these important caveats to stress the limitations of crowd reports and wait time data for Walt Disney World. If you think there are too many asterisks attached, that’s fair–maybe this type of post is not for you. With that out of the way, let’s dig into the data and look at Walt Disney World wait times. As always, all graphs and stats are courtesy of Thrill-Data.com:
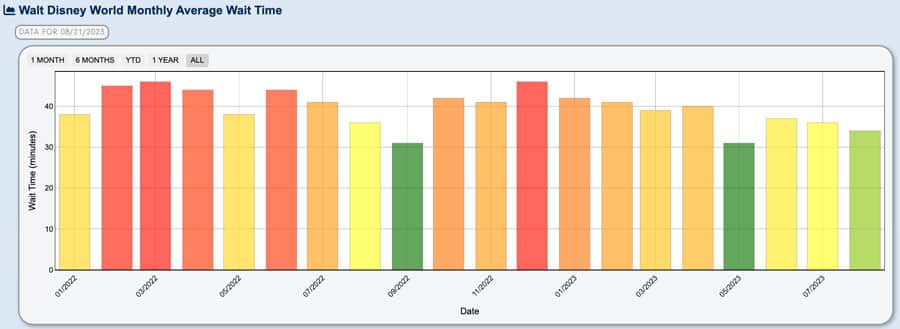
We’ll start with the monthly numbers for Walt Disney World as a whole.
After peaking in June, summer crowds declined in July and that trend has continued in August. That’s a very reductionist big picture view of the trends, but we’ll get to the more granular look in the weekly numbers. Regardless, the average wait time across all attractions for August 2023 at Walt Disney World is now 34 minutes. Expect the final number to be 1-2 minutes lower than that, which will be higher than this May but lower than last August.
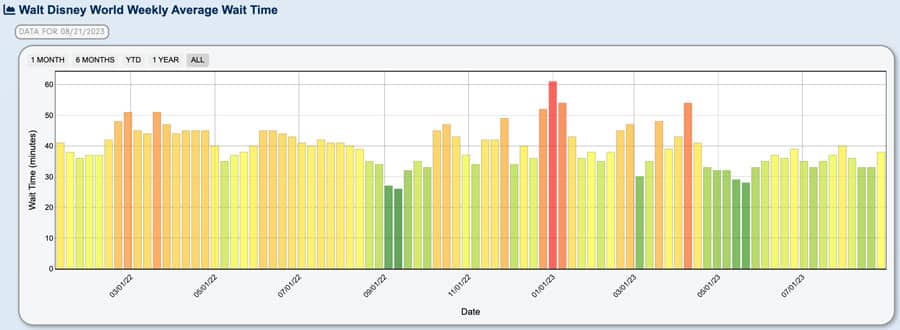
With the week by week view, we can see that wait times gradually increased over the course of May and throughout June, decreased starting around the Fourth of July, but then began a gradual rise heading into the end of the month.
The last week of July ended up being the busiest of summer, which is not uncommon. It’s likely a “last hurrah” of people taking vacations before school goes back into session. Crowd levels started August slightly elevated, but have been on a gradual decline since. (The far right bar is elevated, but this week is only two days old and Monday is the busiest day of the week.)
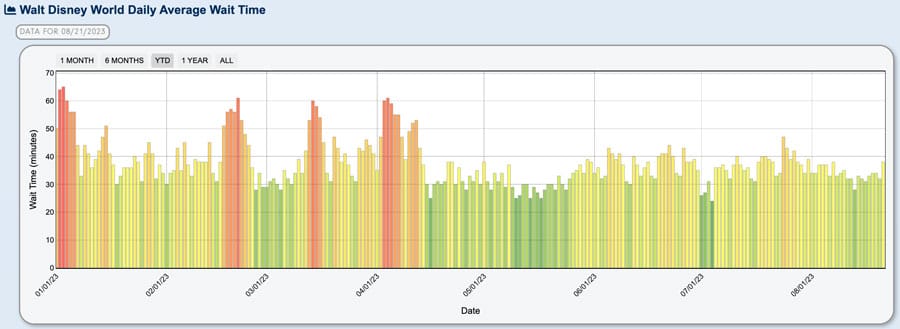
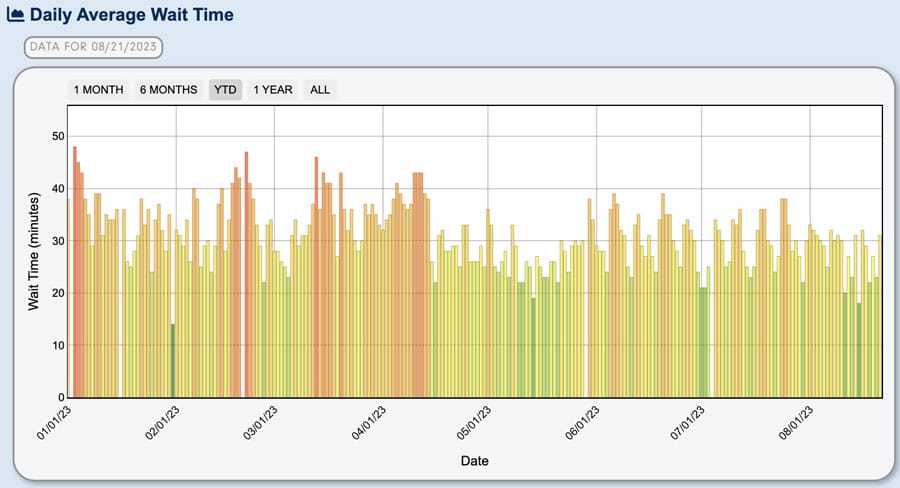
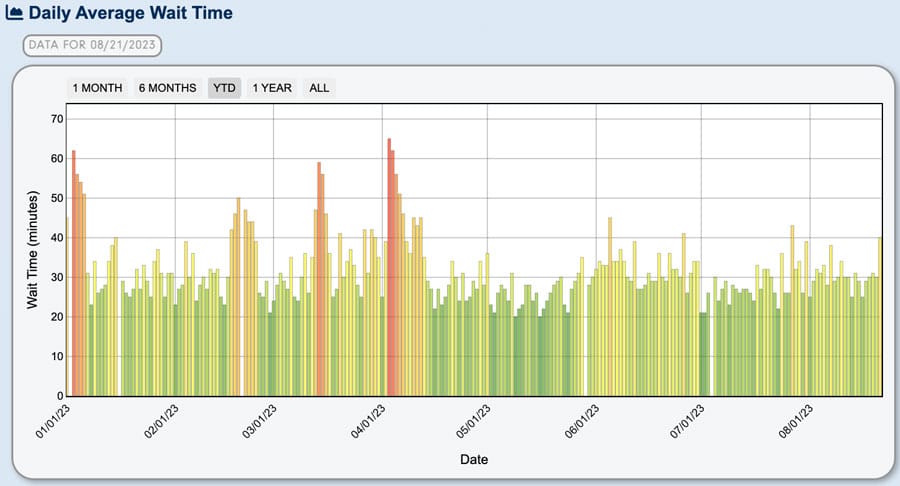
Individual days illustrate mostly the same, but with more bars.
Now that schools are starting to go back into session, it’s likely these numbers will drop even further. With roughly two weeks left in August, it’ll be interesting to see whether wait times fall enough to make this the least busy month of 2023 at Walt Disney World (so far). We’re skeptical. May was surprisingly slow and August numbers haven’t fallen that much yet.
For park by park analysis, we’ll start with Magic Kingdom.
Magic Kingdom has already started its “porcupine pattern” of crowds for Party Season, with full operating days being noticeably busier than days of Mickey’s Not So Scary Halloween Party. (Note that this does not include wait times during MNSSHP–only before it starts.) This is reflected in the wait time data and, holy cow, it’s even more evident from the in-park experience. But more on that in the commentary.
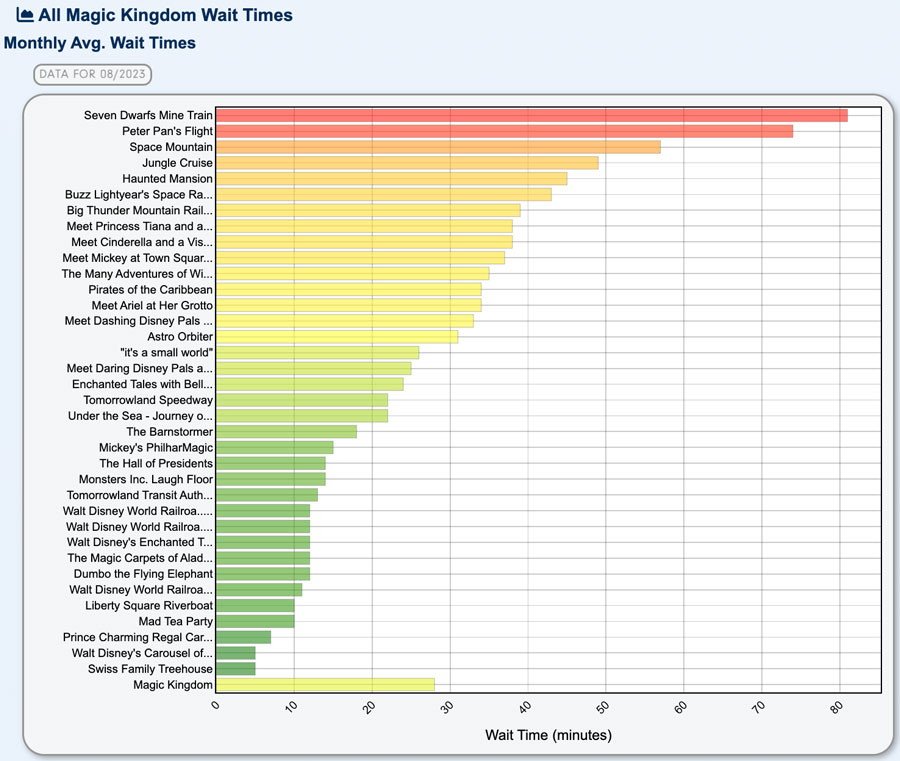
Above are the specific ride averages for Magic Kingdom.
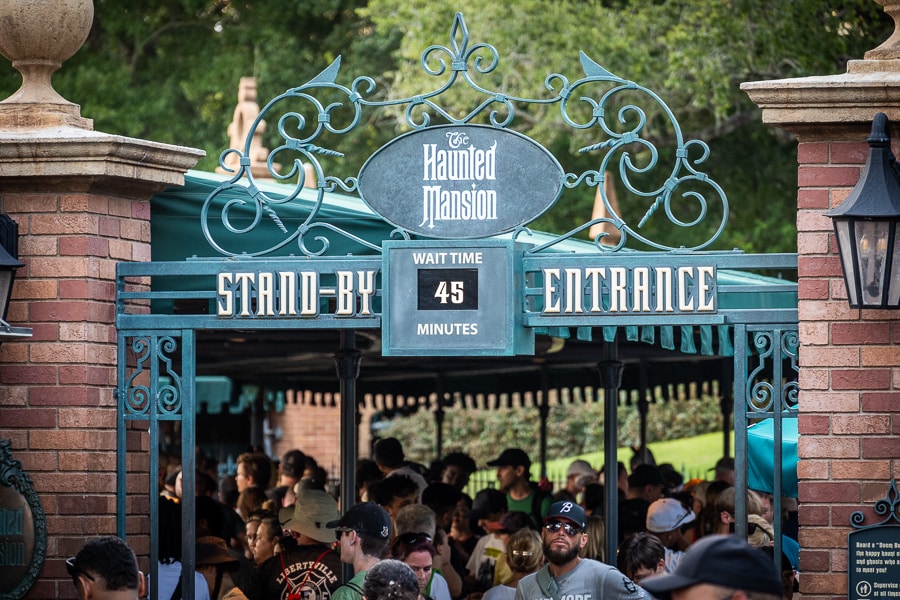
Pretty much exactly what you’d expect to see at the top of the list. Haunted Mansion is moving up, which is both attributable to pent-up demand following its closure (and perhaps confused guests expecting Hatbox Ghost to materialize) as well as the start of spook season. Either way, nothing really out of the ordinary with that.
More notable is that meet & greets are on the rise. This is a trend that started with Mickey’s Not So Scary Halloween Party, and will continue for the rest of 2023. We know this because we saw the exact same thing happen last year during Party Season. Not to ruin the illusion or anything, but the main explanation is that meet & greets are operating at reduced capacity as staff is spread more thin due to the hard ticket events.
I wouldn’t discount the weather, either. All of these meet & greets are indoors, so parents might be more inclined to view that ~45 minute wait time as a refreshing opportunity for air-conditioning. But the main issue is staffing, and Cast Members being needed for MNSSHP.
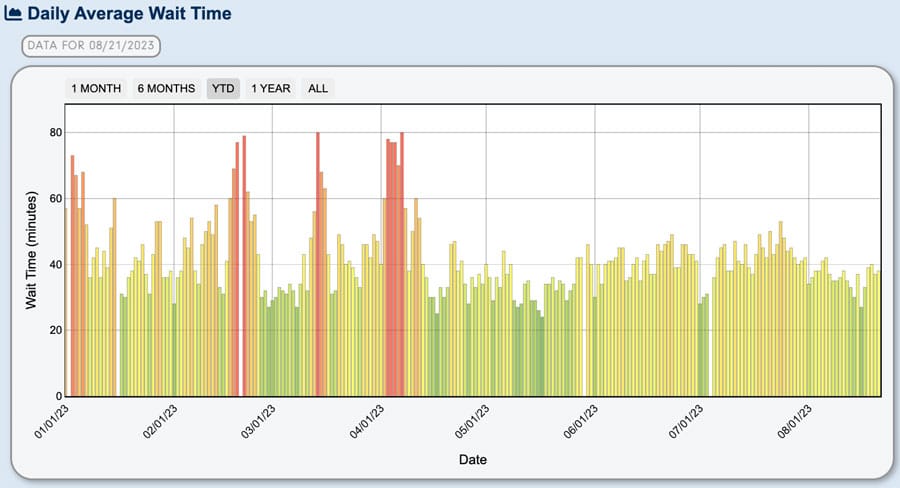
Animal Kingdom has seen its crowd levels all over the place this month. Just last week, average wait times ranged from 27 minutes one day to 40 minutes another day. That’s a huge spread and one without an obvious explanation.
I was in Animal Kingdom on days with 30 minute and 38 minute averages and the midday difference was pronounced. The good news is that, as always, early mornings and late afternoons remain “undefeated” and actual wait times were minimal during those timeframes on both days.
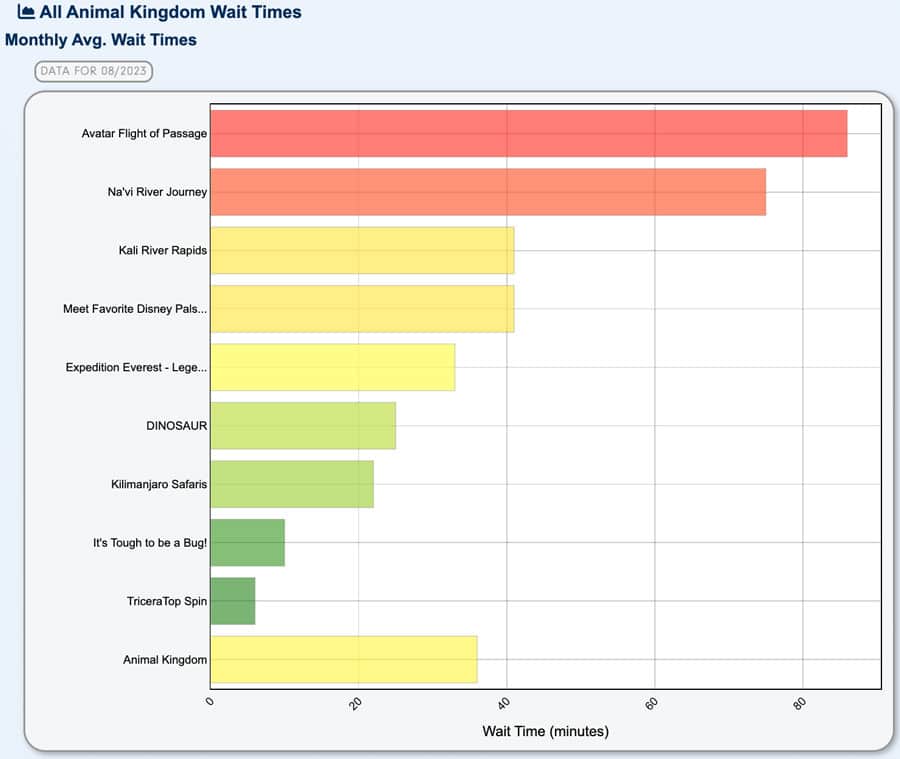
Above are attraction averages for Animal Kingdom.
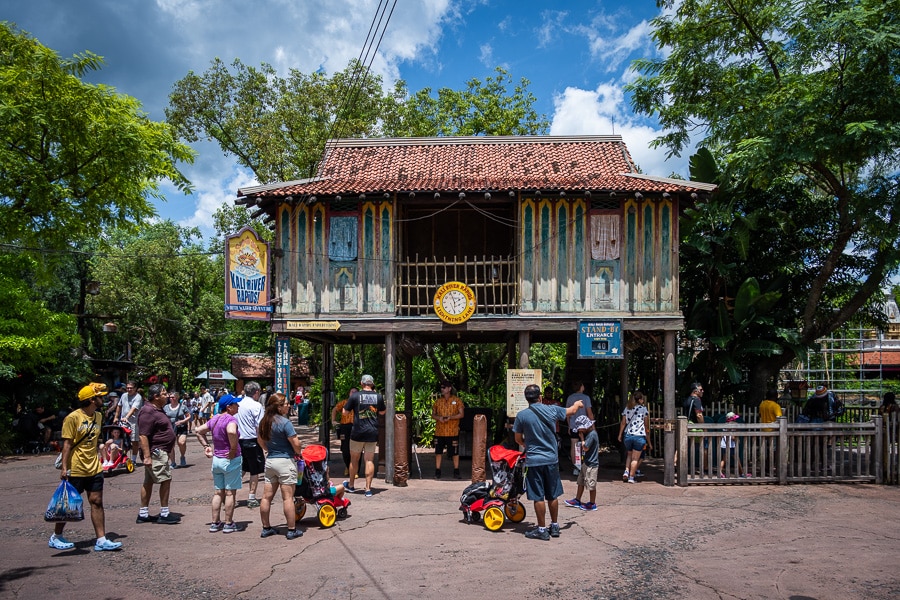
This is mostly unsurprising. Avatar Flight of Passage and Na’vi River Journey always dominate the top, and Kali River Rapids is consistently popular when it’s hot. It is interesting to see how much Kilimanjaro Safaris has fallen, which could be attributable to the heat. (I did it a couple of times during the midday hours because it was a near walk-on while other attractions, including Dinosaur, had significantly longer waits.)
Over at EPCOT, wait times have mostly held steady as compared to summer.
EPCOT is always a wildcard, but I’ll admit that this one caught me by surprise. EPCOT is also the locals’ park, and Floridians are more likely than tourists to cancel park plans at the last minute if the weather is bad. It has been a hot and humid month–even worse than July, somehow.
Locals are also more likely to visit for events, though, and the EPCOT Food & Wine Festival did just start at the end of last month. Usually that means worse “feels like” crowds and isn’t reflected in wait times, though.
There have also been Cast Member previews for Moana’s Journey of Water, and those dramatically expanded over the weekend. So perhaps those attendees and their guests are sticking around and doing other stuff after that? All really just a long-winded way of saying that I don’t know what’s up with EPCOT.
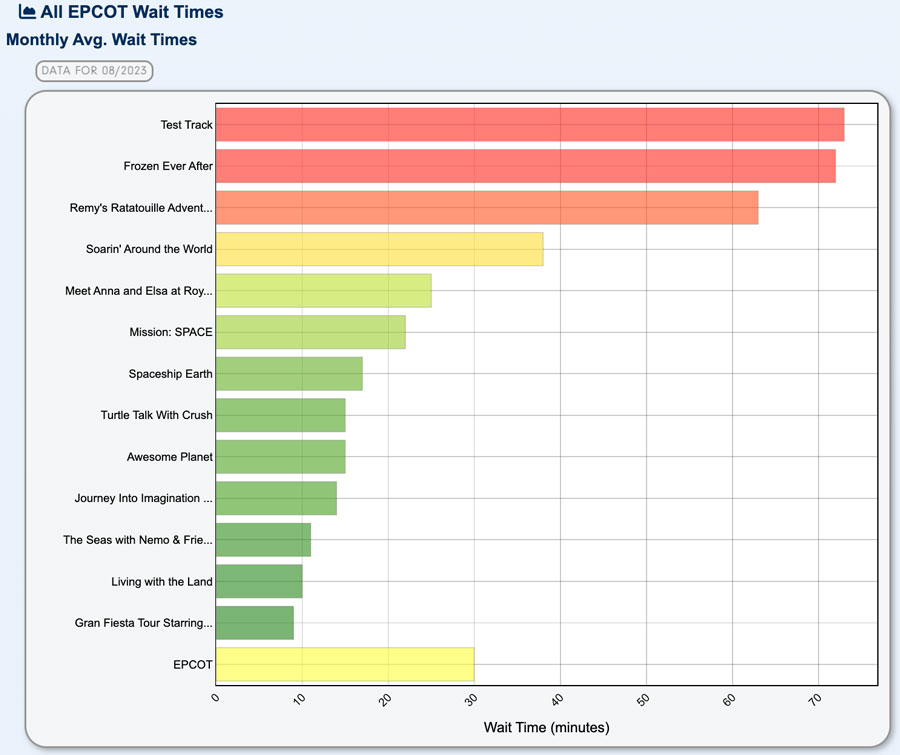
Above are individual attraction wait times at EPCOT this month.
Frozen Ever After, Remy’s Ratatouille Adventure, and Test Track are always the top tier trio at EPCOT. Of those, Test Track is usually third place, but it’s raced to the front of the pack this month. That’s likely attributable to a combination of downtime and Lightning Lane availability pushing up the standby average. I saw several instances of Test Track posting triple-digit wait times (with an overflow queue to match) even when Frozen Ever After or the Rat Ride were “only” at 60 minutes or less.
On a different note, it’s only a matter of time until Guardians of the Galaxy: Cosmic Rewind drops its virtual queue and adds a standby line, which will spike the wait times average pretty significantly. (Since the VQ return line currently does not post a wait time.) In fairness, we’ve been saying this for (literally) the last year, and it has yet to happen. But even a broken clock is right twice a day!
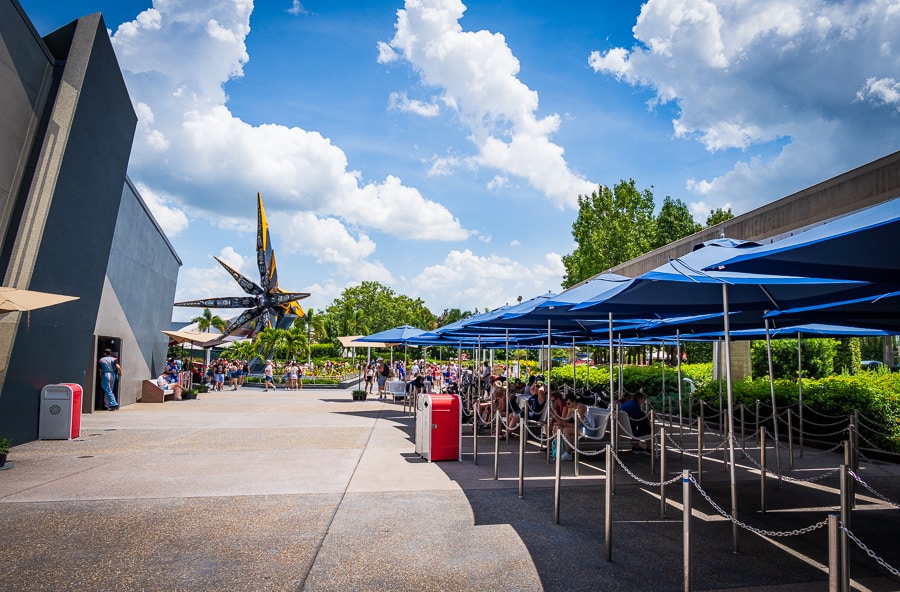
Earlier this summer, switchbacks and umbrellas went up for an outdoor overflow queue. My assumption is that this hasn’t been put into use yet because it’s simply too hot. More recently, benches have been added to this area and are being used by a good number of guests. The switchbacks are still up, so it looks like guests using the benches are in a very low-security “Disney Jail.” (I found this way more amusing than it probably is to anyone else.)
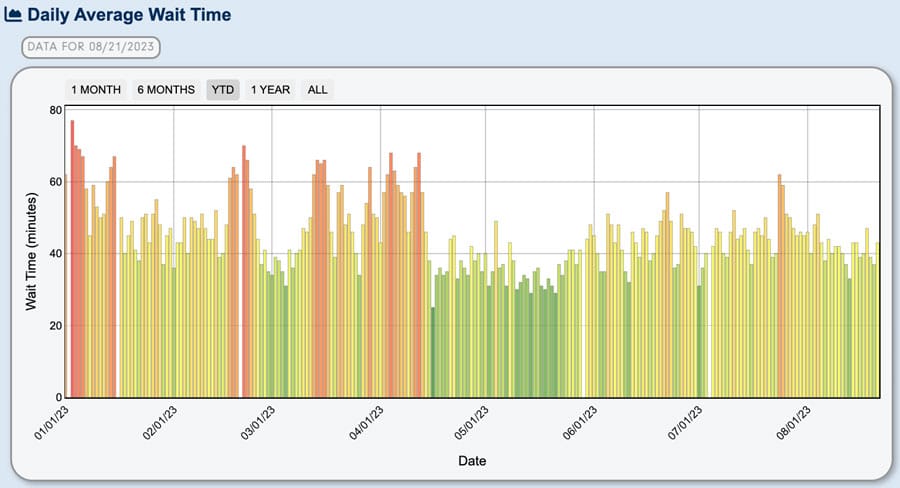
Finally, there’s Disney’s Hollywood Studios.
Since the start of August 2023, DHS has experienced a wide range of wait times, from days averaging 33 minutes on the low end to other days averaging 47 minutes on the high end. That’s actually a colossal difference in ‘feels like’ crowds at DHS. Speaking from experience last week, the former is blissful whereas the latter is brutal.
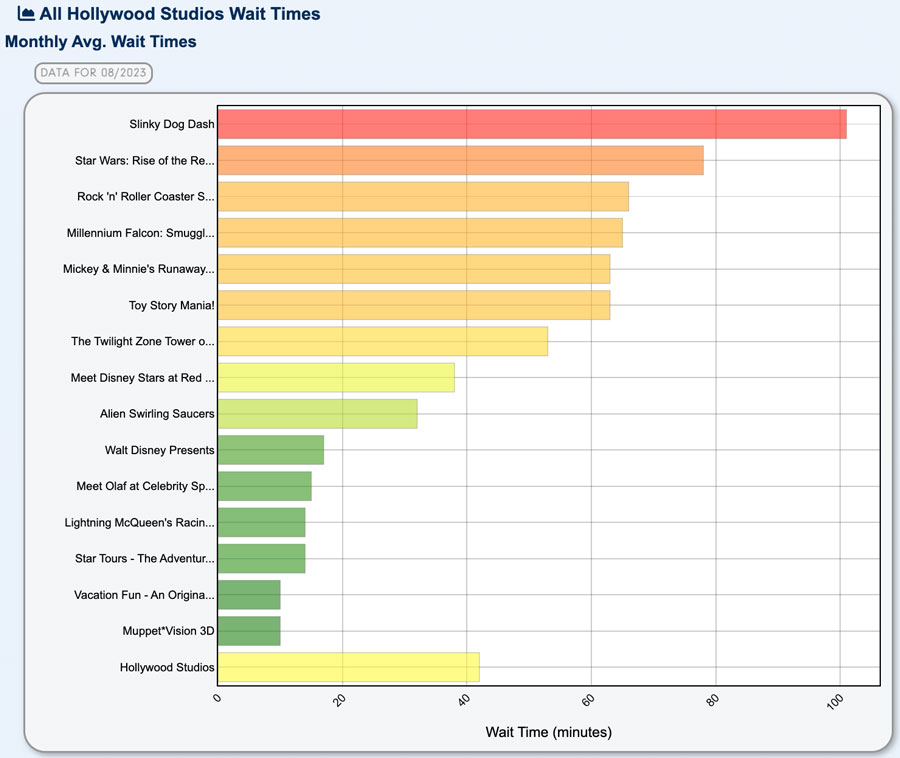
Above are ride-by-ride wait times for Disney’s Hollywood Studios for August 2023 thus far. The biggest surprise here is that Slinky Dog Dash has raced past Star Wars: Rise of the Resistance and has a commanding lead. It’s not uncommon for the two to be neck and neck, but a spread of over 20 minutes is unprecedented. Anecdotally, it seems like Slinky Dog Dash has had a rough month with a lot of downtime whereas Rise of the Resistance has not.
As with Animal Kingdom, wait times vary widely over the course of the day. The bulk of guests cram into DHS during the midday hours and typically leave early. Early Entry and the last two hours of the evening remain delightfully uncrowded, and you can accomplish more during those ~3 hours than the entirety of the midday stretch. Day of the week also matters a lot, as will be discussed below.
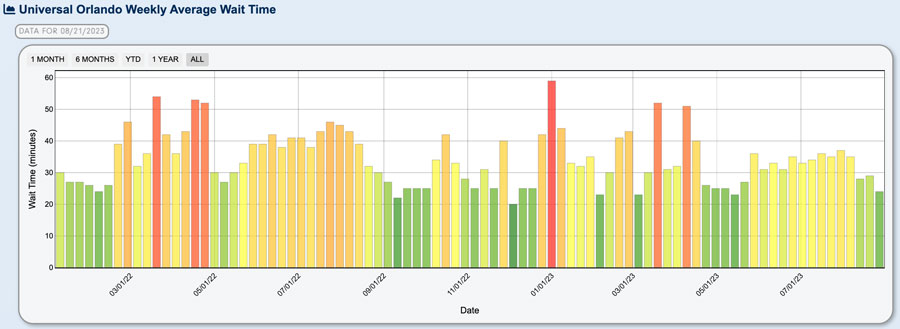
For the sake of comparison, here’s a high-level look at the weekly wait time averages for Universal Orlando. After outperforming this summer as compared to Walt Disney World, the off-season slump has happened earlier and sharper at Universal. Part of this is simply a matter of the comparisons–again, summer was busier at Universal.
There’s also the fact that Halloween Horror Nights doesn’t start until September 2023, so it’s likely that locals and out-of-state Universal regulars are postponing visits until then. My guess is that this is the calm before the storm, and Universal will bounce back a bit next month. It’ll still be slow during the day as compared to peak season, but the current trend will reverse slightly–whereas Walt Disney World will continue trending downward.
On a related note, I’d expect Halloween Horror Nights to be absolutely bonkers this year. Given the strong roster, it’s honestly surprising that the two lowest levels of ‘fear’ passes are priced as low as they are, or don’t have more blockout dates. Don’t be shocked if crowds are so bad this year at HHN that those passes vanish next year or see significant price increases. HHN diehards might not like hearing that, and it’s a good problem to have for Universal, but what they’re doing does not seem healthy or good for the guest experience.
Turning to commentary, let’s start by reiterating that attendance is down at Walt Disney World year-over-year. During this month’s earnings call, Disney CEO Bob Iger confirmed both lower attendance and hotel occupancy at Walt Disney World. In fact, the underperformance of Parks & Resorts was almost entirely attributable to Walt Disney World; Disneyland and Disney Cruise Line are still doing well (lagging pent-up demand as compared to Florida), as are the international parks (favorable comps).
This isn’t the first, second, or even third time that the company has ‘warned’ investors of a slowdown at Walt Disney World. They’ve previously attributed this to the end of “revenge travel,” the conclusion of the 50th Anniversary, and poor weather. They have not blamed the decreases on politics or perceptions of Florida. That doesn’t mean there aren’t other contributing factors, but everything we’ve seen suggests it’s mostly a story of pent-up demand exhausting itself. Everyone wants to see their own narratives vindicated, but the explanation is pretty boring and straightforward.

One “interesting” claim we’ve seen repeatedly on social media is that it’s actually busier than ever, and all of this is an attempt to “trick” people into visiting Walt Disney World with the promise of low crowds. That’s certainly a theory…but not a good one. For one thing, the company is only claiming that attendance is down at Walt Disney World. Why not trick everyone, everywhere?! For another thing, it would run afoul of SEC rules.
Finally, it wouldn’t work. People don’t see reports of low crowds and then book vacations for the following week 0r month en masse. If that happened in any meaningful numbers, September wouldn’t be the least-crowded month year in and year out. Like most conspiracy theories, it requires a simplistic view and falls apart under any degree of scrutiny. It’s nonsense.
With that said, I can understand how recent visitors would be skeptical about claims of low crowds. Honestly, my on-the-ground experiences with ‘feels like’ crowds at Walt Disney World in the last couple of weeks have at times been at odds with the wait time data. Against my better judgment and tolerance for bad weather, I spent extensive time in the parks the last two weeks…and also the exact same two weeks last year.
If you asked me which set of dates was busier and I didn’t have the opportunity to consult wait times data, I’d pick August 2023 without hesitation. And as it turns out, that would conflict with the actual numbers. Wait times are down slightly year-over-year during the first three weeks of August 2023. Not as much as they were for the same dates over the late spring or summer, but still down.
Trying to make sense of the elevated feels like crowds, the first thing that really sticks out to me is the increased number of international guests. Either Americans have really honed their British accents and are practicing in the parks, or guests from the United Kingdom have returned in full force this fall. I don’t think I’ve ever heard as many British visitors (as a percentage of all guests) as in the last couple of weeks.
This is both surprising and makes complete sense. As we’ve discussed, pent-up demand has occurred in phases (for lack of a better term). Florida reopened before California, so Walt Disney World experienced it earlier and, generally, has seen it wind down sooner than Disneyland. It’s a similar story for Disney Cruise Line, which had health safety protocol into early last year.
![]()
There have been countless stories about how Americans spent the summer swarming to Europe. That’s largely much of the same story about ‘phased’ pent-up demand. International travel took longer to resume, so travelers are turning to that after getting their “fill” of domestic destinations the last two years. It thus makes sense that Europeans are doing likewise, and heading to the United States. One particularly popular destination among UK visitors is Central Florida.
However, another reason that Americans are traveling internationally is the strength of the dollar. We can, ironically, live like kings in much of Europe. The flip side of that is that the United States is much more expensive for most international visitors. That’s doubly true for those heading to Walt Disney World. Not only is the exchange rate working against them, but prices are up significantly as compared to when many of them last visited in 2019. (They also aren’t getting “real” Free Dining, which was a big promo for that demo in the past.)
So this degree of lagged pent-up demand among international visitors at Walt Disney World is somewhat surprising, even if it’s completely in-line with bigger-picture travel trends.
Then there’s the weather. We were admittedly dismissive of the degree to which low Independence Day crowds were due to the heat, but it’s probably a much bigger factor right now. Central Florida is in the midst of an unprecedented heat wave, with daily excessive heat warnings for much of August. It’s been a brutal summer, but it’s gotten even worse recently; that plus the duration of the record high temperatures has likely put a dent in crowds.
Frankly, I’ve been surprised at the resiliency of crowds given the weather. Tourists with trips scheduled are going to visit regardless–weather doesn’t really change their approach due to the high cost. Annual Passholders and other locals are a different story, though; they can and do avoid the parks when the heat and humidity are this bad. So it’s interesting that wait times aren’t down more given that.
My next observation is that choosing the right day of the week is extremely important, and will continue to be, for the next 5 months. We’d highly recommend consulting our recently updated Best & Worst Days to Do All Parks at Walt Disney World in 2023. That offers regular advice, how it changes for Party Season, and the recent trends with slower weekends.
If did a good job picking days of the week–especially Magic Kingdom and Disney’s Hollywood Studios–your perception might be that there’s already an off-season slowdown at Walt Disney World. And weather aside, that it’s a great time to visit. If you chose poorly (again, especially at those two parks), you might conclude that both weather and crowds are worse than ever.
Crowds definitely are not worse than ever, but as someone who has to do both the good and bad days of the week in each park for the sake of research, I was surprised at just how bad Magic Kingdom and Disney’s Hollywood Studios were on the “wrong” days as compared to the “right” ones. I’ll have Early Entry and rope drop reports soon, but suffice to say, my experiences were significantly better on the good days at each.
It’s still early in Party Season and a lot could change, but my preliminary assessment is that Disney’s Hollywood Studios is seeing the bulk of displaced attendance on MNSSHP days at Magic Kingdom. We didn’t really see this (as much) last year, but it makes sense. Disney’s Hollywood Studios is clearly the second highest priority park at Walt Disney World; Fantasmic is back, and Harmonious is gone. Suffice to say, you might want to avoid DHS on MNSSHP days and do DHS on days when Magic Kingdom has longer operating hours and Happily Ever After scheduled.
It’s more difficult to get a solid read on EPCOT and Animal Kingdom at this point. Feels like crowds and wait times have been inconsistent at both this month, but it’s tough to explain the “why” of that at this point. Beyond normal day of week trends, attraction breakdowns and the subsequent backup of Lightning Lane guests are probably the easiest explanation.
Looking forward, our expectation is that crowds continue falling. As discussed in our list of the 10 Best and 10 Worst Weeks to Visit Walt Disney World in 2023 to 2025, September is the best month of the year to visit from a wait times perspective. Literally the entire month sees below average attendance. Even Labor Day draws fewer visitors than most other holidays.
There’s really no bad time to visit as far as the September 2023 crowd calendar goes. The first weekend and the last week will be the two busiest weeks. However, “busiest” is a relative term, as even those should be really light compared to the entirety of October. September is one of the last bastions of the off-season at Walt Disney World.
This has been consistently true even as attendance has spiked during other previously off-season months. Whereas other off-season months have gotten busier, September has stayed the same–and (knock on wood) always should remain that way due to school schedules and less desirable weather. There’s a possibility that September 2023 will be busier than last year due to international visitors, Moana’s Journey of Water previews, or other wildcards, but it still should not be bad by any objective metric.

Ultimately, our expectation is that attendance continues to decrease over the course of the next couple weeks, but probably not enough for August to (temporarily) take the crown from May as the least crowded month at Walt Disney World in 2023. Regardless, it’s a near-certainty that September 2023 will be even slower than both, and end up as #1 in terms of lowest average wait times.
The big question marks are the aforementioned international tourists, plus fall group events and convention crowds. There’s an outside chance that the last week of September sees an outsized spike due the arrival of these, plus early fall breaks for various school districts around the country and diehard WDW fans visiting for the start of Disney100 at EPCOT. Even if all of that happens, it’s unlikely that September 2023 will end up being busier than this month.
My expectation is that the real arrival of fall crowds coincides with Columbus Day weekend, and that continues to accelerate with only minor reprieves here and there throughout the holiday season. Early signs point to October through December being the three busiest months of the year (on average), albeit with the normal pockets of moderate crowd levels between the peak holiday weeks.
Planning a Walt Disney World trip? Learn about hotels on our Walt Disney World Hotels Reviews page. For where to eat, read our Walt Disney World Restaurant Reviews. To save money on tickets or determine which type to buy, read our Tips for Saving Money on Walt Disney World Tickets post. Our What to Pack for Disney Trips post takes a unique look at clever items to take. For what to do and when to do it, our Walt Disney World Ride Guides will help. For comprehensive advice, the best place to start is our Walt Disney World Trip Planning Guide for everything you need to know!
YOUR THOUGHTS
Thoughts on early fall crowds at Walt Disney World? Predictions for the rest of the month or fall off-season? If you’ve visited within the last month, what did you think of wait times? Have you done Magic Kingdom during the day of a MNSSHP night? Noticed the roller coaster crowds at Disney’s Hollywood Studios or Magic Kingdom caused by Party Season? What about posted vs. actual wait times? Do you agree or disagree with anything in our report? Any questions we can help you answer? Hearing your feedback–even when you disagree with us–is both interesting to us and helpful to other readers, so please share your thoughts below in the comments!


Hi Dear,We are willing to collaboration a link on your page https://www.disneytouristblog.com/school-back-session-crowds-down-disney-world/
Our sites are related to IT Examination please check it examlabs.com, exam-labs.com, examsnap and prepaway from these one of link is for your web.Our fee is $ 90/- each link.We have lots of clients so you will get steady orders from us.Please let me know can i send you web details?Waiting for your supportive response,Regards,
Thank you for all the time and effort you put into each of your posts. I look forward to them and I read them whether I have a trip planned or not:). Speaking of trips, we are taking a quick trip to WDW over Labor Day weekend and I was wondering if you still felt like the holiday weekend may be less busy than “expected”. I know you referenced it over the summer as potentially being on par with the 4th of July and I was just wanting to see if your thoughts had changed. thank you!!!
Do you think you’ll be posting a HHN strategy guide? I (unfortunately) agree that it’s probably going to be bonkers this year, and I’m hoping to get some tips on how to stay ahead of the crowds. We’re going the last week of September. By the way, they increased the ticket price on tickets for that Wednesday and Thursday (originally posted at 79.99, now 84.99), which doesn’t bode well.
Don’t underestimate the number of people locked out of the country due to their covid vaccine status. Since May international visitors have been able to visit even if they’re not vaccinated. This could well explain the huge number of British people.
We’ve been at AoA resort since the 16th and have seen the resort get busier each day Friday through Sunday. Check-ins definitely greater than check-outs. The parks have not been the ghost towns that the media is reporting. Wait times and crowds feel similar to our trip last year (first week of Aug in 2022). Planning to do MK on Tuesday early entry on a party night hoping crowds will be low and wait times will be short. And, yes, we have noticed a large number of British accents and European languages being spoken this trip.
Hi Tom! Been following your blog for the past couple of months and has greatly helped w/ my family’s WDW planning (first time visitor here and unfortunately have limited time in Orlando thus we need to packed everything in 1 go). Just some inquiries hope you could help us with:
1. For the MagicMobile passes, do all tickets for the person be consolidated into 1 pass only? As I purchased 1 Single Day entry to Magic Kingdom + MNSSHP but only 1 pass can be generated.
2. Can I have multiple MagicMobile passes in my phone/apple wallet? as I am the designated pass holder and I just have to switch the passes upon entry?
and fingers crossed that October crowds will be moderate and not high 🙂
Thanks in advance
As the parent of school-aged children, posts like these always make feel a bit melancholy/wistful – knowing that the best dates to visit WDW (or DLR) in terms of crowds are exactly the dates we can’t come. Which makes perfect sense logically, of course. When the kids were really little we had a few uncrowded days at the parks because we didn’t need to worry about school schedules, and then later for years our school district had a Labor Day start date — but that’s since been moved up to align with most districts across the country who start in mid August.
All of which is to say that if your kids’ school year still starts in September (like much of New York/New England) you should absolutely be traveling to WDW or other US destinations during the last 2 weeks of August (up until Labor Day weekend itself as you’ll find everywhere to be cheaper and far less crowded. It’s the best travel “hack” that doesn’t involve truency!
Shhhh, don’t tell everyone my secret.
Spaniards here at Universal heading to WDW next Thursday. We already had the plans, budget and desire for 2020, but now we had to wait until we felt the pandemic under control (this may be the case for other Europeans). Hope to see you in the parks next days, even without Sarah for obvious reasons, I smiled internally today when I heard Megatron at Transformers 😉
As a Brit currently holidaying (or should I say, vacationing) at WDW, even I am surprised by the number of compatriots over here.
Thanks for all your insights. I’ve been reading for a year and they’ve been so helpful to us.
Just go all in and call it holidaymaking. It’s an objectively great term, and one that I’d use here if I thought enough Americans were familiar with it. (Sure beats adding superfluous vowels to words! 😉 )
Hope you enjoy the holiday!
Tom- Great article as usual with good insight. Question: I am seeing the first half of September’s MNSSHP tickets sold out. Is this normal? I am usually an early planner so I have not noticed the parties selling out before. I decided on a last minute trip starting September 11th, but seeing the sold out parties, I am concerned it’s going to be busier and should go later in the month. Any insight/opinions?
They’re all going to sell out.
I think that’s less a reflection of crowd levels and more a result of people using MNSSHP as a replacement for regular tickets as a way to get their “Disney fix.” We’ve seen exactly this happen with Oogie Boogie Bash at DLR, and I suspect it’s happening at WDW now, too.
That’s exactly what we’re doing. Going to POR for a resort stay during fall break for school, and got tickets to the party as our one parks experience-it was cheaper than park tickets for one day, and we get to see the park in a new way and ride our favorite attractions. I imagine lots of other folks do something similar!
This has nothing to do with this article but…we are at a rental property with some friends to close out the summer. One of the coffee mugs is an early 90s EPCOT Center World Showcase work of art. Made me think of the blog, and there is a small chance it might walk out of here :-). Hope you all were ok with the storms.
Reminds me of the time I was at a friend’s summer cottage in college and they had an old River Country towel they planned on throwing away. Suffice to say, it found a new home!
No real impact from the storms here, except a bunch of debris and losing power for a few hours. Put down a lot of sandbags that ended up being total overkill, thankfully.
This article reminds me of one of Josh Humphrey’s statistical blogs. I really miss him. R.I.P. Josh.
Other than that, I have nothing more to add. You seem to have covered it all. And for that (and your many other articles), I thank you.
That’s the highest possible praise you could pay a post like this. I’ll never be able to match Josh’s wit or insight–he was one of a kind. I really miss him, too.
I feel the same way. I love the detail in these articles and they’re very reminiscent of Josh’s statistical posts.
Do you think there will be a spike for d23 this year? Or will many of those visitors stay out if the parks and at presentations? When would those people show up? We were hoping for low crowds the full week of Labor Day and forgot about d23.
Destination D23 is a very small event as compared to D23 Expo. It has never impacted crowds in the past, and we are not expecting that to change this year.
It’s possible they’ll have an event in EPCOT on Saturday night, but even that would be confined to a corner at the front of the park and would have almost no impact on crowds or wait times.