
Summer 2023 Crowd Stagnation & Surprise Slowdown at Disney World

We’re back with another report on summer season crowds at Walt Disney World, and this one is really a tale of two months. We’ll take a look at final June wait times and how they compare to normal, plus the holiday weekend surprise to kick off July 2023. Plus, predictions for Independence Day and beyond at Magic Kingdom, EPCOT, Hollywood Studios and Animal Kingdom.
Let’s start by quickly recapping the last couple of months for those who haven’t been paying attention. Spring break had highs and lows, but was generally slower than last year as measured by wait times. Peaks predictably happened in mid-March around Central Florida school recesses, and again in the week leading up to Easter.
After that, crowds fell far and fell fast. The week after Easter kicked off the Slowest Six Week Stretch at Walt Disney World Since 2021. That was essentially the second half of April through late May, with the latter being the least-busy month since last September. Normally, the fall off-season is far less busy than the pre-summer shoulder season (hence the different monikers!).
There have been a lot of theories for the drop-off in crowds, and we’ll circle back to some of those in the crowd commentary later in the post. The one piece of good news, at least from our perspective in combating contentions on social media that Walt Disney World is actually busier than ever, is that the Walt Disney Company has directly addressed the slowdown.
Dearly-departed CFO Christine McCarthy warned investors of a slowdown as Walt Disney World “lapped” the 50th Anniversary. Still-current Disney Parks Chairman Josh D’Amaro reiterated this, indicating there would be a drop in demand at the Florida parks even as Disneyland attendance stays strong (attributing that to the latter reopening almost a year later).
Discounting has also gotten more aggressive. As we’ve mentioned repeatedly, Walt Disney World already has released over a dozen different discounts through Christmas Day 2023, which is more than were available for the entirety of last year. Most recently, the return of bounceback offers for 2024–that are better than what was last available in 2019/2020–joined that ever-growing list. (This one is especially significant since it suggests that Disney believes the slowdown will continue into next year.)
In addition to the resort offers, there are two new ticket deals for this summer, plus an increase in merchandise and dining discounts for Annual Passholders and Cast Members and V.I.Passholder days meant to get locals to EPCOT so they spend money on festival food & beverages. (That free Figment magnet was purely out of corporate kindness–but it did kill two birds with one stone!)
Frankly, I can’t believe there’s still any debate among fans about Walt Disney World experiencing a slowdown. The remarks from executives should’ve put that to rest, but if not, Disney is literally putting its money where its mouth is. The company doesn’t discount out of corporate generosity, and more APs were long ago branded as an “undesirable guest mix” from a revenue perspective.
At this point, it should be self-evident that “revenge travel” is officially over…at least at Walt Disney World!

Against that backdrop, let’s turn to the data and see how the back half of June 2023 and the Independence Day holiday weekend played out. As always, what’s covered in these “crowd” reports is actually posted wait time data scraped from My Disney Experience and compiled into graphs covering various days, weeks, months, and years. A lot can be gleaned from posted wait times, but it’s not necessarily conclusive of in-park congestion or crowds. Just wait times, which is only objective way to measure crowd levels.
Nevertheless, wait times are an imperfect measure of Walt Disney World’s crowds, especially if you’re comparing current conditions to prior years. Walt Disney World attendance has increased by several million people over the course of the last decade-plus, so the vast majority of days in 2023 will be more crowded than their counterparts in 2015 or 2017.
With that out of the way, let’s dig into the data and look at Walt Disney World wait times. As always, all graphs and stats are courtesy of Thrill-Data.com:
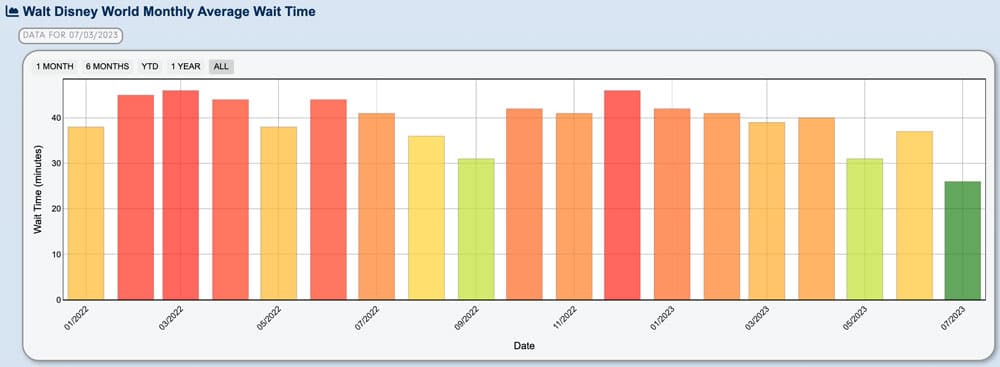
Let’s start with the monthly numbers for Walt Disney World as a whole (but ignoring July 2023 for now). Your perspective on these numbers might depend upon the narrative you want to believe or advance. (“There are three kinds of lies: lies, damned lies, and statistics.” Nevertheless, I’m partial to stats!)
If you want to contest the notion that Walt Disney World crowds were in a death spiral and that May was the beginning of the end, June certainly refutes that. The average wait time was up 6 minutes to 37 minutes, for a typical crowd level of 3/10 over the course of the entire month, as opposed to 1/10 in May. Crowds were observably and undeniably higher than in May. Based on what we saw on the ground, I don’t think there’s any debating that.
However, I’m personally more interested in prior-year comparisons. There’s also an undeniable ebb and flow to attendance; not all months are equally busy. So contrasting wait times data with the same month last year is much more meaningful than comparing May to June. Obviously June was going to be busier. It almost always is.
When looking at prior-year numbers, this June was 7 minutes lower on average, dropping from an 8/10 crowd level last June. Even more notably, every single month this year since February has been slower than its counterpart in 2022. January 2023 was the last month that was busier than last year (significantly so, although at least part of that comes down to the timing of New Year’s Eve and winter breaks). Every month since has been slower in 2023 than last year.
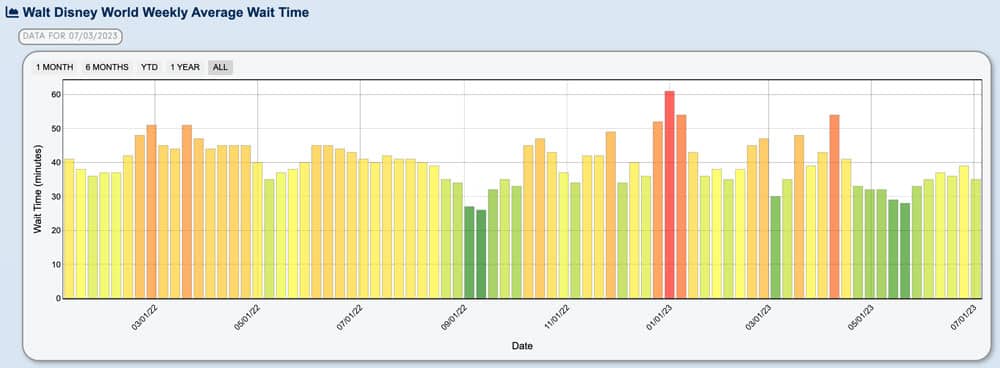
Above is a look at weekly wait times at Walt Disney World. The story here is a pretty boring one, which is that crowd levels have mostly been stagnant in the last month. There was a slight drop during the most recent week, which includes this past weekend, but even that isn’t particularly pronounced. After rising out of the doldrums of May, wait times pretty much plateaued in June.
Regardless, the last several weeks have been both objectively low and below-trend as compared with shoulder and summer seasons during the prior two years. Two weeks ago was the “busiest” week of the summer season thus far, and that was a 5/10. That’s not particularly bad for a period when most schools are out of session.
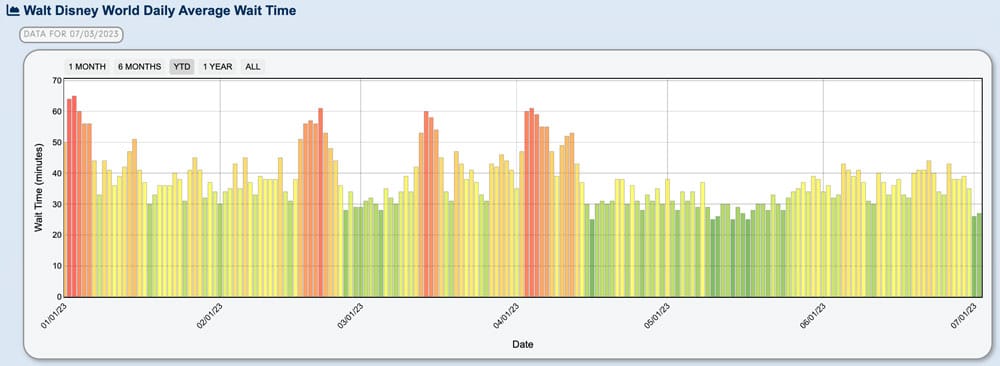
Looking at daily numbers across all of Walt Disney World year-to-date, and it’s more or less the same story as our last couple of crowd reports. There have been several 7/10 days this summer season WDW-wide, and also a handful of days when Magic Kingdom and Disney’s Hollywood Studios hit 8/10. No park has had a 9/10 or 10/10 day so far this summer, though.
These higher days have been offset by weekends, which continue to be lower across the board. See the ‘Wonky Weekends at Walt Disney World’ section of our recently updated Best & Worst Days to Do All Parks at Walt Disney World in 2023 for a discussion of this dynamic. Even without reading that post, you should be able to spot the weekends in the above graph (they’re the two lower consecutive bars each week) and draw your own conclusions.
Surprisingly, that trend not only included the first ‘half’ of the Independence Day holiday weekend, but it was heightened! We were slightly unsure of what to expect here–but we definitely did not expect Saturday and Sunday to be so slow. Without a doubt, the higher prices, hotter weather, blockouts, and various other variables pushed people away from the parks.
The end result was that this Saturday was the slowest day since May 17. Now, that may not seem particularly significant–it was only a little over a month ago–but that was the slowest day since early last September. If you don’t think that’s a red flag, I really don’t know what to tell you. Suffice to say, we should not be comparing a summer holiday weekend to the slowest days in the slowest month of the entire year!
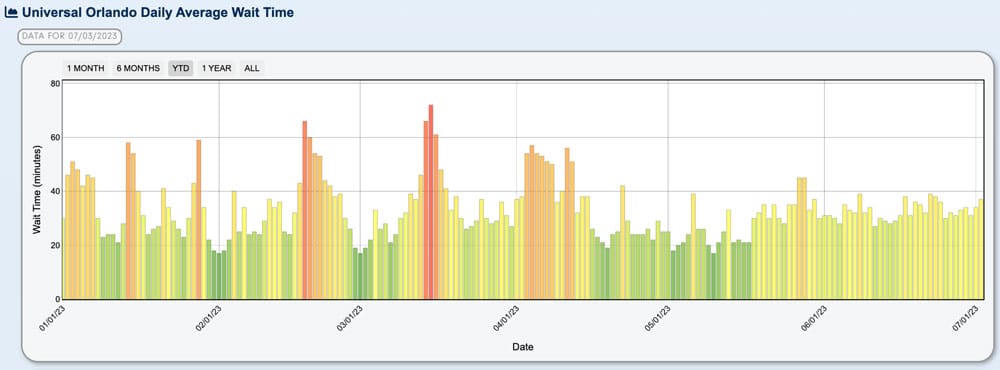
For those inclined to hand wave this away, blaming the hot weather or whatever, here’s a look at Universal Orlando’s daily wait time averages. Saturday was 5/10 and Sunday was 6/10. Now, that’s not-so-hot for a holiday weekend, but it’s still better than Walt Disney World, and should be enough to demonstrate that it wasn’t merely a matter of weather.
In general, weekday crowds are about on par between Walt Disney World and Universal Orlando. The big difference now is weekends. (Still, I’m a bit shocked by just how slow WDW was this past weekend. And that was with Disney pulling “levers” at the last-minute, releasing more reservation availability for APs and CMs!)
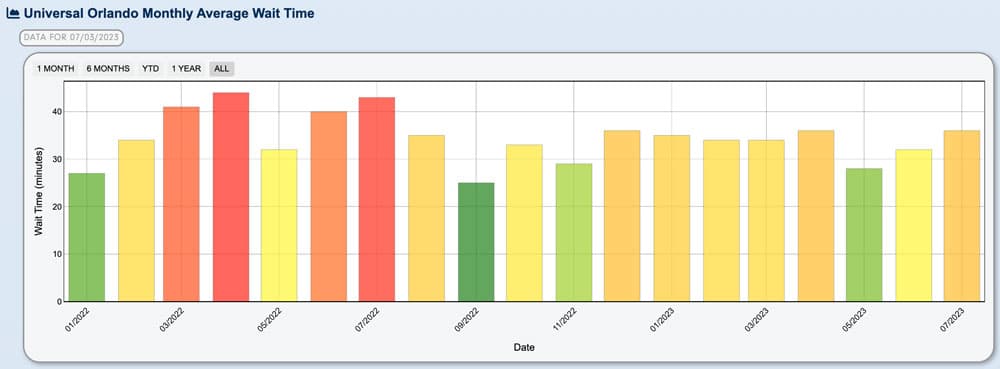
This is evident in looking at monthly average wait times for Universal Orlando. Looking at prior-year data, it’s a pretty similar story–every month following February has been lower at Universal, too.
As with Walt Disney World, this pattern is pretty much incontrovertible at this point. Universal is also busting out its discount playbook, with an increasing number of resort deals. They also just released a new Annual Pass deal: “Get 3 Months Free on Any Pass” offer. As the name suggests, this offers 15 months for the price of 12 on new APs and renewals on all of Universal Orlando’s 4 tiers of Annual Passes.
(For those visiting in mid to late August or September 2023, we’d highly recommend considering an AP for at least one member of your party. That’s AP Appreciation month, and the hotel discounts are usually insanely good.)
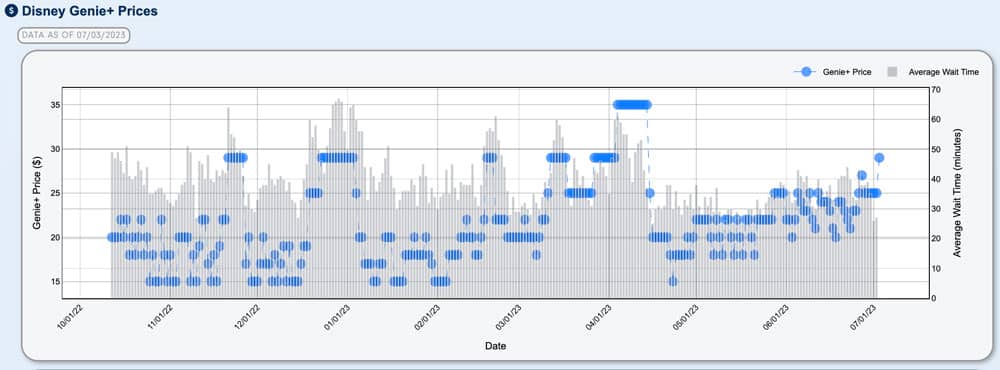
As we’ve also discussed repeatedly, there’s a growing disconnect between Genie+ prices and crowd levels. This started after Easter and the gap has only grown since. A lot of the advocates of per-park pricing for Genie+ are conveniently ignoring this trend.
I will say that I find it amusing that Walt Disney World opted to debut per-park Genie+ on a $27 day…only to drop that to $25 the very next day. Why not just wait a day and give proponents of the system a superior talking point? It’d still be a price increase in disguise, but at least the disguise would’ve been a bit better!
Speaking of which, Genie+ is back up to $29 as of today (July 3, 2023). Today’s wait time data is not included in the above reports, but the smart bet is on crowd levels being much higher. For one thing, Genie+ pricing indicates that’s what Walt Disney World is anticipating. For another, every single Monday has been busier than every Saturday and Sunday for the last couple of months. So it’s hardly a bold prediction given the circumstances.

The only question is whether the second ‘half’ of the holiday weekend can be the first day(s) of summer to break 9/10 on the crowd calendar. My guess is no. But I wouldn’t be surprised if MK and/or DHS get 7/10 days. That’s still quite the rebound after this weekend.
Magic Kingdom is now completely unavailable for the Fourth of July, so it’ll be interesting to see what “sold out” looks like in Summer 2023. I’d be willing to bet that the capacity cap is relatively low due to Park Hopping for the fireworks. That means modest crowd levels–as measured by wait times–but significantly higher ‘feels like’ crowds as a result of congestion on Main Street and elsewhere around the park.
Turning to commentary, the first month of this summer season is further proof that pent-up demand is done at Walt Disney World. Rather than steadily increasing, wait times have more or less stagnated. Then there was the surprise decline over the weekend, which might’ve been foreseeable to the extent that Saturdays and Sundays have been slower than Mondays and Tuesdays…but it shouldn’t have been this bad over a long holiday weekend.
Without a doubt, there will be busy weeks and months again later this year. It’s safe to predict that October through December will see a spike, with days and weeks that are 10/10 crowd levels. So again, Walt Disney World is hardly experiencing a death spiral, five alarm fire, or anything of that sort.
But I’d also expect most weeks and all months to be down year-over-year. That’s more meaningful than comparing May to June or September to October, etc. That’s been the case thus far this year at Walt Disney World after January, and also at Universal Orlando after February. Basically, there is a slowdown, but it’s more like a normalization to 2018-2019 numbers–perhaps a tad worse than those. (Comparing is difficult due to shorter hours, still-missing entertainment, added attractions, etc.)

As for the cause, frankly, I think it’s impossible to pinpoint just one. It’s true that the Walt Disney Company’s reputation has taken a big hit in the last two-plus years, and this could be a contributing factor. It’s also the case that guest satisfaction, consumer-unfriendly practices, and everything else that Walt Disney World has done to alienate fans and casual visitors could be coming back to bite them.
However, it’s difficult to reconcile all of this with Universal Orlando’s wait times data. If anything, it would stand to reason that Universal would be the main beneficiary of Walt Disney World’s own-goals. We’ve heard from countless disillusioned Disney (former) fans who have indicated they were taking their business to Universal. That’s not really evident in the numbers, though.
One possibility is that Universal is seeing an exhaustion of pent-up demand among locals, but not to the same degree among tourists–and that the opposite is true at Walt Disney World. This would make sense. UOR really tried to cater to locals post-reopening, whereas Walt Disney World didn’t even sell APs. Now, locals are able to buy Annual Passes at WDW; many could be doing that and taking a year off from Universal as a result. (Like everything else, this doesn’t fully explain what’s happening–but there is no single explanation that neatly does.)
![]()
You might also notice that above statement about pent-up demand being exhausted have an asterisk of “…at least at Walt Disney World.” That’s because TSA traveler statistics, Orlando International Airport data, and statements from airline CEOs all strongly suggest that travel is proving resilient, and Americans continue to spend on vacations.
Anecdotally, we spent a couple of days at the beach in Southern California this weekend. Despite the weather being bad–overcast skies and cold temperatures–everywhere was absolutely slammed. We were at the beach relatively regularly in the second half of the month, and our perception is that this year is busier than last year despite largely worse weather for the month of June.
It’s difficult to reconcile all of that with the falling year-over-year crowds at Walt Disney World. This is probably worthy of its own post, but our guess would be that consumers are continuing to travel but becoming more cost-conscious. It’s likely that a lot of people used their surplus savings for ‘big budget vacations’ last year, which meant theme parks.
This year, travel demand has remained resilient, but many of those with more money are looking internationally where they benefit from a strong dollar, and those on tighter budgets are looking to beaches, U.S. National Parks, and other cheaper destinations. (There are more wrinkles to this that are beyond the scope of this post; Airbnb average rates are down, travel to most West Coast cities is up, etc.)
That’s all just spitballing with no supporting (non-anecdotal) evidence, but I don’t know how else you explain the drops at both Walt Disney World and Universal Orlando with the increases for travel as a whole. Tourists are certainly still visiting those destinations, but probably for fewer days on average, while spending less and also doing more in Central Florida (or along the coasts) that costs less.
Turning to forward-looking crowd forecast, it’s safe to predict that this week will be busier than July 1 and 2. Really nowhere to go but up from those numbers, so that much is obvious. The question is how high crowd levels go (our guess is 5/10 to 6/10 for Monday through Friday), and what the next few weeks look like.
In a normal year, crowd levels would peak in mid-July and decline steadily after that. However, Walt Disney World hasn’t experienced a “normal” summer in several years–since 2018. Last year, the second week of June ended up being the peak, which was due to rising oil/gas prices.
Before that, the resumption of normalcy followed by the COVID-comeback threw a monkey wrench into late summer crowds. Then there was the closure in 2020 and the pre-Star Wars slump in 2019. Almost all of those variables, with the possible exception of gas prices and the broader economy, will be nonfactors in Summer 2023 at Walt Disney World.
![]()
Given how many years it’s been since Walt Disney World has had an average summer, predicting the peak on the 2023 Walt Disney World crowd calendar for this summer is honestly more of a guessing game than anything else. When closely analyzing wait time data for the last few weeks, one could conclude that the peak already happened–on June 22, to be precise.
I’m going to go against the grain and predict that the peak has not yet occurred. Instead, that it’ll happen next week, but with crowd levels still only in 6/10 range. My thought process with that is that this year has been largely normal, with a return to 2018 trends. Additionally, it takes a while for discounts and other incentives to become evident in increased attendance, so those 4-park tickets and all of the big resort deals are only now starting to be felt.
With that said, a peak of 6/10 or so for the summer season is still below average and indicative of a slowdown at Walt Disney World. From there, crowd levels will gradually decline in late July and into early August before schools go back into session. What happens in the off-season is anyone’s guess. Early fall is always some degree of slow, but it’s possible all of the discounts could buoy bookings and numbers enough that wait times aren’t down (or at least aren’t down significantly) year-over-year. Regardless, those two months will be objectively slow and subjectively hot. They always are.
Planning a Walt Disney World trip? Learn about hotels on our Walt Disney World Hotels Reviews page. For where to eat, read our Walt Disney World Restaurant Reviews. To save money on tickets or determine which type to buy, read our Tips for Saving Money on Walt Disney World Tickets post. Our What to Pack for Disney Trips post takes a unique look at clever items to take. For what to do and when to do it, our Walt Disney World Ride Guides will help. For comprehensive advice, the best place to start is our Walt Disney World Trip Planning Guide for everything you need to know!
YOUR THOUGHTS
Thoughts on crowds in June 2023 or the first half of the Independence Day holiday weekend? Predictions on crowds for July, remainder of summer season, or August and September? If you’ve visited last month (or especially this past weekend), what did you think of crowds and wait times? Any parks or times of day noticeably worse than the others? Do you agree or disagree with anything in our report? Any questions we can help you answer? Hearing your feedback–even when you disagree with us–is both interesting to us and helpful to other readers, so please share your thoughts below in the comments!


Our family has gone from being “Disney Freaks” and visiting every two years to just not going at all. We haven’t been in years and don’t plan on going anytime soon. This transformation has occurred for several reasons.
1. Disney’s transition away from traditional family values and movement away from a focus on its traditional audience.
2. Disney’s lack of respect for nostalgic feelings many people have for Disney rides and traditions. I’ve been going to Disney World since 1975. Part of what I have enjoyed is being able to ride the same rides I rode as a child and enjoying those same rides with my kids. Removing the original Dumbo ride, removing the Great Movie Ride, changing the name and theme of Splash Mountain removes the connection that Disney was to our childhood and is turning Disney into just another generic amusement park. Or changing the announcement “Ladies, and gentlemen, boys and girls” or doing away with the spectromagic parade, or Epcots end of day show, etc.
3. Disney constantly trying to squeeze more money out of us but at the same time replace perks like fast passes with a lesser system.
Or, finding new ways to charge us for things that have been free in the past.
Finally, we’re tired of Disney being political and taking positions, or getting involved, in issues it really has no business getting involved in.
So sad……Disneyworld has been our very favorite vacation spot for over 30 years! But when visiting in April, it was so disappointing! For all the same reasons everyone is talking about in these posts. The Disney magic is gone, all about the almighty $$$$! Breaks my heart. Renting a house on the beach in NC this year!
We’ve been wanting to take our nieces and nephews to WDW for a few years. And then COVID. That of course is not on Disney. Bur prices are a different subject entirely. To maximize on the increase in demand, Disney raised, already high ticket prices to a new level. Why, because they could. (See “Disney is raising prices, but this time, don’t blame inflation.” Aug. 11, 2022, https://www.cnbc.com/2022/08/11/disney-is-raising-prices-but-this-time-dont-blame-inflation.html) Add to that all the added expenses and you’re looking at a substantial investment for a “vacation.” Even worse for my wife and myself, both early 60’s, is that the current system of park and ride reservations, advanced planning required and other factors, spontaneity is, if not outright gone, at least severely curtailed. We love to park hope to eat at different countries in Epcot, even while spending most of our time just walking around the MK. In talking to co-workers that seems to be a thing of the past. In short, it looks like the days of wondering around the ENTIRE complex and just relaxing, do-as-you-please are gone. What with Genie+ and the products, many of which come at an additional costs, WDW right now is just not an option for someone who has been going there since 1973. It’s sad, but that is where the corporation has led the company. At least for now.
I think a major factor is the cost v value of said cost. Disney pushed too far, and it’s now coming back to bite them. It is an outrageously expensive vacation especially when you tack on airfare and, now with the loss of MDE begins the added and/or increased costs of a WDW trip in 2023, transportation to/from the airport. Tickets are pricy enough, but when there are still restrictions like park reservations and 2pm park hopping, it makes the cost feel even worse. Add in that fast pass is gone and replaced with an upcharge, the weight of cost over value gets worse. Only half an hour early entry in the morning, and only one late night at Epcot or MK each week. AK has nothing to see at night and is barely even open into the “night” despite having a land that literally shines when it gets dark. On top of that, the food, drink, add on prices that were already marked up have continuously been bumped higher and higher.
We had been putting off a trip, waiting for rezzies to be dropped and return to normal park hopping. But we were lucky enough to book the Starcruiser and jumped. Of course, then it made sense to just do the whole trip now. Even removing the cost of that, the cost of the rest of the trip is utterly absurd, and that is before we’ve had to eat and gotten the kids some souvenirs. We live a very comfortable life and enjoy regular travel. What we could do for the same amount of money? That is why people are choosing things like the beach, national parks, and smaller, regional amusement parks. You can take a wonderful trip, make great memories, not deal with the rigamarole of a Disney vacation, all for less than half the cost.
As a reader of this blog for 10 years I’m happy to see an article addressing the issues facing Disney. I can no longer turn a blind eye to this death by a thousand cuts. It’s obvious the golden era is over. Tom I think you should do more universal stuff and change the name to theme park tourist blog to appeal to a larger audience.
I would echo this and add that I would also appreciate greater coverage of Disneyland, which I think continues to appeal to travelers who are looking for a simpler theme park destination with more affordable lodging options and other things to do nearby.
Personally, our family will not be returning to WDW even though our kids (boys ages 8 and 10) are at the perfect ages for it and are obsessed with Star Wars. We would consider a DL trip, though, in combination with a few days on the beach or another destination like San Diego.
I think the main things that put me off as an international visitor from UK are – 1/ The boarding groups and genie plus thing, it is just too fiddly and faffy, Universal has a much better system (in my mind). 2/ The slow pace of development at Disney, we didn’t want to return with the big dirt pit in epcot and were kind of waiting until that finished and just gave up, now our eyes are on epic universe and we will visit maybe in 2026, not bothering with disney. 3/ I was always a big fan of the highly themed slower omnimover dark rides at Disney, but everything seems to be moving more towards roller coasters now (I woulnd’t be surprised if spaceship earth doesn’t eventually become an indoor rollercoaster). But we can get rollercoaster in abundance back here in the UK. I guess that’s what most people want now though, hence why they are going that way.
Excellent points!
In no particular order:
1. People tired of being gouged with less value.
2. People discovering there is life outside of Disney vacations and have found new places to travel for a lot less and considerable value in return.
3. The war in Florida has turned off many.
4. Recession knocking at our doors.
5. The post covid Disney demand is coming back to reality.
6. Foreign travelers are put off with the constant gun play in America and are going elsewhere.
Took family last October to WDW and it was a very “un-magical” trip. Stayed at Port Orleans which was nice but with Bob Paycheck removing all the magic and the crowds were beyond packed. Its hard to schedule next trip. My kids are now older so missing too much school is bad so limits when we can go and I’m just too nervous of the parks being excessively crowded. I’m not boycotting disney, I am just gun shy of going to florida as I envision the same problems and maybe more. Might look at 2024 if disney dining plan comes back and park attendance keeps declining.
My family and I were visiting all 4 parks from June 28th to July 3rd. The crowds were much lower than we expected and were definitely lower than our previous visits in November of 2015 and November 2019. We were expecting major lines for rides given no FastPass but with minor exceptions had minimal waits for rides using stand by. This of course excludes Tron and Guardians rides.
I live in a solidly blue state. People here do not want to visit Florida to spend their money. It has nothing to do specifically with Disney v DeSantis; it is just DeSantis. If folks from blue states shy away from Florida, all of the Orlando theme parks experience the result.
This is not true based on overall Florida tourism numbers. They broke another record this year.
https://www.fox13news.com/news/florida-reports-record-tourism-numbers-ahead-of-busy-summer-travel-season
people ignore data and facts when they don’t fit what they want to believe. Human nature. It’s very hard to reason with emotionally based conclusions.