
No Rising Tide: Disney World Attendance Drops Slightly as Universal Epic Universe Gets Off to Slow Start

The Themed Entertainment Association released its annual attendance report for 2025, which reveals a modest dip for Walt Disney World and big gain for Universal Orlando as a whole thanks to Epic Universe adding millions of new guests to the mix. This looks at the winners & losers as the recovery to 2019 levels continues, with commentary about changes and why there’s more to the story than the headline increases and decreases.
For starters, the 2025 Global Attractions Attendance Report is a collaboration of the Themed Entertainment Association (TEA) and the economics practice at AECOM. Top worldwide theme parks, amusement parks, water parks, museums, and theme park operators are named, ranked by attendance, and industry trends are identified.
The Global Attractions Attendance Report is considered the gold standard within the theme park industry. The Walt Disney Company views the Global Attractions Attendance Report as credible and accurate, and has cited it in the past as a source for data. The numbers for all Disney parks should be right on the money, and we assume the same is true for Universal and all of the other major players.
Nevertheless, the TEA attendance report does come with asterisks. Universal Orlando and Walt Disney World do not release attendance statistics as part of their earnings or annual reporting. There’s a whole ‘methodology’ section starting on page 76 of the report, which states:
“Our researchers derive the figures used to create the TEA Global Experience Index through a variety of sources, including statistics furnished directly by the operators, historical numbers, financial reports, local tourism organizations, national and international attraction associations, mobile location analytics and professional estimates where necessary.”
The following page goes on to explain in the FAQ why most theme park operators voluntarily provide statistics to TEA, and addresses skepticism about inflating or otherwise manipulating statistics. There has long been fan cynicism about both Universal Orlando and Walt Disney World doing precisely this over the years.

However, we doubt that’s happening here for numerous reasons (also explained on pages 77-78). The report points out that misreporting or over-reporting creates problems for the operators in both the long and short term:
“There is also a strong incentive for operators to report responsibly. While an inflated attendance figure might improve a property’s ranking in the short term, maintaining numbers that are inconsistent with broader business performance becomes increasingly difficult and can create challenges related to investment decisions, transactions, financing, and long-term market credibility.”
TEA makes the case in the value of accurate statistics for the health of the industry, and we believe this to be a persuasive and compelling one. They also point out that the themed entertainment industry is “highly interconnected,” with a lot of the same people working across organizations and markets, with creates additional layers of industry knowledge and perspective.
As for an incentive for accuracy, anyone who listens to Disney earnings calls knows that the key metric with which the company is outright obsessed is per capita or guesting spending. That matters much more to Wall Street than attendance, hence Disney’s past infamous statement about an “unfavorable attendance mix.” You know what decreases per capita spending? Lying about higher attendance!
The revenue is what it is. So if Walt Disney World were to claim higher attendance than the parks are actually seeing, it would decrease per caps. If anything, Disney and Universal are actually incentivized to underreport–not overreport–attendance. Disney’s dream scenario is achieving record-setting revenue with a few thousand guests per day and everyone making it rain on VIP Tours and Lightning Lane Premier Pass.
It’s the fan perspective that is fixated on crowd levels and attendance. Those numbers matter to the companies for the sake of the long-term health of the businesses, guest satisfaction, etc. But they have other metrics that matter more, and their focus on those adds credibility to this report, as opposed to calling it into question.
With that preface out of the way, here’s a look at the Top 25 Theme Parks Worldwide:
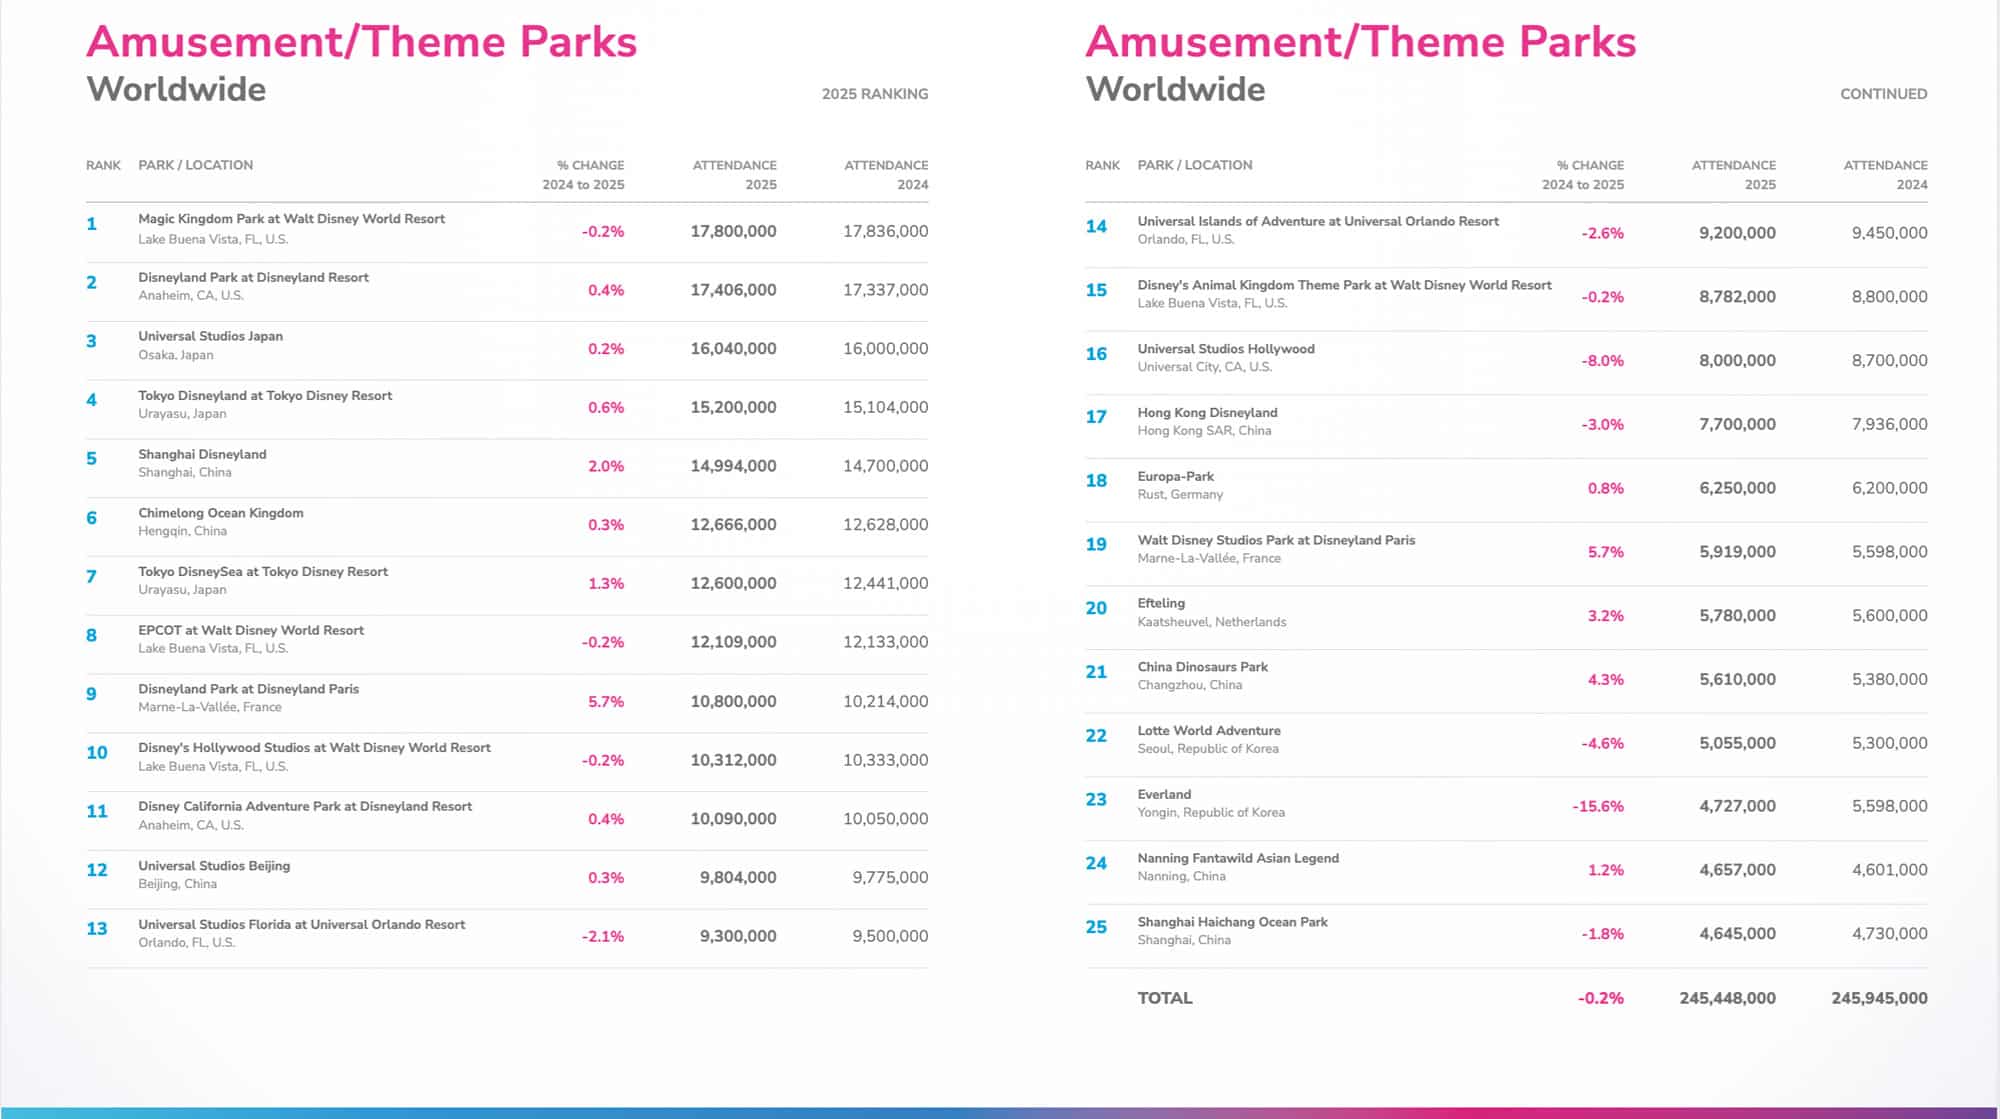
Here are the numbers for just the domestic Disney & Universal parks, with their worldwide rankings, overall attendance, and year-over-year growth:
- #1. Magic Kingdom: 17.8 million (down 0.2%)
- #2. Disneyland: 17.4 million (up 0.4%)
- #8. EPCOT: 12.1 million (down 0.2%)
- #10. Disney’s Hollywood Studios: 10.3 million (down 0.2%)
- #11. Disney California Adventure: 10.1 million (up 0.4%)
- #13. Universal Studios Florida: 9.3 million (down 2.1%)
- #14. Universal Islands of Adventure: 9.2 million (down 2.6%)
- #15. Disney’s Animal Kingdom: 8.8 million (down 0.2%)
- #16. Universal Studios Hollywood: 8 million (down 8.0%)
- N/A. Universal Epic Universe: 4 million (New)
In 2025, total attendance at the world’s leading theme parks was essentially flat. The top 25 parks welcomed a combined 245.4 million visits compared with 245.9 million for the same parks in 2024 (-0.2%).
Disney Experiences continued to lead the world’s top park operators in 2025, drawing 146.8 million guests, a 1.1% increase from 145.2 million in 2024, followed by Fantawild Group at 85 million. The most notable change came in third place, where Universal Destinations & Experiences overtook Merlin Entertainments with 62.1 million visitors.
Universal grew 5.4%, the largest gain of any operator in the top 10, reflecting the opening of Epic Universe. Six Flags Entertainment Corporation held fifth place with 47.4 million visitors in its first full year following its merger with Cedar Fair, despite a 5.8% decrease in attendance. In fact, every operator in the top 5 aside from Disney and Universal saw their numbers decrease.
For reference, here’s a look back at least year’s TEA stats for just the domestic parks:

Turning to analysis, my immediate reaction is that this casts doubt on the “rising tide” thesis. All four parks at Walt Disney World were down 0.2%, which actually is not bad at all in light of new competition entering the marketplace. But Epic Universe also didn’t give Walt Disney World a boost, as the company intimated it would on multiple pre-opening earnings calls last year.
This isn’t a surprise. During its second quarter earnings call in May 2026, we noted a shift from Disney. The company’s CFO indicated that Walt Disney World would start improving as it lapped prior quarters last year that were adversely impacted by Epic Universe, suggesting that the opening of that park was a minor negative for Q2 and maybe Q3 of 2025.
At the same time that the “rising tides” thesis was not accurate, neither were the doom and gloom claims. As should be painfully obvious by now, Universal is not going to eat Disney’s lunch and Epic Universe isn’t hurting Walt Disney World. Epic Universe is a great theme park that will be a formidable force over time. But right now, it’s still scaling up and won’t be at full capacity until 2027. Comcast’s recent earnings calls have touched on problems with capacity and reliability that we’ve been discussing for a while (see Why You Should Skip Epic Universe Until 2026).

As for the park by park attendance numbers, Magic Kingdom remained top dog of theme parks—not just #1 at Walt Disney World, but in the entire world, despite a 0.2% decrease. Magic Kingdom is still down as compared to 2019, when the park reached a staggering 20.96 million guests. That remains the high water mark for attendance, and it probably won’t be reached again until the Piston Peak Cars Land opens in 2029.
At the other end of the spectrum, Animal Kingdom continues to underperform as the #4 park at Walt Disney World with 8.8 million guests. That’s down considerably from the 13.9 million guests it hit in 2019. Disney waited too long to expand post-Pandora, and that the only thing announced thus far is Tropical Americas.
The new Encanto and Indiana Jones attractions will give DAK a boost, but they’re no Pandora. I’d expect even weaker results for Animal Kingdom in 2026 and even 2027, but then again, I expected those to be evident in the 2024-2025 attendance figures. If anything, Walt Disney World has done a really impressive job at holding Animal Kingdom largely flat over the last two years.
Assuming Indiana Jones and the Myth of the Jade Serpent debuts in late 2027 and the Encanto attraction debuts in Spring 2028, then the year of big growth for Animal Kingdom should be 2028.

EPCOT is once again in the #2 spot of Walt Disney World parks, having passed Disney’s Hollywood Studios in 2023 when it had a sizable 19.8% attendance increase to be the #1 growing domestic Disney park. That is once again the case for 2024, albeit with the same 0.2% drop observed at all four Walt Disney World parks.
Those 4-Park Magic Tickets have really worked some, ahem, magic at getting guests to visit not just Magic Kingdom and Disney’s Hollywood Studios, but also EPCOT and Animal Kingdom. These have clearly worked wonders, and it’s no surprise to see Walt Disney World introduce 2-park and 3-park variants.
In fact, the argument could easily be made that Walt Disney World has done a better job of compelling guests to visit all of its parks than did Universal Orlando last year, despite very heavy-handed policies “encouraging” guests to do more than just Epic Universe.

Meanwhile, both parks at Disneyland Resort saw modest growth of 0.4%. This isn’t the least bit surprising given wait times data and our anecdotal observations last year. We expect that trend accelerated in the first half of 2026 thanks to aggressive ticket deals, but has slowed tremendously since.
All of this also comports with what former Disney CEO Bob Iger and CFO Hugh Johnston said on multiple earnings calls for 2025. During the last fiscal year (not calendar year), Disney’s 10-K revealed that attendance was down 1% year over year at the domestic theme parks. There’s no breakdown between Walt Disney World and Disneyland, but we assume the drop was disproportionately in Florida.
The discrepancy that likely explains why TEA has stronger numbers for Disney than the company does for itself is Hurricanes Helene and Milton at the beginning of the 2025 fiscal year (but 2024 calendar year), the latter of which caused the parks to close and had a long tail of lower crowds due to cancellations in the weeks afterwards. If shifting past that, it’s easy to see how Disney was essentially flat across its domestic parks in the 2025 calendar year.

As noted above, attendance is down pretty much across the board as compared to the 2019 report. EPCOT and Disney’s Hollywood Studios are the two parks that come the closest, but it does not seem like either will surpass those high water marks anytime soon.
That’s especially likely without any major additions until 2028 for Disney’s Hollywood Studios and 2029 or 2030 for EPCOT. That’s when we’re expecting the reimagined Journey Into Imagination with Figment and Dreamfinder to come online, at which point EPCOT will record 19.83 million annual visitors and overtake Magic Kingdom for #1 in the world. Expect Figment and Dreamfinder to go global following that, with new Journey Into Imagination attractions greenlit for every Disney destination on earth, from Disney Adventure World to anchoring the new Tokyo DisneySky. (If you can dream/imagine it, you can do it!)
Walt Disney World seems to be okay with not hitting the 2019 high water mark for attendance. At least, for the most part. As we noted above, per guest spending is the company’s key metric and they’ve achieved enviable results there. They’ve also improved occupancy numbers at the resorts, which are running close to all-time highs and help bolster those per guest spending metrics since overnight stays are not cheap!

Walt Disney World did achieve quasi-2019 results at its water parks, fueled by the free arrival day perk for the duration of 2025. As a result of that freebie, Blizzard Beach posted monster growth, drawing 1.35 million guests in 2025, up 50.5% from 897,000 in 2024. That jump placed Blizzard Beach at #13 on the global list.
Disney’s Typhoon Lagoon remained the most visited water park in North America at about 1.76 million guests, down 3%. Universal’s Volcano Bay followed with 1.6 million, also down 3%. The top 4 water parks in North America are all in Central Florida, with Aquatica Orlando rounding things out. Volcano Bay is likely to be down double-digits in 2026, as the water park just closed for a multi-month refurbishment on October 26, 2026, and isn’t scheduled to reopen until April 1, 2027.
In addition to the free water park visits for on-site guests, Walt Disney World made the relatively last-minute decision to open both water parks for Summer 2025 (roughly Memorial Day to Labor Day), for the first time since 2019. They repeated that in 2026 and will again in 2027, but the difference both years is that the free water park perk narrows to just the summer months, too. That could cause both Blizzard Beach and Typhoon Lagoon to recede slightly.

Then there’s Universal Orlando, which had a mixed performance. Universal Studios Florida was down 2.1% and Islands of Adventure declined 2.6%, as Epic Universe added 4 million new guests to the mix. Historically, new gates have come at the short term expense of existing ones, so this was expected. Meanwhile, it was another rough year for Universal Studios Hollywood, with an 8% decrease.
Universal’s North American parks also all lost attendance in 2024, with Universal Studios Florida dropping more than 2.5% and Islands of Adventure down 5.5%. Universal Orlando saw an even bigger decrease in 2023, when Islands of Adventure was down 9.3% to 10 million guests while Universal Studios Florida also fell 9.3% to 9.75 million guests.
The last couple of years have also been rough for Universal Studios Hollywood, which decreased nearly 10% in 2024. The last of these has seen a steep decline as it lapped Super Nintendo World, which is the primary explanation for that decline. That, and nothing new since. The Fast & Furious: Hollywood Drift roller coaster debuted in late Summer 2026, so that should finally start to turn things around in next year’s report.

It’s nevertheless slightly interesting to see these declines for Universal Studios Florida and Islands of Adventure given Universal Orlando’s aggressive strategy that largely bundled Epic Universe access into multi-day packages that “force” guests to visit the legacy parks. They also did not offer Annual Passes (and still don’t) for Epic Universe, pushing locals towards the existing gates.
Across the board, total visits are obviously up. That’s what happens when going from 2 parks to 3 parks. Universal didn’t drop $7 billion for stagnation’s sake. Some of that did come at the expense of the legacy gates, but overall cannibalization was relatively modest.
The real question, and one we’ve been asking repeatedly over the last year-plus, is whether Comcast is satisfied with the first year performance of Epic Universe. Outwardly, they claimed to be over the first few quarters, but the most recent earnings call started to show cracks in the veneer. That ongoing story will be interesting to watch; hopefully the park can recover from its relatively slow start.
This is precisely why Universal has been talking about aggressive expansion plans at all three of its Orlando theme parks. See Universal Orlando Has Only Announced One New Ride, But is Quietly Working on 5 Additional Attractions. Universal needs to move fast on these expansion plans, and it appears they are.
Even so, it’s unlikely there’s anything major debuting at Universal Orlando in 2027 aside from Fast & Furious: Hollywood Drift at Universal Studios Florida. They really need indoor capacity ASAP at Epic Universe, and the Lost Replacement concept at IoA cannot come soon enough.

We expected numbers like this for Universal Orlando in 2025. Here’s exactly what we predicted back in October 2025:
Without question, Epic Universe will be the lowest-attended Universal or Disney theme park in 2025. That’ll be true simply by virtue of it not operating a full year. It’ll be very difficult for it to exceed the 5.7 million guests it’d need to surpass the Walt Disney Studios Park.
Honestly, I’d be very surprised if Epic Universe eclipses 5 million guests in 2025. A more realistic number is probably around 4.5 million guests, which would come pretty close to tracking with leaked ticket sales data before that was cut off (while also assuming growth for October through December). That’s a robust inaugural year number. Anything below 4 million would be a disappointment.
I don’t have any bold predictions for Islands of Adventure or Universal Studios Florida. Comcast hasn’t said much about those parks in their earnings calls. The bundled ticket strategy has maintained a floor under them. There still aren’t APs for Epic Universe, which keeps locals visiting the legacy gates. But on the other hand, there was absolutely nothing new. I’d bet on very modest decreases–roughly 1% to 3% for both parks.
The worse numbers for Islands of Adventure and Universal Studios Florida will probably come in 2026 thanks to ticketing rules being relaxed for Epic Universe. Next year is when cannibalization will be felt in full force, especially if there’s nothing new to entice guests to visit USF and IoA.
With the actual data, Epic Universe comes in at the lower end of the spectrum, which also isn’t surprising given the ride reliability and daily downtime issues, which have resulted in throttled capacity. Things appear to be getting better, but Epic Universe still isn’t a park capable of serving 10 million satisfied guests per year.

I’ll once again double-down on the 2026 numbers being rough for Islands of Adventure and Universal Studios Florida. Part of that is the relaxed ticket rules and another part is that nothing new has opened in a while at these gates. However, the strongest signal is recent Comcast earnings calls, which have been a bit brutal.
Honestly, it’s easy to see why guests are staying away, as both of the legacy parks have areas that are in rough shape and are badly need new attractions and placemaking projects. Part of me wonders whether Comcast regrets building a third gate as opposed to just fixing the ones it already has.
That $7 million could’ve basically reinvented USF and IoA, adding blockbuster Nintendo lands to both. It clearly worked for Universal Studios Japan, the #3 most-attended theme park in the world and Universal’s best performer with nearly 7 million more guests than Universal Studios Florida.
The good news is that success for theme parks is pretty simple: if you build it, they will come.
Time and time again, the TEA numbers have borne this out. Animal Kingdom saw a similar explosion post-Pandora, while Star Wars: Galaxy’s Edge and Toy Story Land were big for Disney’s Hollywood Studios. Last year’s numbers for EPCOT tell a similar story, with the park finally benefitting from Cosmic Rewind and the additions that came before it. Meanwhile, Magic Kingdom saw a modest boost from TRON Lightcycle Run.
Equally as important, the TEA report shows the opposite: when parks go too long between opening new attractions, their attendance suffers. If you want one “narrative” to take away from these attendance statistics, that should be it! For one thing, it’s true. For another, it’s the narrative that benefits us all and puts us all on the same “side” rather than the endless Universal vs. Disney discourse that makes us all sound like weird cultists.
Most importantly, it’s the perspective that encourages theme parks to invest more money into expansion and opening new attractions. We’re now seeing this play out in both California and Central Florida as Universal and Disney invest billions upon billions of dollars to attract new visitors. Regardless of which side “wins” or “loses” in the short term, both win in the longer term. Most importantly, fans all win!
Planning a Walt Disney World trip? Learn about hotels on our Walt Disney World Hotels Reviews page. For where to eat, read our Walt Disney World Restaurant Reviews. To save money on tickets or determine which type to buy, read our Tips for Saving Money on Walt Disney World Tickets post. Our What to Pack for Disney Trips post takes a unique look at clever items to take. For what to do and when to do it, our Walt Disney World Ride Guides will help. For comprehensive advice, the best place to start is our Walt Disney World Trip Planning Guide for everything you need to know!
Your Thoughts
What do you think of the TEA Global Attractions Attendance Report for 2025? Thoughts on the stats for Universal Orlando or Walt Disney World or the “rising tide” theory in light of these results? Any color commentary of your own to add? Do you agree or disagree with our assessments and forward-looking predictions? Any questions we can help you answer? Hearing your feedback—even when you disagree with us—is both interesting to us and helpful to other readers, so please share your thoughts below in the comments!





The real million dollar question is we will ever see you guys visit Europa or Efteling! Truly would love to see you guys cover these parks some day.
Also noteworthy Dollywood has significant Percentage growth and could be a sleeper on the rise of a much more affordable vacation as it debuts its first family dark ride this year