
Spring Break Crowds Have Sprung at Disney World
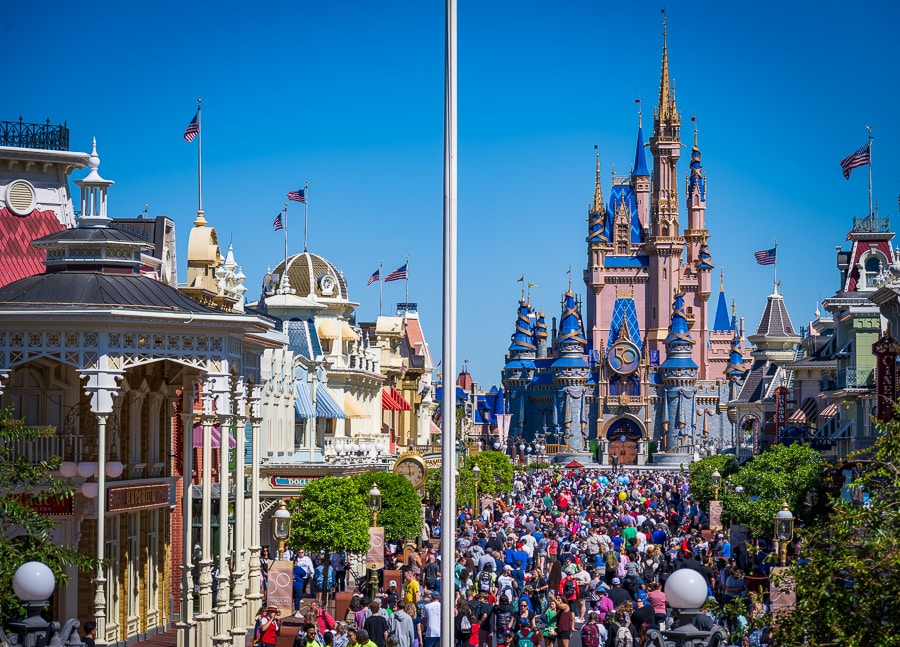
With much of Central Florida and other school districts being off last week, it is now officially Spring Break 2023 at Walt Disney World. This crowd report shares wait times data, our on-the-ground anecdotal experiences, thoughts on what’s likely to happen next with attendance levels, and more.
As covered in our crowd report for early March at Walt Disney World, this month has historically been a ‘tale of two seasons’ at Walt Disney World, with peaks and valleys–high highs and low lows. The first half of the month started out surprisingly slow, reinforcing that as one of our favorite times to visit in our Best & Worst Months to Visit Walt Disney World.
That dynamic will be even more evident as we contrast wait times from last week with those from the first week-plus of the month. With Osceola and Orange County both out of session for their spring breaks, wait times were unsurprisingly high last week. That’s not to say crowds didn’t throw us any curveballs–they did. Let’s take a look…
As always, what’s covered in these “crowd” reports is actually posted wait time data that’s pulled from My Disney Experience and compiled into graphs for tracking and comparing various days, weeks, months, and years. A lot can be gleaned from posted wait times, but it’s not necessarily conclusive of in-park congestion or crowds.
There are several other variables that impact “feels like” crowds, from the EPCOT festivals to weather to guest demographics to ride breakdowns to operational efficiency to time of day or day of the week. That’s just a partial list, and all of these were major factors in first week of the 2023 spring break season.
In short, wait times are an imperfect measure of Walt Disney World’s raw attendance or crowds–which have increased by several million people over the course of the last decade-plus. With that out of the way, let’s dig into the data and look at Walt Disney World wait times. As always, all graphs and stats are courtesy of Thrill-Data.com:
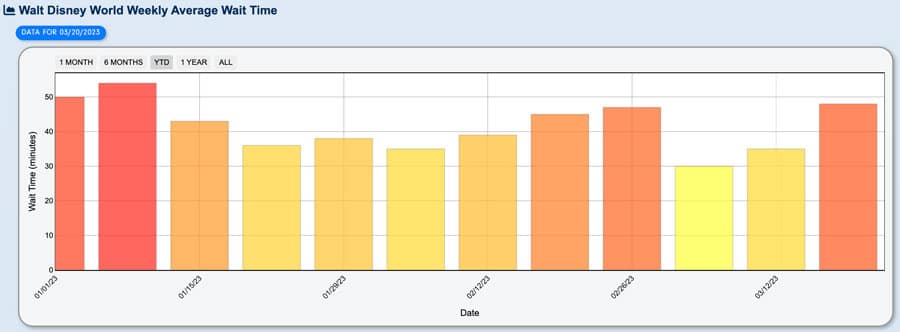
We’ll start with the weekly numbers for Walt Disney World as a whole.
The peak in early January was not New Year’s, but rather winter break and Marathon weekend. Following that, crowds mostly moderated until Presidents’ Day, before falling to their lowest levels of the year thus far in late February through the first 12 days or so of March 2023. Then spring break season arrived.
From one week to the next, crowd levels jumped from 3/10 to 9/10, with the average wait time increasing from 35 minutes to 48 minutes. With that said, this chart actually doesn’t tell the full story, as many of those weeks encompass busy and slow dates. So let’s look at the dailies…
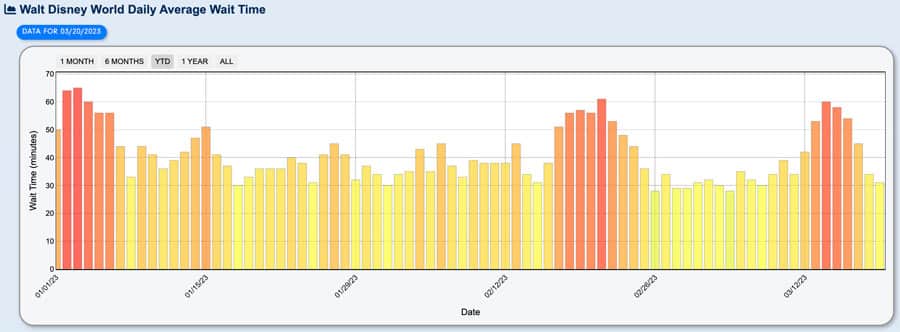
This is a bit more useful, and it shows that wait times actually started falling in the second half of Central Florida’s spring break week and into the weekend. By Sunday (March 19, 2023), wait times had bottomed out at 31 minutes on average, for a 2/10 crowd level. That’s quite the contrast to the middle of the week, when crowd levels were 10/10 and 54-60 minutes on average.
What it is not quite the contrast to is Presidents’ Day and Mardi Gras, when (literally) this exact same dynamic played out. At the time, we speculated that the Princess Half Marathon might’ve been playing a part, with runners less likely to visit the parks on the days of the big race. Now, we’re starting to wonder if a new trend is emerging. More on that in the commentary towards the end…
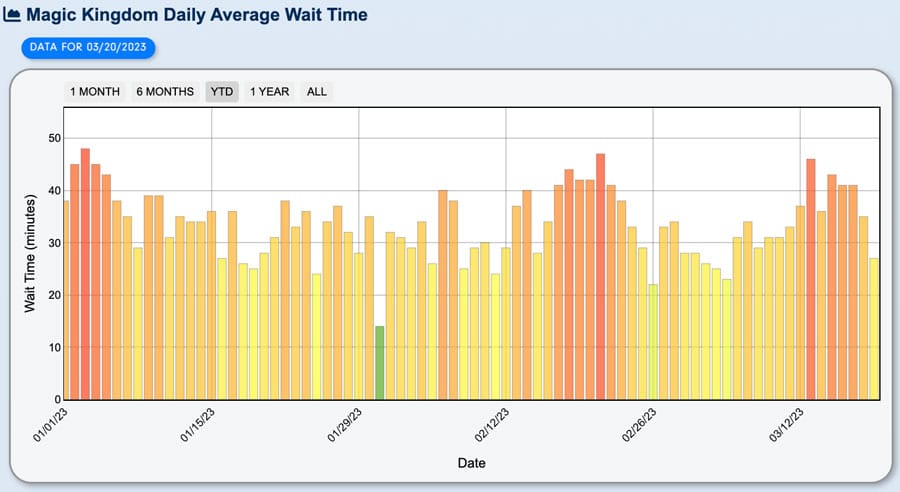
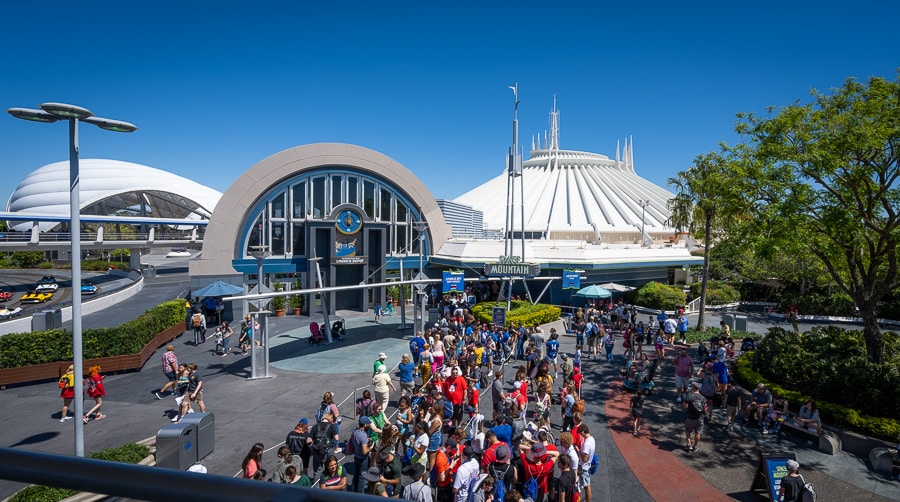
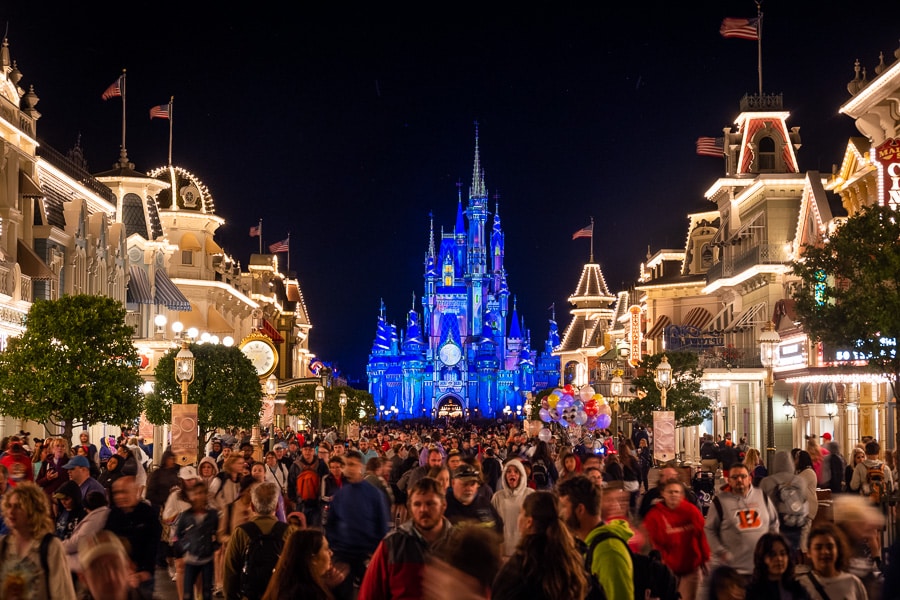
It’s mostly the same story at Magic Kingdom, which went from 9/10 or 10/10 crowd levels earlier in the week to 2/10 on Sunday. Worth noting that Tomorrowland closed early on 3/14, likely explaining the bulk of the one-day drop in the middle of the week.
I’d add that “feels like” crowds were mostly on par with these high numbers throughout the week. As with the wait times data, Saturday night into Sunday was the big exception, and that’s at least in part because “feels like” (and actual) temperatures plummeted. That alone can’t explain it all, though.
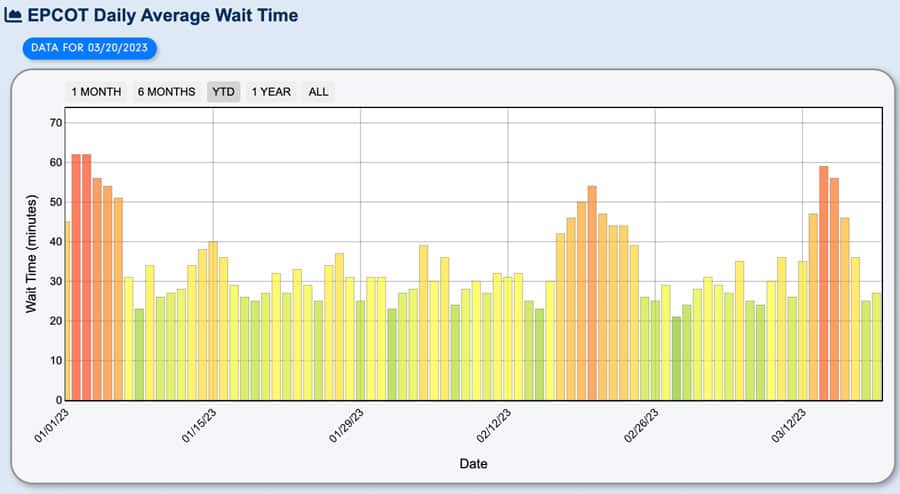
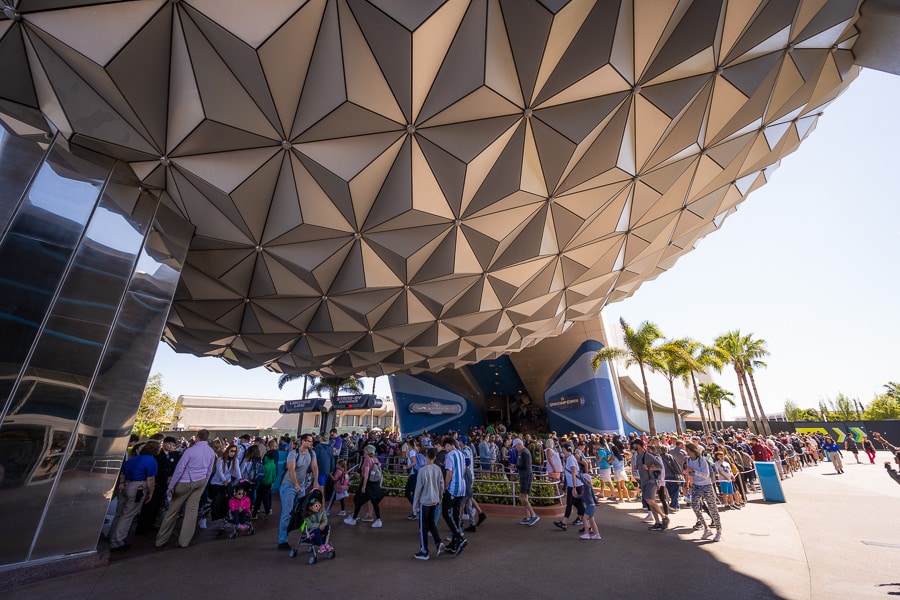
The daily data for EPCOT is particularly fascinating, with average wait times doubling and then being cut in half all in the span of a single week.
As always, EPCOT is the one park where what you see is not what you get. I was in the park for portions of a 9/10 and 10/10 day last week, also doing both Extended Evening Hours and Early Entry at EPCOT. My biggest takeaway? This isn’t so bad!
However, that was my impression based on crowds and congestion, and not wait times. While clearly busy, EPCOT did not “feel” 9/10 or 10/10 levels of busy. That’s because EPCOT is the “local’s park” at Walt Disney World, with Floridians and Annual Passholders tending to do the park differently than tourists. (Meaning more wandering, and fewer attractions.) Many of the “wanderers” were blocked out last week, resulting in a lot less congestion–but higher wait times.
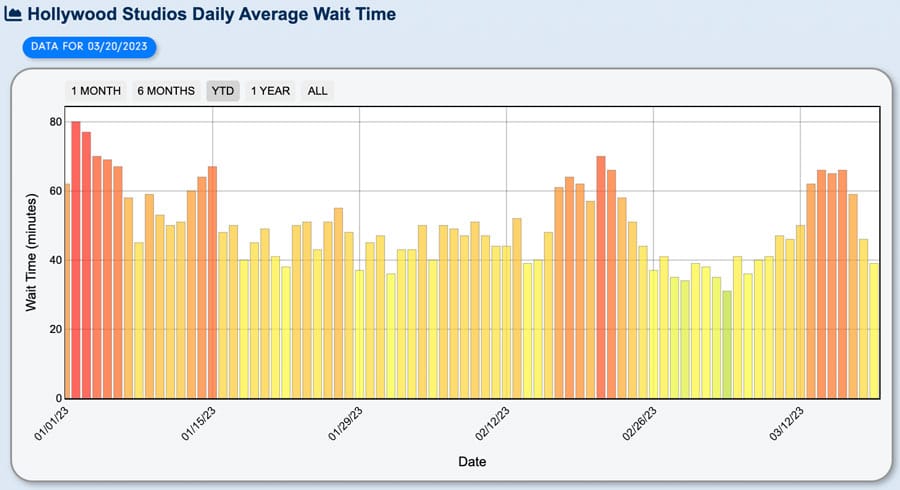
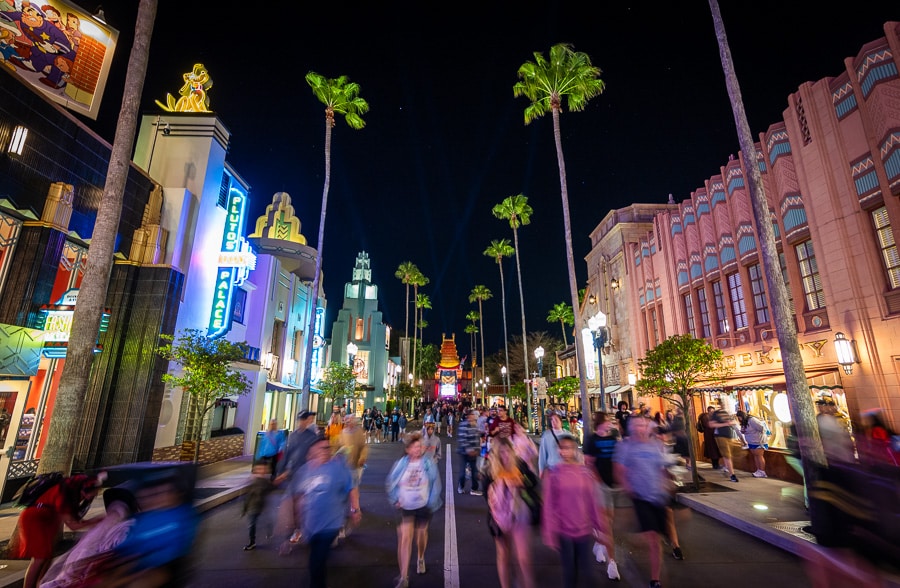
As is often the case during peak tourist times, Disney’s Hollywood Studios was the worst park last week. It averaged 9/10 or 10/10 crowd levels for 5 straight days, with average wait times at or above 59 minutes each of those days. As with the other parks, DHS plummeted over the weekend.
My main takeaway with Disney’s Hollywood Studios was also this isn’t so bad! However, that was for a very different reason than EPCOT. Middle of the day, congestion and wait times were both awful at DHS. Despite that, crowds were still perfectly manageable in both the morning during Early Entry and after 6 pm. I keep expecting the latter to change, but this seems to be the new normal for DHS, even now that Fantasmic has returned. I’ll take it!
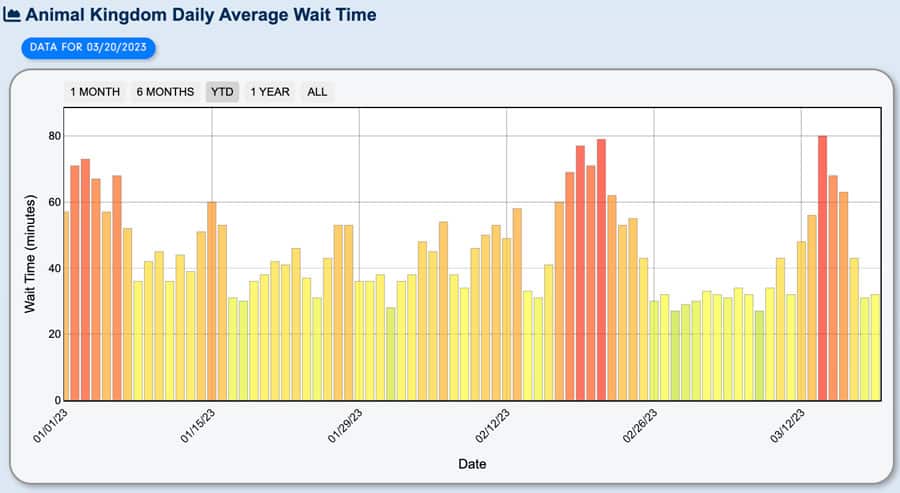
It’s a similar story at Animal Kingdom, with crowd levels surging in the middle of last week only to drop sharply over the weekend. With the fewest attractions that post wait times, Animal Kingdom is prone to the most pronounced swings in crowd levels. Colder weather over the weekend would’ve exaggerated this, as Kali River Rapids would’ve been posting a low wait time.
I spent the least time (by far) in Animal Kingdom last week. In part because it’s no longer open after dark (thanks a lot, DST!) and in part because it’s the least interesting or difficult from a crowds and strategy perspective. I was able to do every single ride in the park even on a busy day by 10 am, which actually isn’t that impressive of a feat.
Now let’s turn to the average attraction wait times for the month of March 2023 thus far:
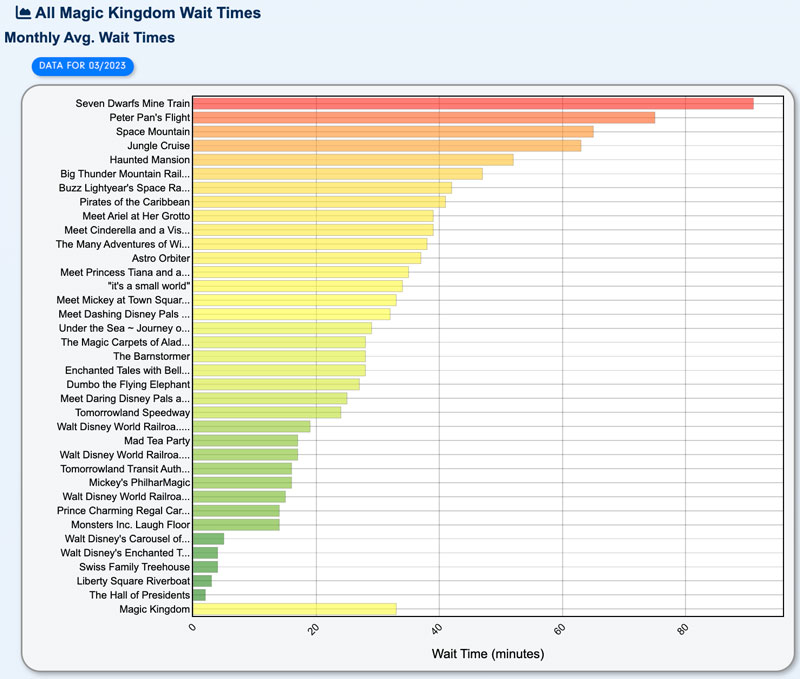
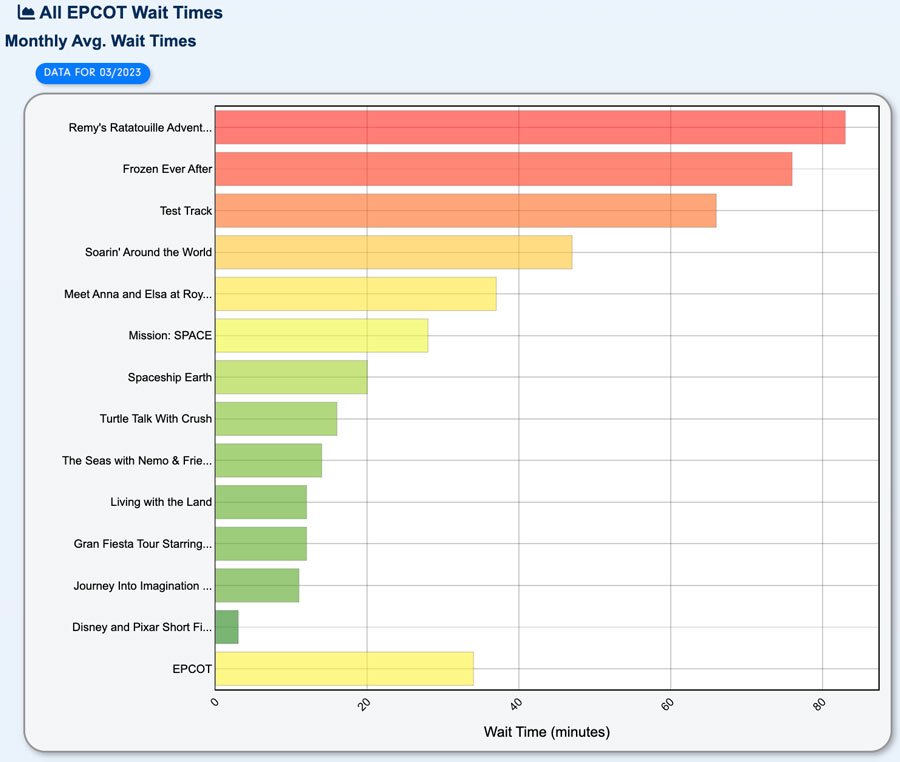
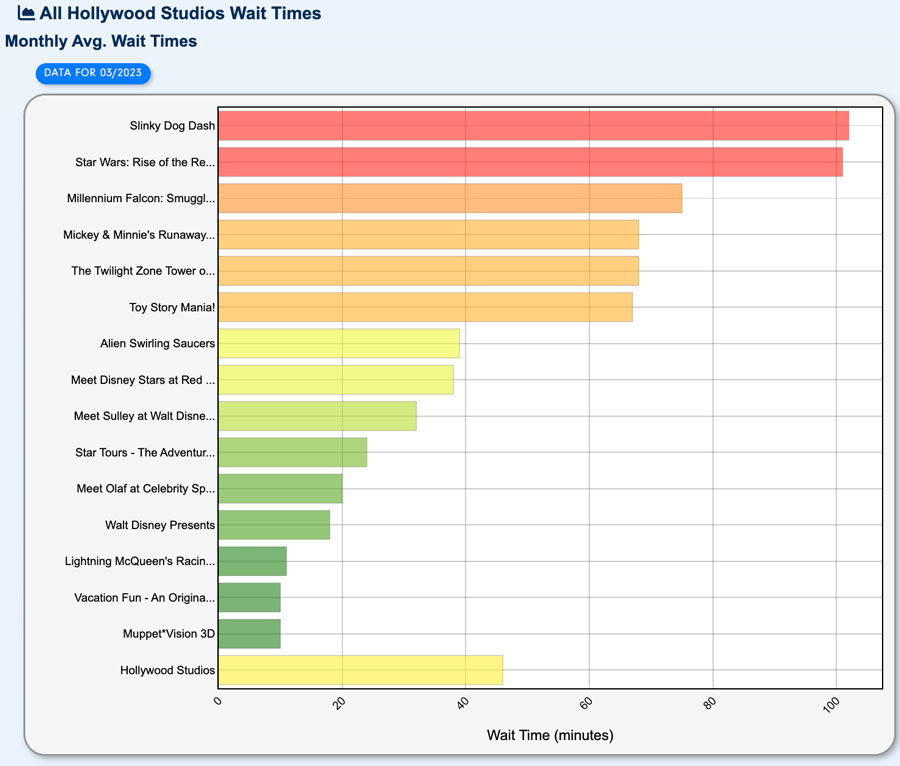
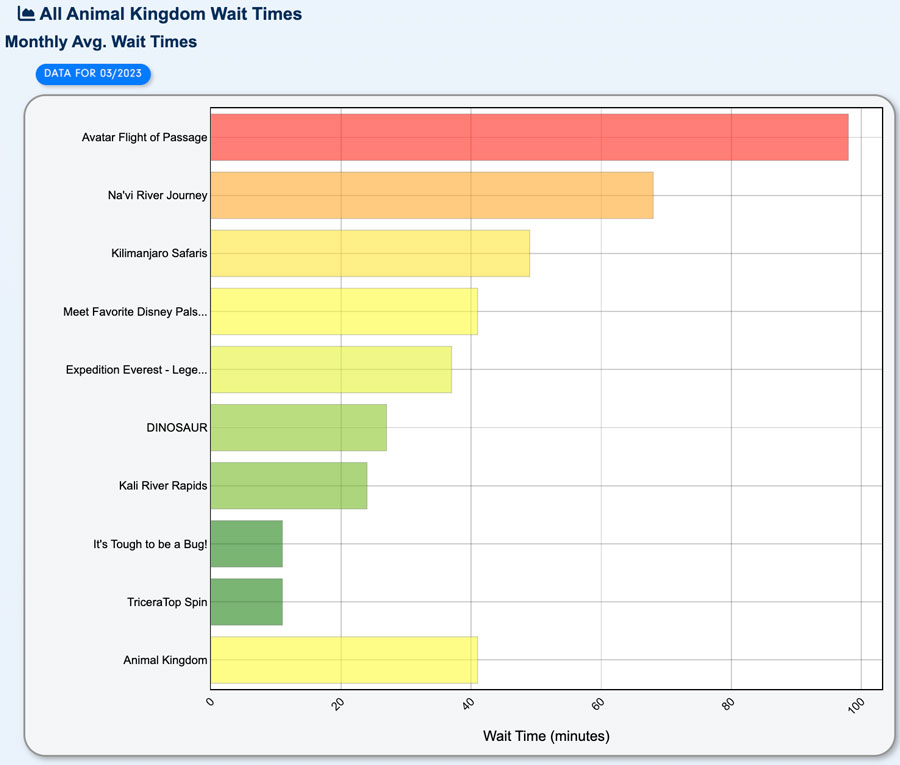
Nothing all that surprising in terms of attraction wait times.
Slinky Dog dashed past Star Wars: Rise of the Resistance, but that’s happened before. Space Mountain also rocketed up the rankings, but that could be propelled by its downtime woes, leading to Lightning Lane logjams. Meet & greets in Magic Kingdom continued to fall into average territory, which is actually somewhat of a surprise for a busy tourist week–but it reinforces our approach to giving these lower priority in our Magic Kingdom Lightning Lane Rankings.
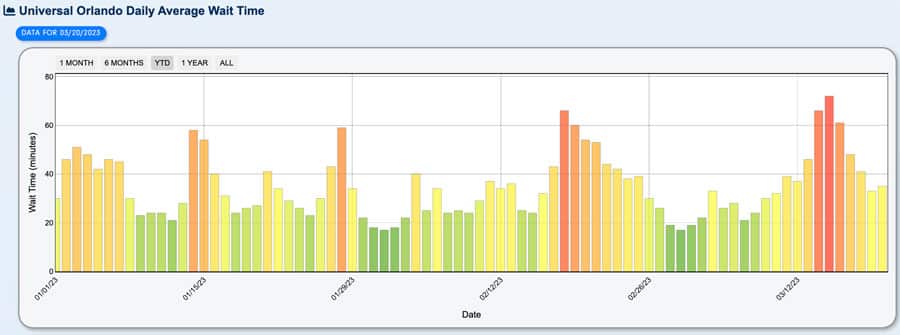
For those wondering how Walt Disney World’s wait times compare to Universal Orlando, the trend is about the same for mid-March 2023.
With that said, Orange County’s spring break outperformed other peak weeks this year at Universal Orlando, which is probably attributable to Universal Orlando’s Florida resident ticket deal not having blockout dates, meaning that more locals could choose Universal as a staycation option. That was our expectation going in, and is precisely how things played out.
Looking backwards, we’re actually slightly surprised that last week wasn’t even busier. The week as a whole was about on par with Orange County’s spring break last year, but I still expected another 10/10 day or two.
The bigger story is the way crowds fell off on Saturday and Sunday. Perhaps even this shouldn’t be a surprise, as it’s the third straight time this has happened in 2023 following a busy week. The difference is that this is the first time it’s happened outside of a runDisney event. With those, it was easier to explain away or attribute the trend to the races themselves, or runners no longer having Annual Passes.
Three times is a trend, but even now, there are other externalities that could account for the drop. There were youth sporting events over the weekend, and it’s possible those participants did their park days disproportionately during the week rather than weekend.
It’s also possible that colder weather is a cause, as temperatures dropped sharply late Saturday and overnight into Sunday. Still, that would not explain the lower wait times during the day on Saturday, when the weather was warm and relatively mild. More frigid weather also typically does not dissuade tourists, only locals. The many scantily-clothed guests waiting alongside me for the bus from A.S.S. to MK yesterday morning are a testament to this.
Another big explanation is pricing. Airfare is up significantly, and those costs plus higher hotel rates for the weekend could’ve pushed tourists visiting for spring break to arrive on Sunday and leave on Friday or Saturday.
Obviously, Walt Disney World prices are up across the board, too, and it’s possible people are purchasing shorter-duration tickets as a result. (This is something we’ve been “investigating” for the last few weeks, and I have reason to believe this might be a growing factor.)
In all likelihood, all of these variables likely played parts in crowd levels being lower over the weekend. There’s likely even more that I’m failing to take into account, too. Sunday slowdowns following holidays are not uncommon, but the same hasn’t been the case for Saturdays in the past–nor are the drops usually this pronounced.
It’ll be interesting to see whether this continues to happen during upcoming holiday weeks and busier travel times. We might need to start updating our crowd calendars if this becomes the ‘new normal’ of attendance dynamics at Walt Disney World.
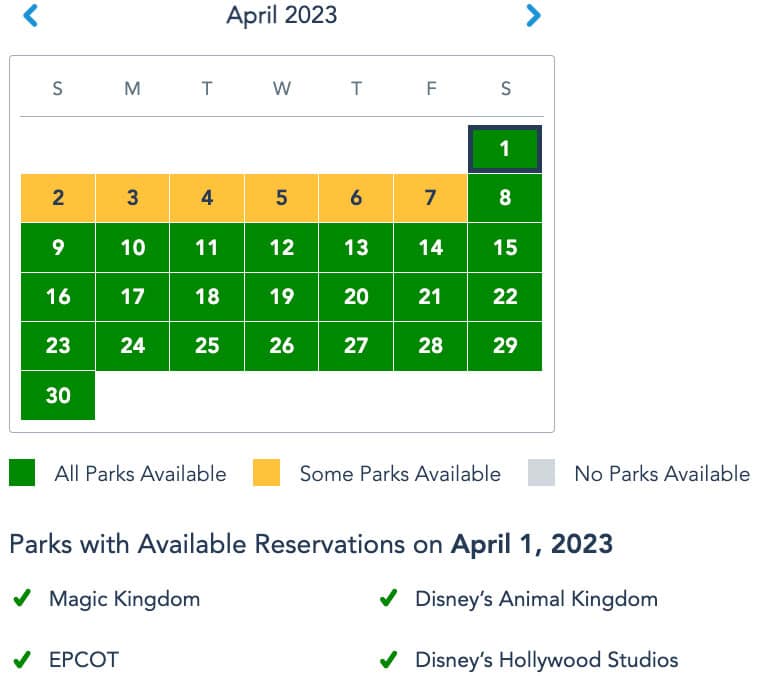
Looking forward, park reservations are green for the remainder of March 2023. This reinforces our prediction that the next two weeks would be a bit of a ‘sweet spot’ in the season in between the peak weeks of Orange County’s spring break and Easter.
Following that, both Magic Kingdom and Disney’s Hollywood Studios are fully booked for lead up to Easter. Reservations are booking up faster (and to a greater degree) than last week, so it’s entirely possible that Easter will end up being busier than Orange County’s spring break. That wasn’t our expectation going into this season, and it still may not be the case (park reservations are hardly conclusive), but it’s looking increasingly likely–especially after last week wasn’t quite as bad as anticipated.
Ultimately, it was a busy week in the parks, but not quite as bad as we expected–or at least, not for the full duration of the week. Our Spring Break 2023 Crowd Calendar for Walt Disney World predicted that this past week would be the worst of spring break, and I’m now willing to bet that our prediction will end up being wrong. The week leading up to Easter should surpass last week, but who knows–maybe there will be a similar decline in weekend crowds.
The next couple of weeks between now and then shouldn’t be too terrible, at least, not by spring break standards. It’ll still be nothing like early March, all of May, or September, but it won’t be peak season bad, either. Our expectation is wait time levels in the 7/10 to 8/10 range most days, which might sound (and look!) bad, but those are very much “beatable” crowds if you’re up early, out late, and utilize savvy strategy.
Planning a Walt Disney World trip? Learn about hotels on our Walt Disney World Hotels Reviews page. For where to eat, read our Walt Disney World Restaurant Reviews. To save money on tickets or determine which type to buy, read our Tips for Saving Money on Walt Disney World Tickets post. Our What to Pack for Disney Trips post takes a unique look at clever items to take. For what to do and when to do it, our Walt Disney World Ride Guides will help. For comprehensive advice, the best place to start is our Walt Disney World Trip Planning Guide for everything you need to know!
YOUR THOUGHTS
Have you visited Walt Disney World in March 2023? What did you think of the crowds? Any parks, times of day, or days of the week noticeably worse than the others? Did you find the past few days to be noticeably busier than the first half of the week or previous weekend? If you’ve visited in past weeks before spring break, did you notice a big difference in crowd levels? Do you agree or disagree with anything in our crowd report? Any questions we can help you answer? Hearing your feedback–even when you disagree with us–is both interesting to us and helpful to other readers, so please share your thoughts below in the comments!


I would love to hear your thoughts on the higher prices impacting ticket sales!
A personal anecdote: we are planning a trip to a WDW resort in April for Spring Break to enjoy the warmer FL weather and a pool, but opted out of visiting the parks at all.
After our January visit, and being floored at how expensive the park days were between ticket + Genie + LL + food, we cannot justify doing it again any time soon for our family of 4.
Out of curiosity, I looked to see how much it would cost us for one day at MK during our visit.. Tickets alone would be $688 for four people! But it seems like people keep paying what they ask, so it is hard to see it improving any time soon.
On the one hand, on-property guests at WDW only account for one-third of park visitors, so unless there’s been a big jump in the past few years in the difference between weekday and weekend prices, I would have expected this to show up before now. On the other hand, I did notice that the All-Star prices are not nearly as competitive with off-property motels on weekend pricing than they are on weeknights, so there is a noticeable difference.
On a lighter note, I’m wondering if Space Mountain is more popular with larger crowds because guests who aren’t as obsessed with all things Disney aren’t as familiar with WDW’s maintenance schedules, or lack thereof.
Love your blog! Do you think it would be better to go to Magic Kingdom on wednesday, april 5 (we would have access to the extended evening hours) or saturday, april 22? Thanks!
All help appreciated: our last visit to WDW was 2018 due to covid cancellations. Our First time trip was 1990 with many since then, so
Lots of changes have been observed! We are arriving July 17th for 12 nights. I am feeling very daunted and yes – panicked – at the thought of this holiday. Genie, Genie+, Lightning Lanes, virtual lines, are just some of the new buzzwords; where on earth to start? Pre booking park entry and juggling all of these things appears a military operation. I used to be so excited in anticipation of a WDW trip but this time I just feel swamped and confused! We are staying at AKL, without a car. As guests from the UK we have previously had free DDP with our package and M Express so for us a trip to WDW is currently VERY costly as the £ to $ rate is poor. I’m wondering how much extra cash all of these buzzwords add up to as well as the stress of where to start planning. I use to consider myself quite an officiando at planning our trips but now I’m filled with dread knowing that I need to get my ostrich head out of the sand. It looks like the ticket price to WDW is simply for entry now, to walk around in the heat doing nothing? and any popular ride is extra and needs to be booked? Please help I’m struggling and wondering whether to cancel as it’s so expensive for us – and when we may not get to experience our favourite rides and new attractions and enjoy ourselves!
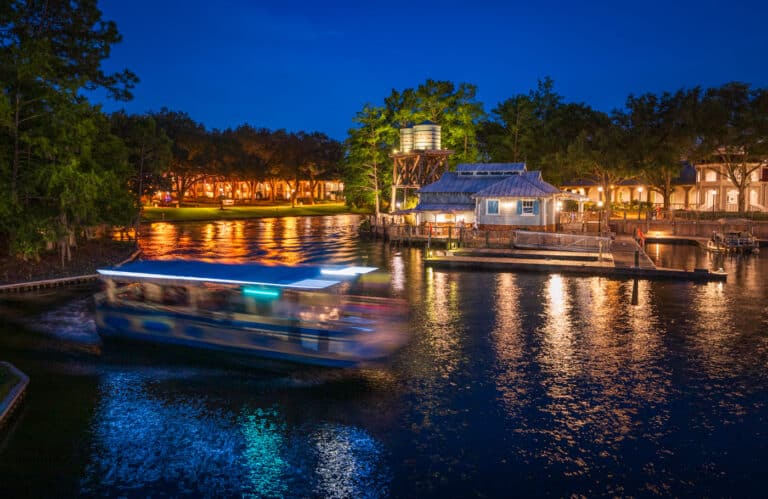
Don’t cancel. We just got back, having stayed at Fort Wilderness Cabins for four days during spring break. I spent quite a bit of time preparing for the Genie+, Lightning Lane challenge. It went fairly smoothly. My son felt it was better than the old FastPass system. He got all the rides in that he wanted. There were breakdowns, of course, that affected a few of his rides. Try not to look at the reservation system, etc as a burden. Also 12 days is a LOT of days. There’s plenty to do, but plan to head back to your resort during the middle of the day for a well-deserved break. Don’t overlook the less popular attractions. For example, we love Tom Sawyers Island and Hall of Presidents. Depending on the age o your kids, everything at Disney is worth doing. And there’s little to no waiting. Alternate those things with the loner waits. It will make those wait more bearable. Definitely hit the water park(s). And the nighttime shows. For all the long waits you’ll have to endure, those other things without the lines will make your visit more pleasant. I don’t think I covered everything I would if I spoke to you in person, but I encourage you to come and enjoy.
The last few times we have visited Disney World we arrive Sunday and fly out Friday or Saturday. Cost is the reason.
I have a lot of clients that choose to check in on a Sunday and check out on a Friday or Saturday. It’s easier for travel and a little cheaper as well. Also kids/teens have a lot of sports commitments on weekends. So they are not available. The spring SAT was held 3/17 also. So a lot teens were just busy. And baseball is usually on Sundays. Just a thought, combined with prices and weather.
Sorry the SAT was 3/11 I mistyped!! Anyway maybe it didn’t contribute… just an idea
Thanks for all of your info! You mentioned that AK is no longer open after dark. I was wondering about that – we are going the last week of March and with sunset scheduled for ~7:40pm, is 8pm enough to see any of the luminescence with dusk approaching? Or not interesting enough to bother planning around? For reference, I have kids so going to bed earlier is never a bad thing, and we plan to ILL FOP so don’t need to get in line at the last minute, staying later than close to ride. Thanks again!
We just got home yesterday and were also pleasantly surprised with how low the crowds were at MK on Saturday. Originally we were supposed to fly back on Saturday but extended the trip by a day as our kid came down with a nasty stomach bug. (That coupled with the airplane we were supposed to fly down on being repossessed just as we were about to get on it made for a Disney trip that was way more adventurous than it should have been!) Anyway, we were able to snag reservations for lunch at Jungle Navigation the morning of and really enjoyed the low crowds. We’ve never been in March before (only Christmas or the summer) and would definitely go back for the pleasant weather. The other families I know who went last week all flew back on the Friday or Saturday.
Okay, I need to know what airline that reposession happened on!
Maggie, it was Flair in Canada. I saw a man tape a piece of paper to the outside of the plane and thought that was a bit weird. Then they announced the flight was delayed due to mechanical problems. After an hour so so it was announced it was cancelled! I had to scramble to find another flight and we had to drive down to the USA to fly out of Detroit. The company has said they will reimburse us, but I will believe it when I have the money in my bank account. It was quite the start to our holiday! I felt really bad for all the families with young children who were clearly also headed for Disney.
I wondered what your email would say about this past week as we were at MK for After Hours Thursday 3/16 plus Fri 3/17 and HS on Saturday with AK as our finale on Sun 3/19 and I was expecting wall to wall people but it wasn’t that bad, IMHO. We were able to do everything we wanted at HS on Sat and like you said crowds dropped dramatically later in the day. We stayed offsite but were able to walk on to ToT at park opening and easily got a LL for Slinky at 7:01am. An Olaf cast member said she thought they weren’t as busy b/c people left for end of spring break on Saturday. Animal Kingdom wasn’t overly busy and the wait staff at Tusker House (3/19) made the observation to me that they were slower than normal when we ate at 3:30pm. We saw characters come by our table at least 10 times. It was nice and quiet! Thanks for all of the tips you share! I learned a lot in anticipation for our trip and we used your park itineraries as planning guides.
Could become very interesting if more and more folks make WDW a 4-5 day visit – avoiding the significantly higher weekend prices for lodging. I can assure you it is always a factor in my decision making regarding a trip to WDW.
Interesting take on the cold snap. I just checked my touring plans dashboard for our spring break trip in 2021 (also known as the year of mask!) and the weather for Mar 19-21 were all highs in the 60s. In fact we rope dropped Magic Kingdom on Saturday Mar 20th and if was the lightest crowd I’ve ever seen there. It was walk on for the first 2 hours for most rides. Cold weather plus sweet spot in the spring break rotation really played out that year. Sadly this spring break starting in 4 days looks hot.
I was there and it was not as bad as I thought it’d be. Hotel prices are more on weekends during weekdays, I wonder if people are choosing to avoid weekends now to save dollars. Rather than utilizing more “free” vacation days. Maybe people choose a Mon-Fri over Thur-Mon to save money over days.
Nice! Not sure how much of an effect the Sebring 12 hours race had on the crowds. It’s probably a totally different crowd!!
We were at Magic Kingdom on Saturday the 18th and couldn’t believe how great the crowds were. We were literally on the rope for Seven Dwarfs rope drop with minimal effort. We did that, Peter Pan, Big Thunder, Pirates, all stand by, and Jungle Cruise (via lightning lane) all by 10:15. We basically did every ride twice except for Seven Dwarfs, and we could have done that with minimal wait at the end of the night, but we were dead tired. All of this was done in addition to a 1.5 hour leisurely breakfast at Crystal Palace, watching the full 12:00 parade, a break at our room in BLT, and and hour and a half spent at the Tron D23 Preview event, and getting to the hub a half hour before fireworks. It was fantastic!
I was in Magic Kingdom on Saturday and totally agree.
What you “missed” during the TRON D23 event was very low crowds at everything else in Magic Kingdom throughout the evening. Seven Dwarfs Mine Train was literally a walk-on after around 10 pm! Ditto Peter Pan’s Flight and Space Mountain. Very nice as compared to the middle of the week!
I also noticed that big drop of of crowds on Saturday and Sunday but attributed it to the 2,3,and 4 day Florida resident tickets that are weekday only and expire April 27.
The Florida resident tickets were also blocked out March 13-17.
We just returned and agree with your thoughts. As regular DVS members from Indiana, we come three to four times a year. But it is usual to travel one or even two days on the weekends. So those may be a reflection of more out of towners travelling, especially during the school year. That might not be the case around easter – our spring break is later than most – first week of April – but usually has an extra day with kids out for travel. Some districts even give an extra day, knowing that so many travel, and can get a jump on the weekend. Easter Monday or Good Friday work into the plan nicely for these schools.
For us, we may start to avoid weekend travel if possible. Saturday night hotels were jumped up 50% over other nights in the Nashville area, so we may try to go a different night on the road. Greed will always prevail, if given a chance.
Yeah, definitely not going to draw any conclusions about Easter weekend crowds as that’s a holiday weekend, but I still wouldn’t be surprised if that Sunday is lower than normal, and maybe even the Saturday!
Weekend hotel rates and airfare have really gotten out of hand–that’s gotta be part of it.