
One of the Worst Weeks Ends & Best Begins for Disney World’s Christmas Crowds
November is over, December has arrived, and Walt Disney World is more or less halfway through the holiday season. Two big weeks have passed, and two more are on the horizon. This Christmas crowds report covers the lows & highs of wait times data for November 2023 at Magic Kingdom, EPCOT, Hollywood Studios, and Animal Kingdom, a look back at Thanksgiving and predictions for what to expect next.
As is probably obvious from the title…or our last crowd report…crowd levels are going to change over the course of the holiday season. A lot. And these aren’t gradual changes, either, with Walt Disney World gradually shifting from one ‘season’ of crowds to another. They are abrupt, they are overnight.
During Thanksgiving week, Walt Disney World literally went from peak attendance and astronomical wait times one day to crowd levels of 2/10 the very next day. That’s a pretty sharp contrast and we’re not expecting anything quite on that level for the rest of the holiday season (honestly, we didn’t even expect that degree of a day-to-day difference), but it nevertheless underscores the roller coaster nature of crowd levels. Suffice to say, you shouldn’t look at social media photos or posted wait times one day, and assume the next day will be about the same. There are big differences this time of the year.
There’s a lot more of this to come. There’s a reason they named it the holiday season–because it’s a season of holidays. Between the start of November and early January, there are no fewer than a half-dozen holidays and breaks that have huge impacts on crowd levels. Some of these are obvious–the weeks of Thanksgiving, Christmas, and New Year’s Eve. Others, like Jersey Week, are decidedly less so. I’m sure Hallmark celebrates a few more that even I’m unaware of.
The very good news is that in between those holidays, there are lulls in crowds. The breaks act as crowd magnets, of sorts, for Walt Disney World. People are less likely to take off of work or pull their kids out of school when a built-in break is just around the corner. This makes the downtime even more pronounced, with the exception of locals and diehard Disney fans who know about the better times and are able to visit during them. (That second part is key. A lot of people have the knowledge–far fewer can act upon it!)
Point being, the next month-plus is going to be a roller coaster of crowds at Walt Disney World.
Let’s turn to the wait times data–starting with the usual asterisks. As always, this data is not conclusive of attendance or in-park congestion. Additionally, frame of reference is a major issue.
Walt Disney World attendance has increased by several million people over the course of the last decade-plus through 2019. Then attendance plummeted for a year-plus, spiked as a result of pent-up demand for 2 years, and is now coming back to reality. So your individual perception of crowds may vary considerably based on when you last visited.
There are also several other variables that can impact “feels like” crowds, including but not limited to festivals at EPCOT, weather, guest demographics, ride breakdowns, operational efficiency, wait times manipulation, and park operating hours. This is just a partial list, and all of those are significant variables right now.
In short, wait times are an imperfect measure of Walt Disney World’s raw attendance or crowds. Imperfect as they might be, wait times are still the best measure of crowds–and the only objective one. The alternative is relying on anecdotal observations, which are much more flawed and incomplete.
It’s impossible for anyone to be everywhere at once, and hard to know whether you’re in a pocket of crowds, what efficiency issues exist, and whether guests are disproportionately doing attractions or loitering about. Yada yada yada. See our Walt Disney World Crowd Calendars for more disclaimers about the limitations, strengths, weaknesses, etc. of this type of post.
With that out of the way, let’s dig into the data and look at Walt Disney World wait times. As always, all graphs and stats are courtesy of Thrill-Data.com:
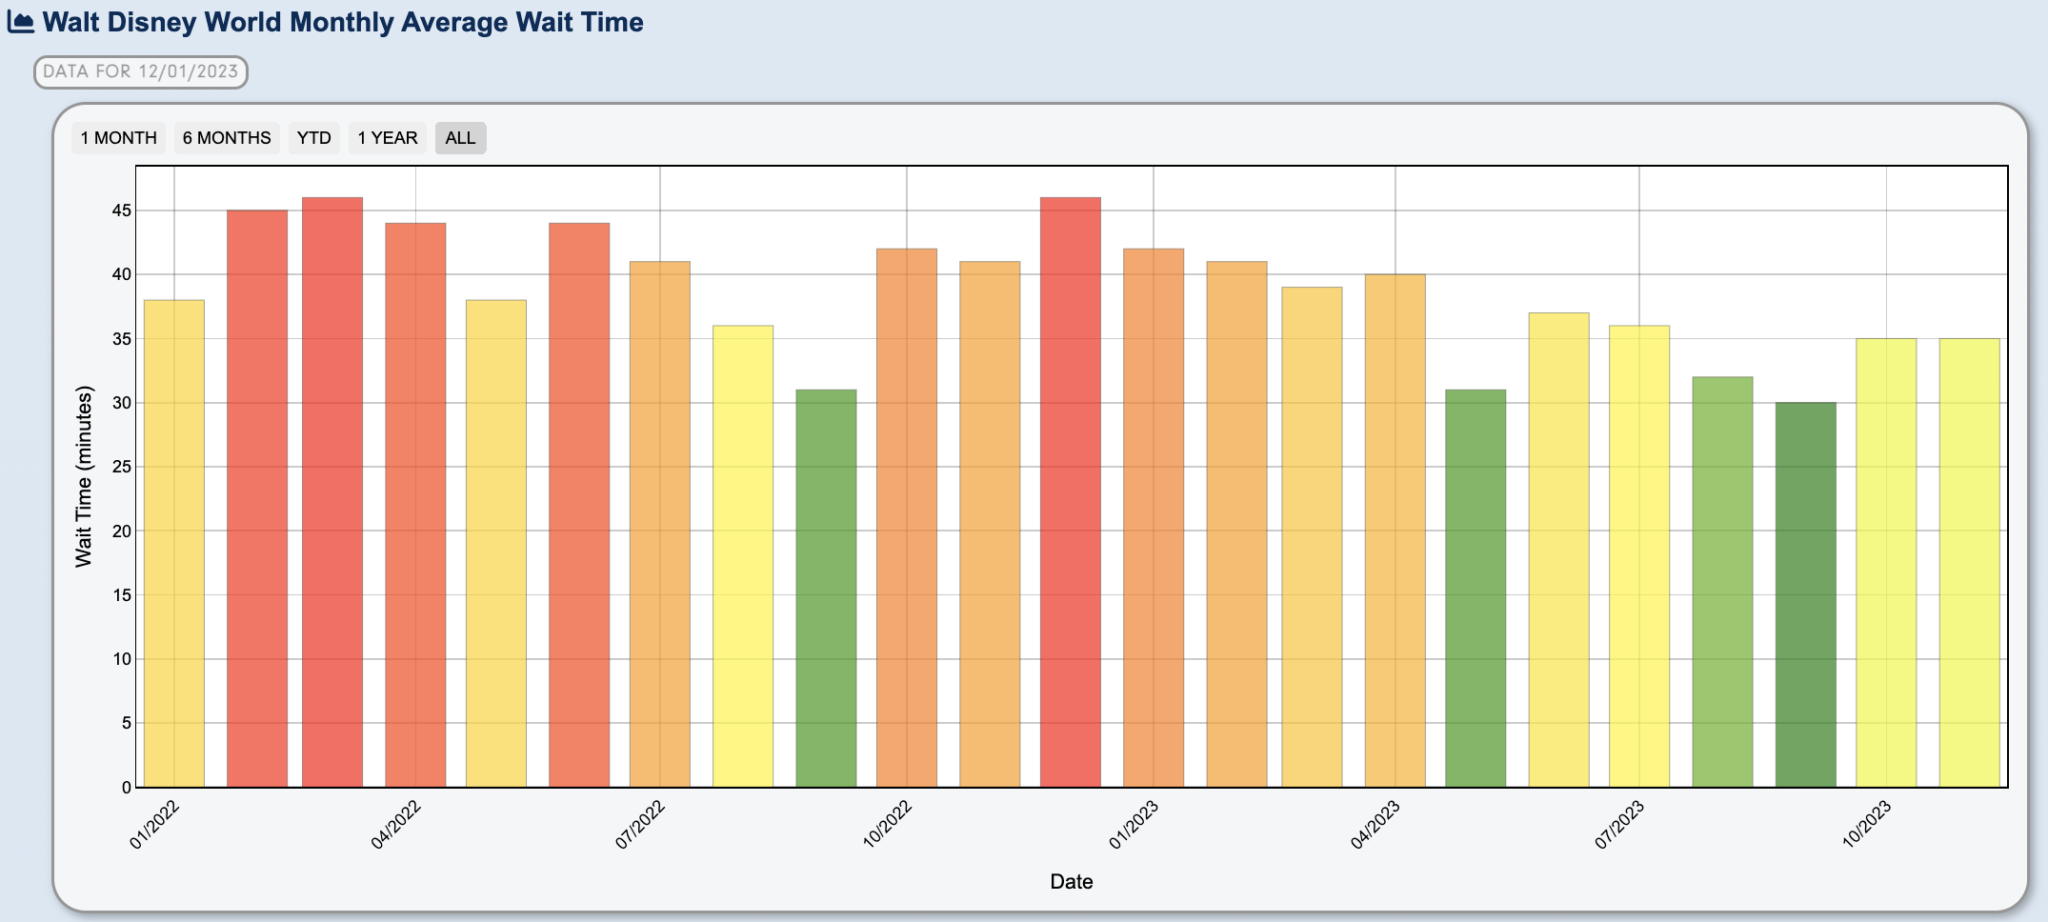
We’ll start with the monthly numbers for Walt Disney World as a whole.
Even with the busy weeks of Veterans Day and Thanksgiving, November 2023 ended up having identical crowd levels to October, and was less busy than June or July. It was also significantly slower than last November. That’s consistent with every single month this year after January.
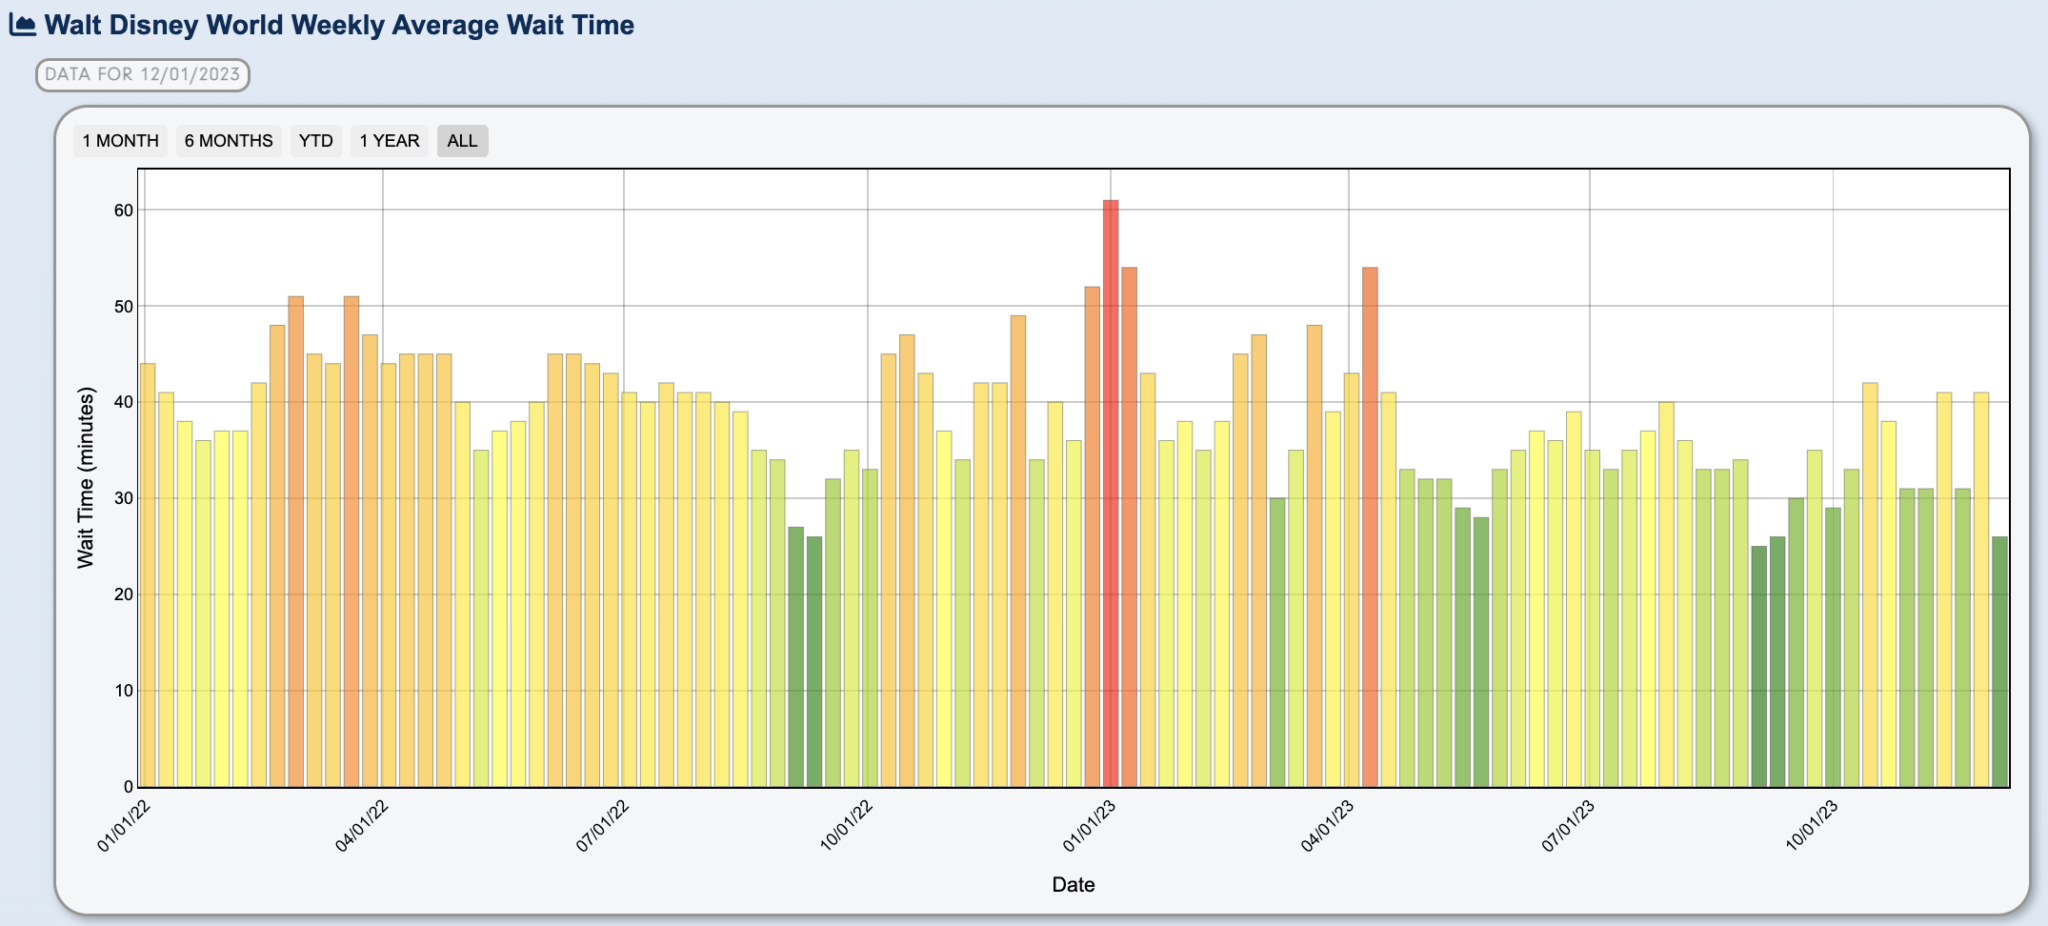
Above is the weekly wait times data for Walt Disney World.
Here’s where we see why November was “only” as busy as October, and the answer is basically the lulls between holiday weeks. There are four yellow bars on the far right amidst a sea of green. Those are fall break (x2), Jersey Week/Veterans Day, and Thanksgiving. While busier than adjacent dates, those weeks also weren’t nearly as bad as last year when pent-up demand was running red hot.
Our list of the 10 Best and 10 Worst Weeks to Visit Walt Disney World in 2023 to 2025 named last week one of the worst weeks and this week one of the best. We’ve been talking up the week after Thanksgiving for years, but still get complaints from diehard Walt Disney World fans that we’re giving away the “secret.”
As you can see, our recommendations have no bearing whatsoever on crowd levels. Maybe I should feel bad that my advice is being ignored, but the simple fact is that the vast majority of people travel when they can. Online advice (not here or anywhere) does not shape or shift attendance to any meaningful degree. So if you’re a contrarian who thinks they should zag because “everyone else is reading that they should zig while others zag,” you’re overthinking it.
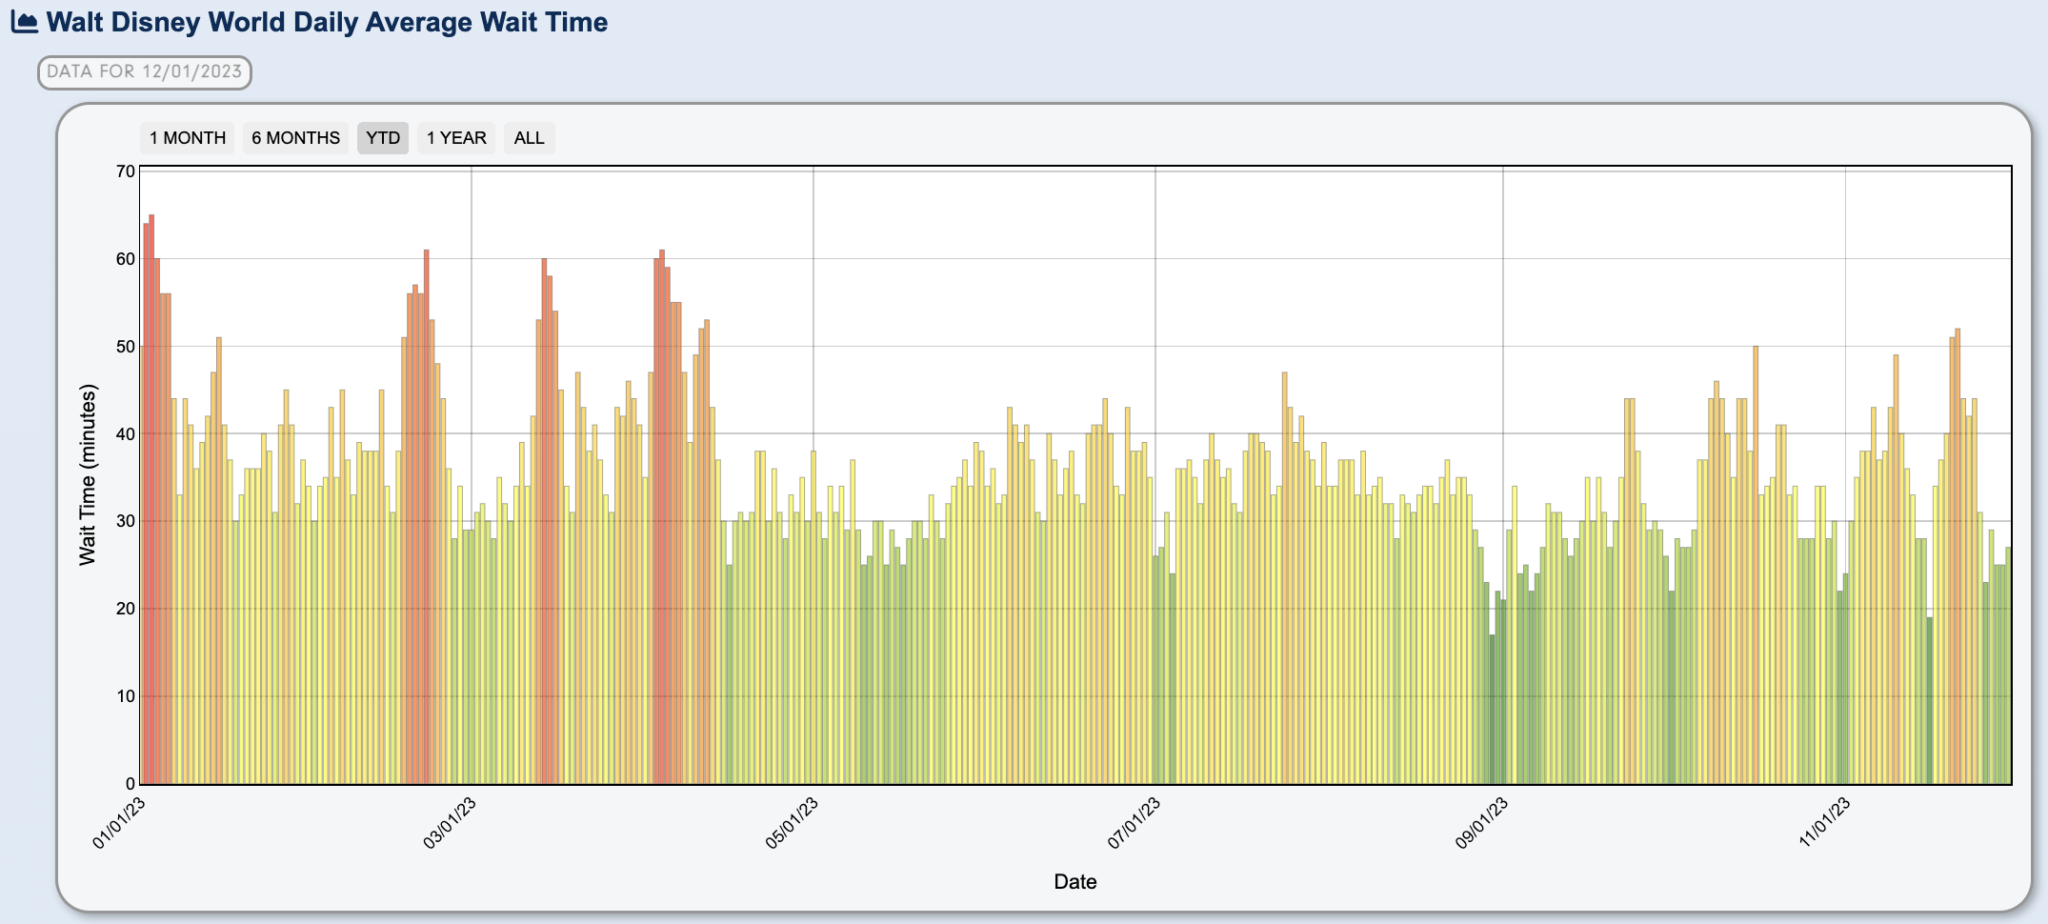
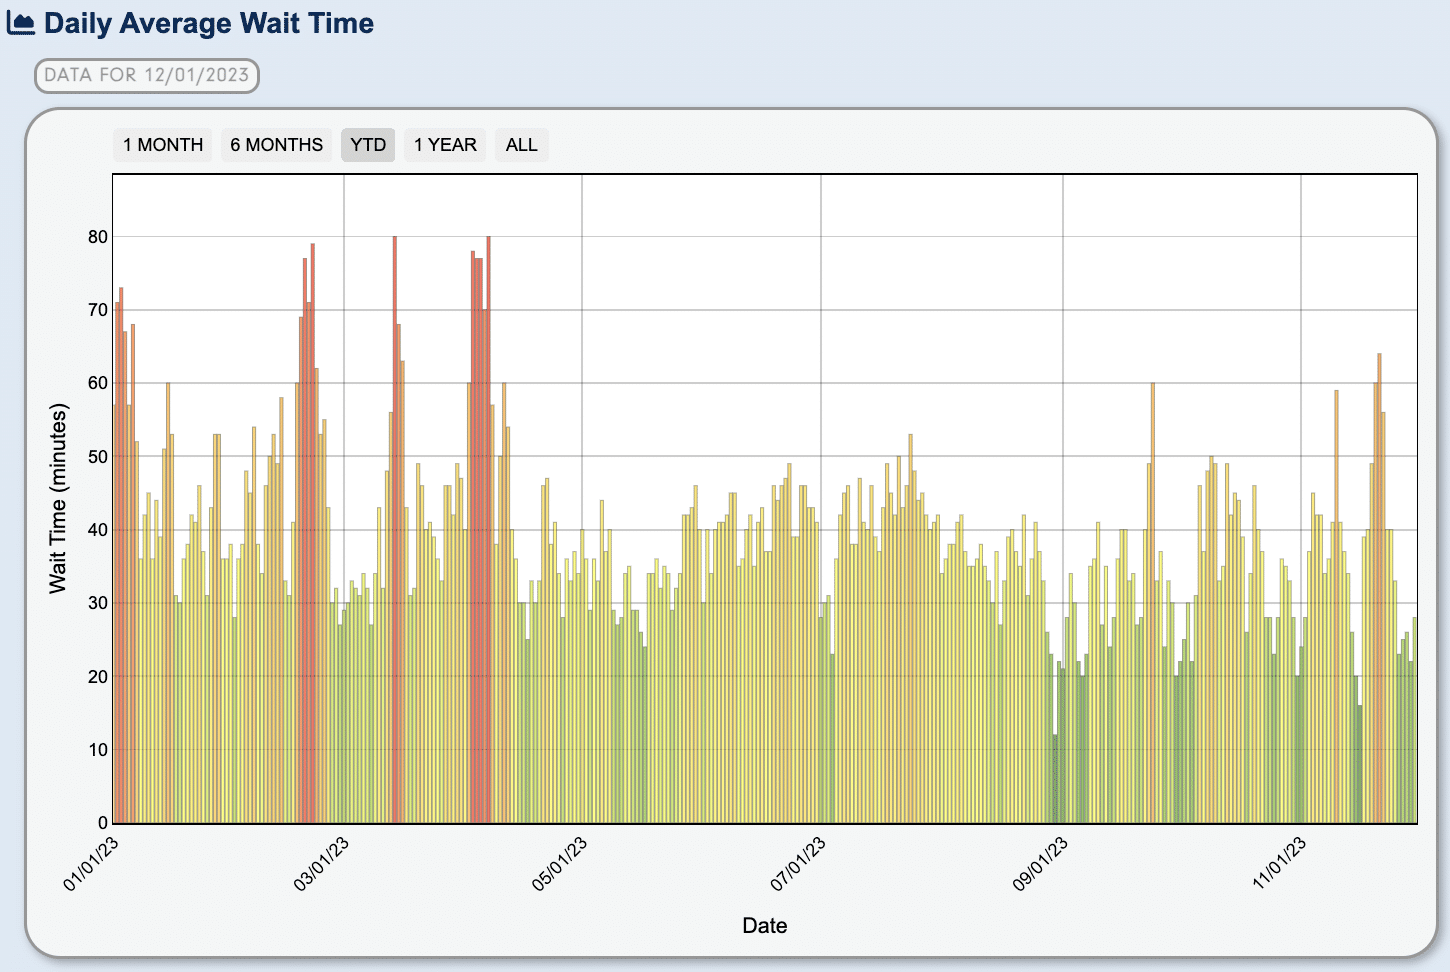
Next is a high-level look at the daily numbers across all four parks at Walt Disney World.
This is where things get interesting. Over Thanksgiving week, wait times peaked on Tuesday, November 21 at 52 minutes for a crowd level of 9/10. On Monday, Nov. 20, wait times hit 51 minutes, also a 9/10 crowd level. On both of those days, Genie+ sold out at Magic Kingdom. Crowd levels remained in the 8/10 range until Friday, November 24.
I wouldn’t get hung up on those numerical scores. Currently, anything at or above 8/10 is peak season crowds. The scale has been a bit thrown off by some absolutely astronomical numbers during that red-hot pent-up demand stretch. Rest assured, if you visit on an 8/10 or higher day, you’re going to think the parks are bonkers busy.
Regardless, crowds dropped off a cliff on Saturday, hitting 2/10 and staying at or below that level every day since. This is not super surprising, as weekend pricing is prohibitive and blockouts are aggressive. Meaning many locals can’t visit on Saturday or Sunday and many tourists are heading home. We’ve been discussing that trend all year long. Still, we have wondered whether it would start to shift over the popular holiday season. Guess not!
For our part, we predicted that Monday would be the busiest day of the week, but advised “not to count out Tuesday or Wednesday” as sleeper picks for the busiest day of the week depending upon how hard ticket events disrupted the attendance and wait times dynamic. So we technically got the Monday call wrong (by 1 minute), but the general idea that Monday through Wednesday would be the worst of the crowds was accurate.
Honestly, though, I expected more of a drop-off for Thursday and Friday and less of a crowd crash for Saturday. People always start heading home by Sunday–that’s nothing new–but to have the Saturday of a holiday weekend be so slow is nuts. Walt Disney World is really behind the curve in adjusting AP blockouts and room rates. (Off-site hotel and flight prices are also huge contributing factors, but there’s nothing Disney can do about those.)
Magic Kingdom had one of its busiest days of the entire year on the Monday of Thanksgiving week, hitting a 10/10 crowd level.
This was totally unsurprising, as Walt Disney World made the incredibly guest-unfriendly decision of scheduling Mickey’s Very Merry Christmas Party on that Sunday, Tuesday and Wednesday. That means 6 p.m. closings those days, which means guests avoid them and seek out longer hours. The way the earlier park closing time impacts crowd levels is something we’ve covered at length, again and again.
More party days from October through December than in August and September is an annual occurrence, but this is the first time they’ve ever pulled that 3/4 days stunt during Thanksgiving. (Also worth noting that there was a Jollywood Nights on that Monday.)

The even crazier thing is that, if Walt Disney World understood attendance trends better, they would’ve shifted the Wednesday party to Friday (like a normal week). Their scheduling operated from a playbook that’s a few years out of date. (This is not the least bit uncommon. Walt Disney World is incredibly reactive to changing attendance patterns, and usually it takes them several years to adjust. It really undercuts the “argument” some fans make that Disney is great with data and analytics. They are not.)
Rides with the highest average wait times in Magic Kingdom for the entire month of November:
- Seven Dwarfs Mine Train: 81 minutes
- Peter Pan’s Flight: 73 minutes
- Jingle Cruise: 67 minutes
- Space Mountain: 53 minutes
- Haunted Mansion: 47 minutes
Next up is Animal Kingdom.
Animal Kingdom wait times pretty much mirror Walt Disney World as a whole, but at a lower level. It helps that Animal Kingdom has gotten some healthy extensions to park hours, and those earlier openings plus late closings and the earlier sunset time (meaning evening in Pandora and Tree of Life Winter Awakenings!) certainly helps.
Top average wait time rides in Animal Kingdom for November:
- Avatar Flight of Passage: 84 minutes
- Na’vi River Journey: 66 minutes
- Adventurers Outpost Meet & Greet: 49 minutes
- Kilimanjaro Safaris: 42 minutes
- Expedition Everest: 32 minutes
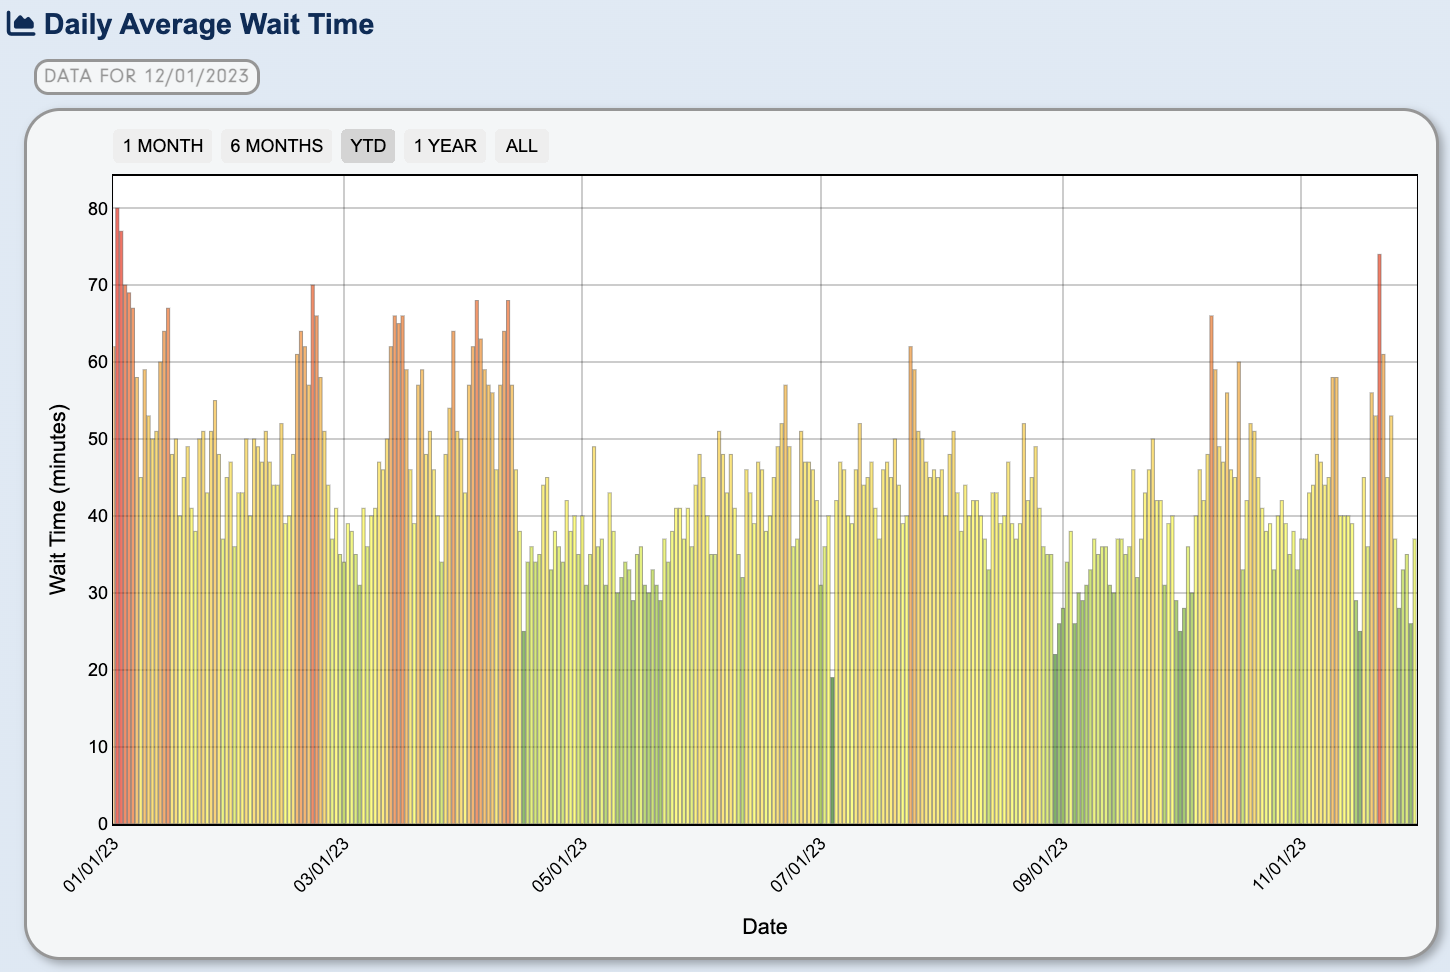
As always, Disney’s Hollywood Studios is the busiest park at Walt Disney World as measured by average wait times. (Note the different scales for the various parks.)
In particular, the Tuesday of Thanksgiving week was insanely busy–74 minute average wait time, 10/10 crowd level, and the worst day at DHS since January 3. This is the worst day, by far, that any park has had in the post-pent-up demand “era,” if you want to call it an era. (Period is probably the appropriate term.)
The simple and unsurprising reason for this is that DHS is the clear #2 priority park for people visiting Walt Disney World. Meaning that most guests did Magic Kingdom on Monday and Disney’s Hollywood Studios on Tuesday. That was the “logical” approach in terms of park hours and also consistent with everything we’ve seen since the start of Party Season. (See Best & Worst Days of the Week for Each Park at Walt Disney World.) It was just amplified due to the holiday week.
Thankfully, readers of this blog have had this advice pounded into their heads again and again, so no one here was in Magic Kingdom on Monday or Disney’s Hollywood on Tuesday…right? RIGHT?! (Kidding, of course. Following the advice here isn’t always feasible for a number of reasons, which is a big reason why it works!)
For November, DHS had 7 rides at or above hour-long waits. However, neither Slinky Dog Dash (91 minute average) nor Star Wars: Rise of the Resistance (79 minute average) were in triple-digit territory. Obviously, that was not the case on that particular Tuesday–a day when 4 rides were over 2 hours on average and 3 more were above 90 minutes–or Thanksgiving week as a whole!
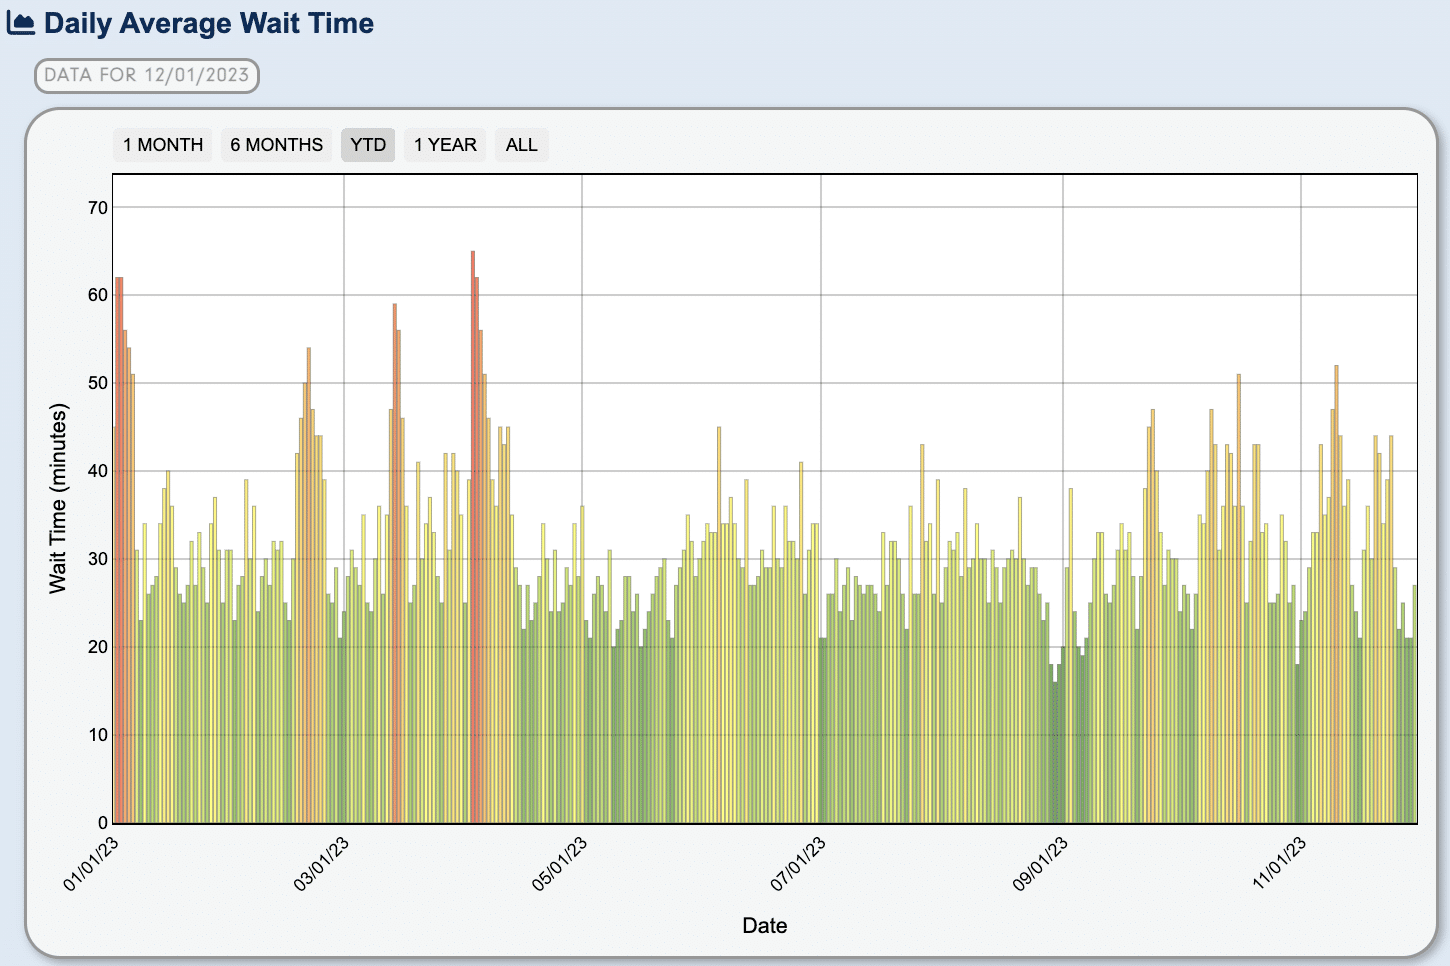
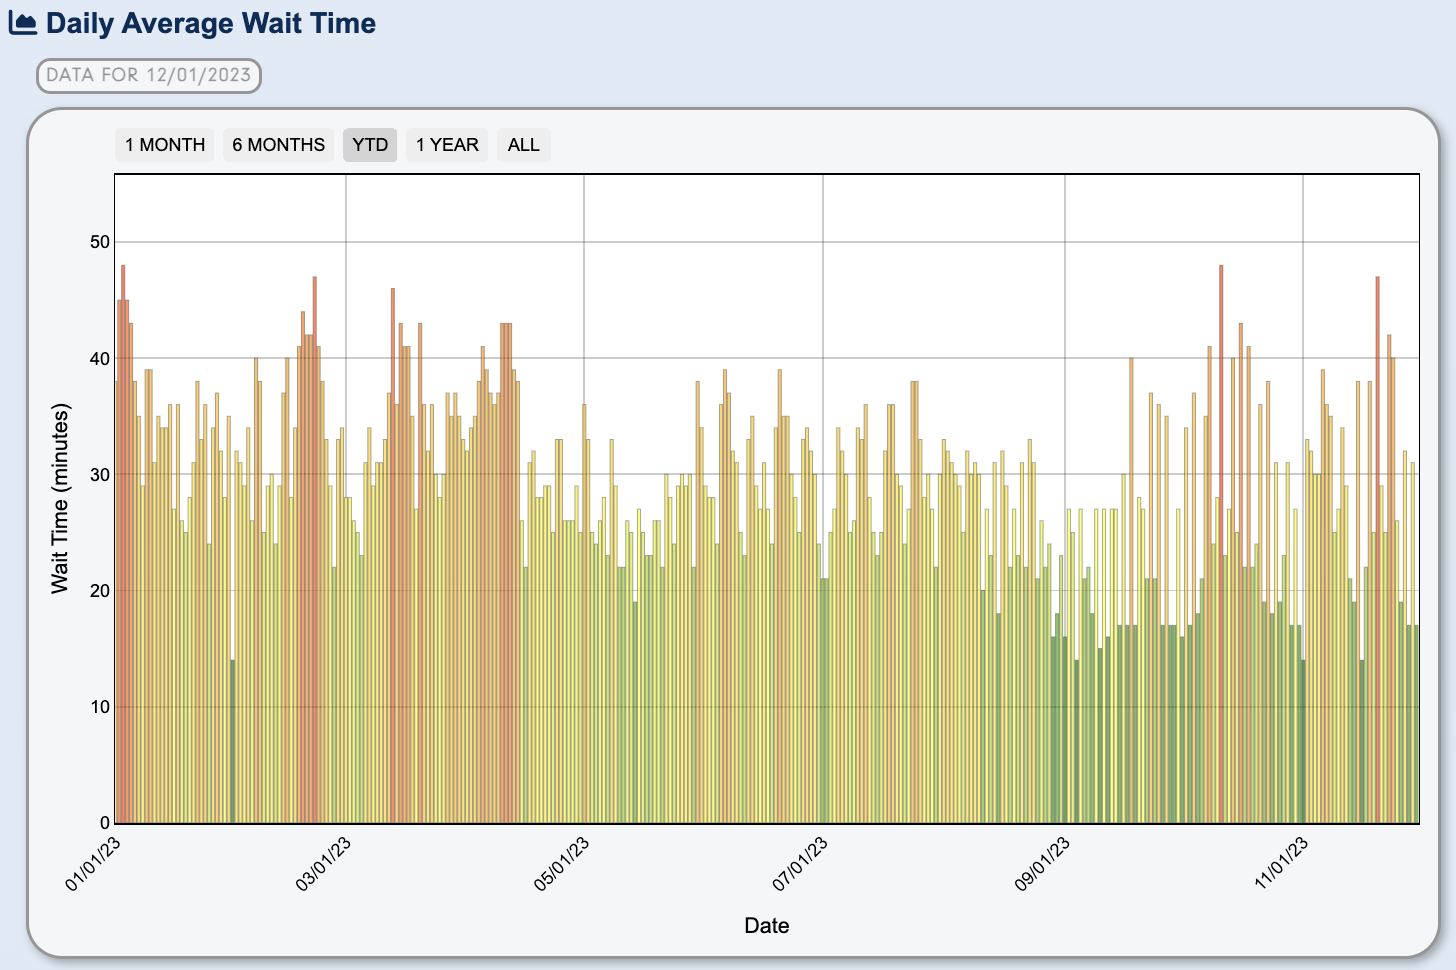
Finally, we have EPCOT.
One thing you’ll notice with EPCOT is that it didn’t have the same high highs for Thanksgiving week as the other 3 parks. We were not in EPCOT for Thanksgiving week, but I can say with a high degree of confidence, this is meaningless. EPCOT is the local’s park and locals don’t do as many rides–and attraction wait times are what these crowd levels measure.
With decorations going up and Festival of the Holidays starting, EPCOT was assuredly congested–even if that was not reflected in the wait time for Test Track or Frozen Ever After or whatever. It would’ve been in the lines for food booths, Starbucks, DVC lounge, and pretty much everything else.
We’ve done EPCOT many times during Thanksgiving week, and even when the wait times didn’t signal that it was busy, I’ve never walked away thinking, “that was pleasantly uncrowded!” EPCOT is its own beast, and the perception of crowds really depends upon a guest’s priorities.
Once again, we want to warn you that this is only going to get worse starting on December 5, 2023 with the filling in of the Giant EPCOT Dirt Pit and debut of Luminous: Symphony of Us. I would expect EPCOT to have some of its worst ‘feels like’ crowds in a long time on the weekends in December. You can pretty much ignore the posted wait times as a measure of crowd levels, unless you’re only there for rides…in which case, they are a perfect measure of crowds! 😉
I’ve said it before, but I’m shocked that Magic Kingdom, Disney’s Hollywood Studios, and Animal Kingdom have been getting healthy park hours extensions…but not EPCOT. I know this isn’t Theme Park Tycoon, but if I were in charge, I’d take those extra hours from Animal Kingdom and give them to EPCOT. It could open an hour earlier and stay open 2 hours later–and that would probably pay for itself in bonus food & beverage sales!
Ultimately, it’ll be interesting to see what happens next. In a normal year, next week would be busier than this week, but still slower than Jersey Week or Thanksgiving. Last year, crowd levels rose to the ‘moderate’ level for that particular week (5/10 to 6/10 range); we were in the parks then, and they were still pretty comfortable. The difference then was that the baseline was higher and that was a time when pent-up demand was running hot.
If we adjust downwards based on this year’s crowd trends, next week will likely be in the 3/10 to 4/10 range. It’s likely the following week will be more of the same, with crowds possibly creeping up a bit more. However, crowd levels could be even lower…and for longer. The timing of Thanksgiving, Christmas, and New Year’s Eve makes this year a bit of a wildcard. Last year, crowds started increasing from seasonal lows on December 17, hit peak season numbers on December 19, and stayed there until January 6.
Walt Disney World is preparing for elevated crowd levels through January 8, 2024. That’s why so many changes take effect on the following day, and not when the calendar first turns over into 2024. I think they’ve probably overshot that by a few days, and realistically, crowd levels will come down on January 6, 2024. That’s not to say they’re getting this “wrong.” They decided on those changes several months ago and likely wanted to play things conservatively. Regardless, they are absolutely correct that the winter off-season will begin by January 9, 2024 at the latest.
As for when the next peak of this holiday season begins, that’s trickier. If we’re following last year’s trends, it’d be December 18, which is the Monday one week before Christmas. It’s probably a safe bet to predict that day will be busy–it is a Monday, after all–but I’d also expect crowd levels to level off or even drop on subsequent days that week. Instead, my money is on December 22 being the next peak in crowds at Walt Disney World, and the start of a 2-week stretch of the worst dates since this January–which would mean it’s busier than Easter.
Planning a Walt Disney World trip? Learn about hotels on our Walt Disney World Hotels Reviews page. For where to eat, read our Walt Disney World Restaurant Reviews. To save money on tickets or determine which type to buy, read our Tips for Saving Money on Walt Disney World Tickets post. Our What to Pack for Disney Trips post takes a unique look at clever items to take. For what to do and when to do it, our Walt Disney World Ride Guides will help. For comprehensive advice, the best place to start is our Walt Disney World Trip Planning Guide for everything you need to know!
YOUR THOUGHTS
Thoughts on the November 2023 crowds at Walt Disney World? Predictions for the first half of December and the weeks of Christmas and New Year’s Eve? Think it’ll be better or worse than last year, or about equally bad? Better or worse than Easter? Thoughts on our forecast, analysis, or anything else? Do you agree or disagree with anything in our report? Any questions we can help you answer? Hearing your feedback–even when you disagree with us–is both interesting to us and helpful to other readers, so please share your thoughts below in the comments!


Thank you for all your helpful advice. Our family of five arrived at Wdw 11/26- and checked out 12/3. Everyone I knew said we were crazy to go so close to Thanksgiving but it was amazing!!! We also followed your advice to go to mk on the morning of a party. What a wonderful day we had! We haven’t been since 2019 so it means a lot to our family to make the most of these trips. I just wanted you to know that the time you spend sharing this info truly impacts others. We had a magical trip and my family is so grateful for the experiences we had – and I can confidently say that most of what they enjoyed was a direct result of reading the info you provide. A heartfelt thank you from my family to yours!
Thank you for the kind words–happy to hear that the advice here paid off, and you had a great trip!
Hi Tom,
Does this drop off also happen at Disneyland? Thinking about a family trip next year.
We just spent a few days in the parks with a high school choir trip. First of all I have to thank you again for all our wonderful advice – it is so incredibly helpful! You really add so much to our trips and we are forever grateful. Our HS day (11/30) was the lowest crowd day but crowds were significantly worse at MK (12/2). I completely agree with your Epcot assessment. It depends on your timing – we passed by booths/shops with massive lines only to be able to walk right up 30 min later. Also completely agree with you on timing of trips. With school aged kids we have always only been able to go Spring Break/Summer but boy are we spoiled now! I cannot believe how much more pleasant everything was with the nice weather we had. The heat and humidity just add a whole other level on exhaustion – which I knew but didn’t really register until I felt the difference! This is for sure my favourite week to visit! Thanks again!
At WDW last week-
Tue, 11.21: HS was insanely crowded
Fri, 11.24: MK was moderately crowded.
Sun, 11.26: EPCOT was light to moderate crowded (also had a light drizzle for half the day, and about an hour of heavy rain). Frozen had 60 min+ wait times, but we got on test track standby line 2x with a 15 min wait, and by the end of the night, we could have bought additional individual lightning lanes for Cosmic Rewind. Best day we’ve ever had at EPCOT.
Mon, 11.27: AK was quite empty, waited 30 min in standby for Avatar, and walked right onto Dinosaur and Everest.
Hi Tom, on Tuesday 12/5, I’m planning to park hop between Hollywood Studios and Epcot. Given that it’s the opening of the dirt pit and luminous, would you recommend going to Epcot first, then Hollywood Studios, or vice versa? I would like to try to get into Remy and cosmic rewind, but if I go Epcot later in the day, idk if openings still available.
Many thanks, Vicky
Can’t comment on how WDW crowd was but at Disneyland on the Friday Before thanksgiving week …… to me , it had the largest crowd I’ve seen all year and then on Sunday after thanksgiving it was great , nobody was there after 9pm , jumped on 5 E ticket rides before the wife lost her phone on Indian Jones …… could have ridden a couple more rides ………We did find her phone , thanks to the Disney Cast Members.
We just checked out today. Our first park day was the Sunday after thanksgiving, we did 7:30 early entry at MK and it was a literal ghost town. It was great! We noticed the 2pm VQs for both TRON and Guardians staying open well into the night. In fact last night we did the Christmas party and were able to ride TRON twice, one VQ after we scanned into the party at 4pm and then again with the 6pm party VQ. The party last night felt way busier crowd wise than any of our park days throughout the week. Thanks for all of the tips and info you provide here, it’s so helpful and we had an awesome week!
We arrived on 11/27/23 and left on 11/30/23. We took your advice and went to Hollywood on Monday and Magic Kingdom on Tuesday. Both parks had parties on the days we visited. You were spot on! Crowds were low and there were minimal wait times.
We arrived on Monday, went to our room at The BoardWalk, and didn’t get to Hollywood until after 11 am, but crowds were small. We used Early Magic Hours on Tuesday at Magic Kingdom and were able to do 13 rides (Tron, Space Mountain, 7 Dwarfs Mine Train, Big Thunder, Peter Pan, Haunted Mansion, Buzz Lightyear, Country Bears, Philharmagic, Little Mermaid, People Mover, Winnie the Pooh, Small World) before 2 PM. We also stopped several times to get photo pass pictures and had a coffee break with Mickey Waffles. It was a pleasure to easily walk through areas that usually are bottlenecks without having to steer around other guests.
We did Early Magic Hours on Wednesday at Epcot, crowds were small early in the morning, but increased as the day went on. They were still smaller than the usual Epcot crowds.
An added bonus of traveling the week after Thanksgiving is that fewer people are flying. We breezed through TSA at Orlando and at our home airport; our plane was less than half full. We flew Southwest, meaning we each had a row to ourselves.
Thank you so much for your tips – they are much appreciated.
We’ve been in WDW since 11/27 leaving on 12/3 and staying at the “dreaded” Old Key West. Worst crowds are at Magic Kingdom, of course, but we’ve used Lightning and essentially walked on most rides. Got to see the Hatbox Ghost too, although IMO they could have picked a better place for him than the left of the candelabra hall.
I assume you’re referring to Old Key West’s standing on our resort rankings, in which case I will (again) remind you that those are an attempt at objective lists for first-timers and infrequent guests, who do not have the same priorities as WDW regulars or longtime visitors.
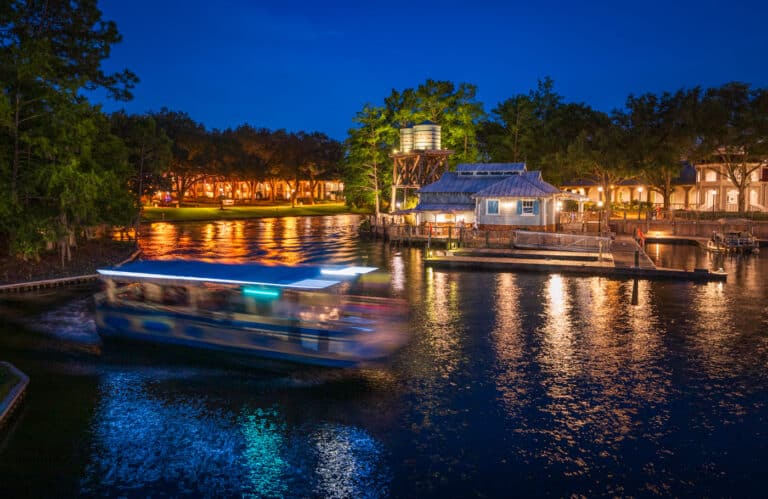
To be abundantly clear, I love Old Key West. I love Olivia’s, the waterfront promenade, the laid back island vibe, Papa’s Den, and so much more. (Here’s a post from a couple Christmases ago about OKW this time of year: https://www.disneytouristblog.com/christmas-comfort-food-old-key-west/) About the only thing I don’t love is the bland look of the redone rooms, but the old ones weren’t great, either. (I wish there was an in-between on the old vs. newish rooms.)
Then again, I love just about every resort at Walt Disney World. While I don’t always think Disney does a great job at operating the resorts, the original designs, grounds, lobbies, restaurants, etc. are largely fantastic.
Hope you’re having a great trip! 🙂