
Disney World’s Busiest Week of the Year By Far!
Happy New Year! It’s officially 2024, but before we completely close the book on last year, we want to take a final look at the week between Christmas and New Year’s Eve, which earned the dubious distinction of being the #1 worst week at Walt Disney World.
This crowd report takes a look at the triple-digit wait times for the entire month of December, entirety of last year, and the last ~3 years to put into context just how bad the week leading up to NYE really was. While this is a fundamentally a recap, our goal is offering insight for those planning Christmas and New Year’s 2024 and 2025 trips to Walt Disney World.
While we’ve done updates on Genie+ selling out over the course of the last couple of weeks that also discussed wait times, our last true crowd report was One of the Worst Weeks Ends & Best Begins for Walt Disney World’s Christmas Crowds. That was on December 1, after Thanksgiving ended and our favorite week of the year at Walt Disney World had begun.
It wasn’t just the week immediately after Thanksgiving that was blissfully uncrowded. That along with the first two weeks of December all ended up having low crowd levels, especially as compared to what followed. Average wait times across the entirety of Walt Disney World ranged from 29 to 34 minutes during that 3-week stretch. We’ll put that into context in just a minute, but suffice to say, those are exceptionally good crowd levels.
It was a similar story prior to that to end October and start November. Average wait times were 31 minutes for both the last week of October and first full week of November. After that came Veterans Day and Jersey Week, which saw a fairly significant spike and a 41 minute average. Then another lull, with another 31 minute average. Then Thanksgiving, with a 41 minute average.
It’s purely coincidental (and a little weird, frankly) that these weeks are all 31/41 minute averages. It’s not normal for the numbers to be that clean, for lack of a better term. Across the board, those weekly wait times are both below average by historical standards and lower than the pent-up demand period seen the last couple of years.
Normally Thanksgiving would see significantly higher crowd levels than Veterans Day, and the week before would be slightly busier. Our suspicion is that Thanksgiving falling earlier than normal might’ve resulted in crowd levels being lower than normal, but that’s just a guess. There are a lot of attendance anomalies in the last few years that defy explanation.
We’ve made this point before, but the key takeaway is that the holiday season is a roller coaster for crowds. Between the start of November and early January, there are no fewer than a half-dozen holidays and breaks that have huge impacts on crowd levels. Some of these are obvious–the weeks of Thanksgiving, Christmas, and New Year’s Eve. Others, like Jersey Week, are decidedly less so.
The very good news is that in between those holidays, there are lulls in crowds. The breaks act as crowd magnets, of sorts, for Walt Disney World. People are less likely to take off of work or pull their kids out of school when a built-in break is just around the corner. This makes the downtime even more pronounced, with the exception of locals and diehard Disney fans who know about the better times and are able to visit during them. (That second part is key. A lot of people have the knowledge–far fewer can act upon it!)
That brings us to the last couple of weeks, which were unsurprisingly busy. The week leading up to Christmas had an average wait time of 45 minutes, making it busier than Thanksgiving or any week of the year since Easter. When you account for the exhaustion of pent-up demand and timing of Christmas Day, that’s about what we expected–maybe a tad lower.
Regardless, we’ve long anticipated that the week leading up to Christmas would be far less busy than the week between Christmas and New Year’s Eve. In part because that’s been the trend for several years. More significantly, because Christmas falling on a Monday–instead of later in the week–made it likely that holiday break crowds would be consolidated into the week between Christmas and New Year’s Eve.
Even with the benefit of seeing wait time data, trends throughout the year, and precedent from the prior year (when Christmas fell on a Sunday–so same idea), the wait time averages for Christmas week were slightly lower than I expected. Again, 45 minutes was the average–I would’ve guessed a number around 47-49 minutes, which is not an insignificant difference.
And this brings us to the week between Christmas and New Year’s Eve. Everything above is aimed at serving two purposes, with the first being preserving a (somewhat) contemporaneous account of this holiday season’s crowd patterns for the sake of anyone planning a 2024 Christmas-time trip to Walt Disney World.
The second purpose is contextualizing just how bad–how much worse than expected–crowds were during the week between Christmas and New Year’s Eve. Some Walt Disney World fans are going to say that this is always the worst week of the year, so the outcome was “obvious.”
The first part of that is true–we predicted that week would be the worst of the year–the second part is not. There are varying degrees of bad and–if you looked at wait times data for the last few years and trends for 2023–it’s unlikely you would’ve predicted it would’ve been this bad.
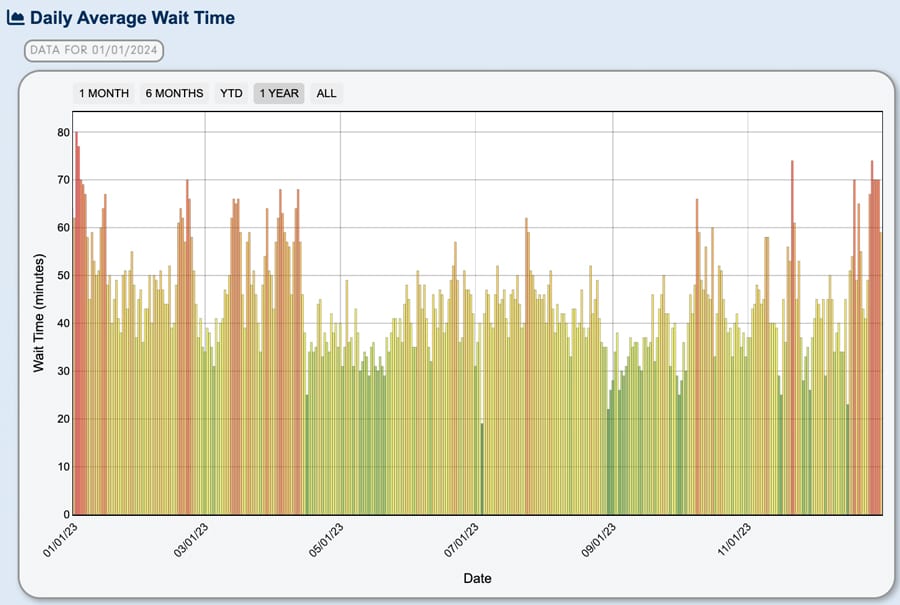
Let’s dig into the data and look at Walt Disney World wait times. As always, all graphs and stats are courtesy of Thrill-Data.com:
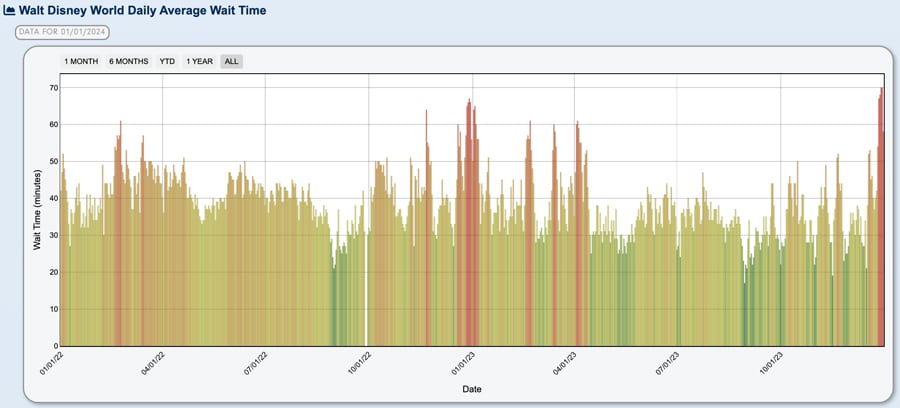
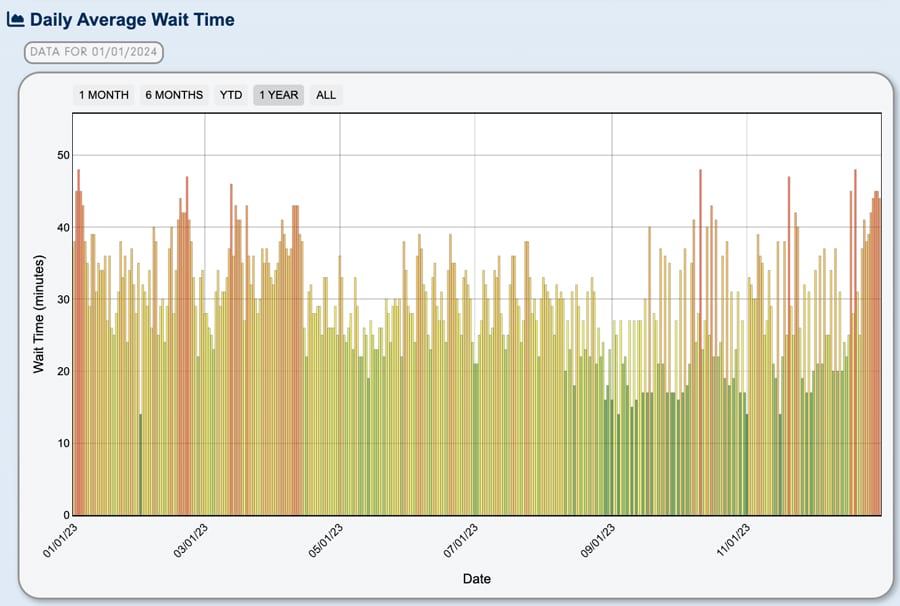
The above graph is condensed and difficult to discern on a daily level, but the point is showing the entirety of 2022 and 2023 crowds on a single graph.
In case it’s not clear, the days between Christmas and New Year’s Eve 2023 (far right) surpassed the graph’s other peak, which is the same days in the prior year. That’s a big deal, especially when you look at the rest of the year. Even at a glance, you should be able to tell that 2023 was less busy on average than 2022.
That’s what the backside of pent-up demand looks like. We’ve been over this countless times and we’re not going to rehash it here, but even Disney executives have conceded that attendance and occupancy have been down, which they mostly attribute to the exhaustion of revenge travel to Florida and end of the 50th Anniversary. This trend has been fairly obvious post-Easter; spring break was really the last hurrah for pent-up demand.
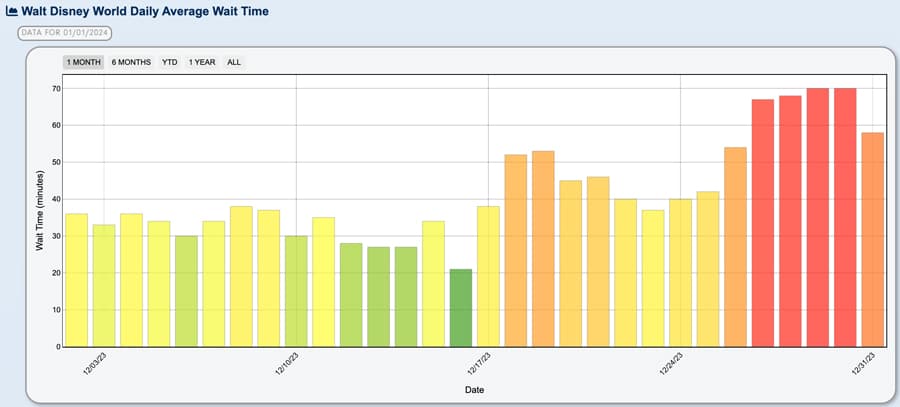
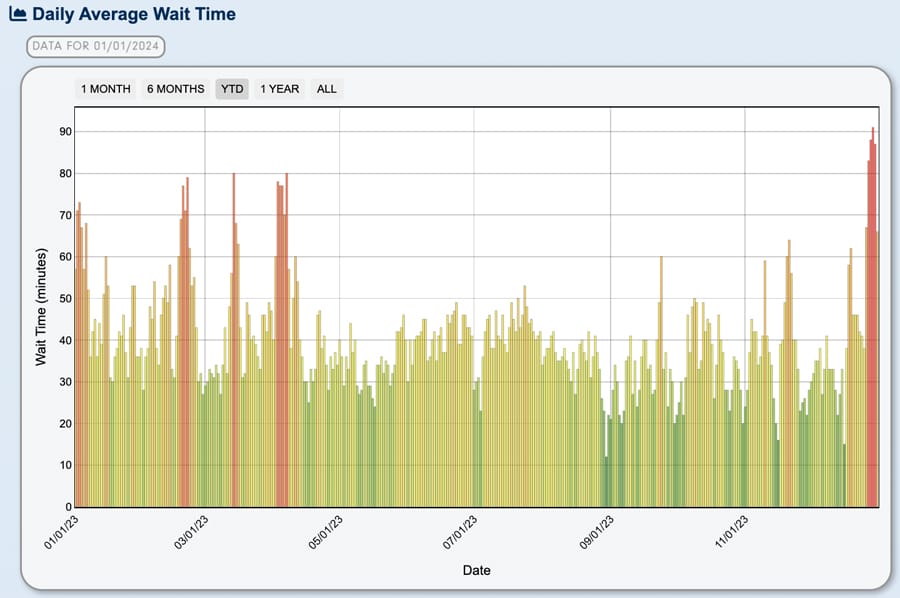
While the year-over-year numbers should help demonstrate why we expected a very busy but not that busy week between Christmas and New Year’s Eve, the above graph of just December 2023 should showcase the difference over the course of the month.
Notably, many of the dates in the first half of the month have average wait times of less than half the 68-70 minute averages of the days leading up to New Year’s Eve. Christmas week was no slouch, but those wait times are downright moderate relative to the week that followed.
With the exception of the last two weeks, this is a pattern that plays out pretty consistently from year to year. The data doesn’t tell the whole story, to be sure, as Christmas brings congestion (higher “feels like” crowds) that aren’t always reflected in wait times. Conversely, there is (usually) more of an effort at crowd control during the peak week (and it helps that people are stuck in multi-hour standby lines), so congestion often is not as bad as expected. Still, the first half of the month is an infinitely better experience than the second half.
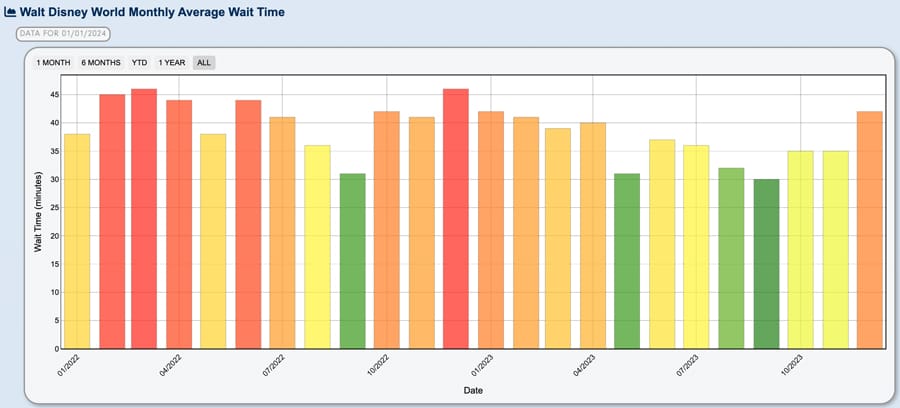
It’s amusing (I think) to look at how December 2023 compares with other months in the last two years. It goes down as tied for the #1 month of 2023, with January.
Despite the New Year’s crowds, it’s still not even close to December 2022. But then again, pretty much no month in 2023 was (aside from January). Again, the exhaustion of pent-up demand should be fairly evident in these numbers. January through April were down year-over-year, but still strong. After that, a pretty sharp drop-off.
Let’s take a quick look at each of the parks:
Magic Kingdom is actually pretty unremarkable.
It did see a solid stretch of very busy days, but there were actually several worse days in October, November and December. Even without cross-referencing the Mickey’s Not So Scary Halloween Party or Mickey’s Very Merry Christmas Party schedule, I’m 100% sure all of those truly terrible crowds were non-party days nestled among several party dates.
EPCOT is…holy cow.
We had expected this holiday season to be busier at EPCOT, between the Disney100 celebration, end of construction (mostly), debut of Luminous, and for the simple fact that people love EPCOT’s Festival of the Holidays. Even with all of that, I wouldn’t have predicted this bad of wait times.
This is essentially a return to 2019 and earlier normal for EPCOT, which was always a bonkers time for the park. It’ll be interesting to see whether this momentum is sustained in 2024 once EPCOT is fully “finished.”
If you look at screenshots of the highest wait times at Walt Disney World last week, DHS dominated. Based on that, you might’ve drawn the informal conclusion that Disney’s Hollywood Studios was the worst park during the week leading up to New Year’s Eve.
The thing to keep in mind about Disney’s Hollywood Studios, though, is that it always has higher average wait times than the other parks at Walt Disney World. That’s due to its top heavy ride roster and insufficient number of “filler” rides (so not stage shows). This isn’t to say that NYE week was “good” or even “not bad” at DHS…it’s just that a lot of days and weeks are bad at DHS, so it’s not quite as stark.
Finally, there’s Animal Kingdom–the biggest yikes of all.
We’ve mentioned before that Animal Kingdom typically sees the biggest swings between low and high crowd levels. Once it reaches a certain tipping point, the lack of attractions is really felt and the park experience basically breaks, for lack of a better term.
You probably saw screenshots of 200 to 300+ minute wait times for Avatar Flight of Passage. Based on scattered reports from social media, those were actually accurate. That was not a record, either–both 2018 and 2019 saw higher numbers. And now you know why they built a bathroom in the middle of the queue!

In the end, December 28-30, 2023 all set new records for the worst day of the post-reopening period…that were broken by subsequent days. The averages on those days were 68 to 70 minutes, beating the 67 minute average of December 27, 2023 that was tied at the time for the busiest day of the post-reopening period (with December 29, 2022).
Not to point out the obvious, but these days were all 10+/10 crowd levels, and the worst average wait times since at least December 2019. That’s right–there wasn’t a single day in 2020, 2021, or 2022 that surpassed December 27-30, 2023. That’s the 4 busiest days in 4 years! Not just the worst 4-day stretch, either. Each of those individual dates were the busiest single days since 2019.
It’s arguably even bigger, or at least more surprising, when put into the context of otherwise decreasing crowds over the course of the last ~8 months. This is precisely why the colossal crowd levels of the week between Christmas and New Year’s Eve 2023 were not “obvious” as some fans might claim. That the week would see heavy crowds, sure. But that week outperformed expectations and trends.
For our part, we predicted peak season plus attendance, with crowd levels of 10+/10 during the week between Christmas and New Year’s Eve. Our expectation was that it would be the busiest week of the year, surpassing both Easter and the first week of January (busy due to winter break). All of those were easy predictions, so we don’t get a pat on the back for any of that.
While I didn’t commit to specific wait time averages, I will admit that I would not have bet on any of those days hitting a 70 minute average. Without the benefit of hindsight, I probably would’ve predicted a 62 minute peak. That’s still a 10+/10 crowd level, but it’s very different from a 70 minute average.
That 10+/10 crowd level not make complete sense, so let’s break that down a little. Currently, a 54 minute wait time is a 9/10 crowd level, whereas 55 minutes is enough to hit the 10/10 crowd level threshold. However, that 70 minute average is still a 10/10 crowd level, technically.
That’s a 15 minute spread–which is absolutely massive–but the exact same crowd level. Nowhere else on the scale (except, I guess, 1/10 since it could theoretically start at 0 minutes–but that never happens in practice) has that range. Usually a crowd level has a range of a few minutes before it moves up or down. Not 10/10. It can be 54 minutes, 67 minutes, 80 minutes, 330 minutes, etc. Hence the 10+/10 crowd level.
The salient point is that there are varying degrees of ‘bad’ crowds and that 10/10 isn’t a static level of awfulness. This is also why fans saying it was “obvious” that crowd levels would be 10/10 between Christmas and New Year’s Eve are missing the point. That it would hit 55 minutes was, indeed, obvious. But 70 minutes? There was absolutely nothing to signal that would happen–and that extra 15 minutes is huge. Something you can’t fully appreciate unless you’re there and experiencing those wait times.
Since we’re documenting this for the sake of planning for Christmas and New Year’s Eve 2024 and 2025, the big unanswered question is whether it’ll get better or worse. It would be stupid for me to make a highly confident prediction a full year or two out, and it’d be even dumber for you to listen to one after reading all of the above about how this year came as a surprise. So I’m not going to do that.
What I will do is point out a few variables. First of all, Christmas Day 2024 falls on a Wednesday, as does New Year’s Day 2025. In past normal years, whenever we’ve seen those holidays fall midweek (Wednesday-Thursday), crowds have been more evenly spread across the two. The week between the Christmas and New Year’s Eve is still busier, but there’s not as pronounced of a difference.
Even though a lot has changed during the intervening years, I think it’s probably safe to say that the fundamental nature of school and work breaks is still more or less the same. Meaning that Walt Disney World might see lower or higher crowd levels in 2024 as compared to 2019, the holiday season crowd patterns should look similar to then, when Christmas 2019 also fell on a Wednesday.
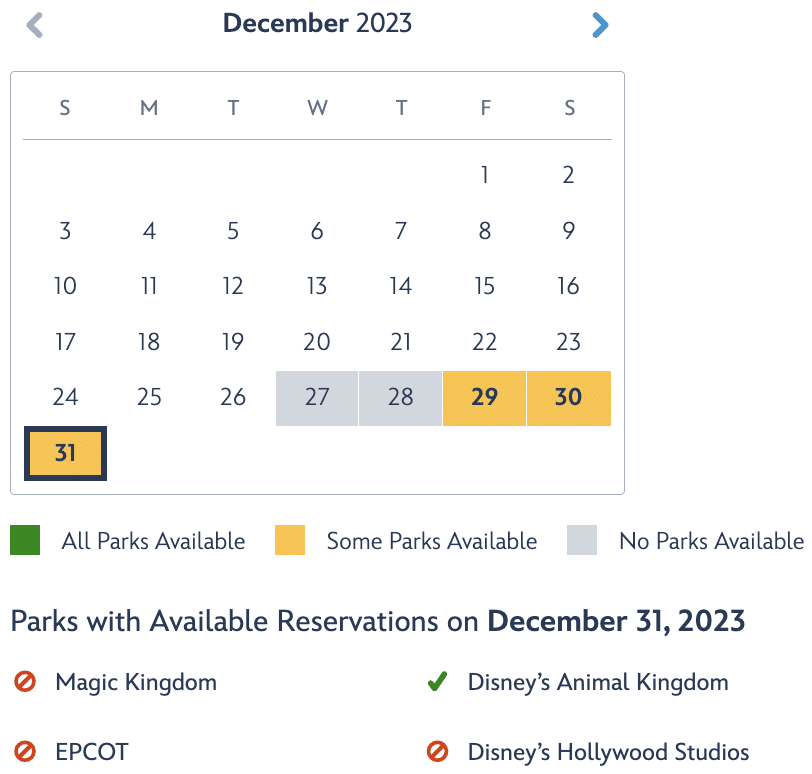
Another consideration is park reservations, or lack thereof. This holiday season was the last with them for regular guests; Christmas/New Year’s 2024 will also be like 2019 in that regard. While this Christmas-New Year’s week was a record-setter, that happened despite all days being at least yellow and several being totally unavailable for park reservations.
In other words, crowd levels could’ve been even worse absent reservations. It’s impossible to say how many people were turned away during the last week, but the number was not 0. For several parks and days, there was nothing over a week out. Although you all know to plan far in advance of that, many average visitors do not. Could the average have hit 72 minutes or more absent reservations? It’s certainly possible.
Phased closings operate in a similar manner, but they’re not the same. The parks running out of reservations means tickets aren’t even available for purchase; phased closings mean certain guests have to wait before the gates reopen–or they’re redirected to Animal Kingdom or EPCOT. The thresholds are also different for capacity closures versus reservations.
Beyond that, there are also unknowns about the broader economy, what Walt Disney World will do to celebrate Christmas 2024, the year’s marketing campaign, special offers, attraction openings and entertainment offerings, and so much more. Just a small sampling of specifics that could move the needle one way or the other:
- Tiana’s Bayou Adventure opening in June/July rather than November/December
- Free Dining being offered in November through the week before Christmas
- Cinderella Castle Dream Lights returning
- An ‘echo’ of pent-up demand (meaning that a lot of semi-frequent Walt Disney World fans visited in 2021-2022, skipped 2023, and return for 2024).
I’m not saying any of those things will happen–I have no clue–but any of them could occur, which would move the needle on crowd levels and wait time averages.
With all of that out of the way, there are a few predictions I am willing to make:
- Our favorite week of the year in 2024 will be significantly less busy than Christmas week or New Year’s week (obviously)
- The first half of December 2024 will have far lower wait times than the second half of the month (also obvious)
- Christmas week will be busier than Thanksgiving week in 2024 (pretty likely)
- New Year’s week will be busier than Christmas week in 2024 (also pretty likely)
- Christmas and Thanksgiving weeks will both be among the top 5 worst weeks (it’ll be close)
- New Year’s week will be the #1 worst week of 2024 (seems like a given, once again)
Do with that information what you will for planning purposes, assuming you actually can put it to use, and aren’t limited in when you visit during the holidays, like the vast majority of people. As always, see our 10 Best & Worst Weeks to Visit Walt Disney World in 2024 and 2025 to choose the best dates and avoid the worst.
Even if you aren’t limited in travel dates, you still might want to consider Walt Disney World for New Year’s. We’ve spent almost every NYE in either Walt Disney World or Disneyland since 2011, but had to skip 2023 (new baby); we very much missed the experience and are ready to go back. Our circumstances are somewhat unique in that we don’t mind not doing many attractions. Even if you’re an infrequent visitor, there’s still something to be said for the excitement, spectacle and communal feeling of being there for New Year’s Eve. We cannot wait to do it again!
Whether New Year’s has days in 2024 with average wait times above 70 minutes…I honestly have no clue. If two time travelers showed up at my doorstep today and one claimed that the peak day was “only” a 60 minute average and the other told me it was an 80 minute average, I wouldn’t know who to believe. The first seems a bit too low; the latter a bit too high. But the point remains that a 20 minute swing is within the realm of possibility, and that both of those would be 10+/10 crowd levels. Happy New Year!
Planning a Walt Disney World trip? Learn about hotels on our Walt Disney World Hotels Reviews page. For where to eat, read our Walt Disney World Restaurant Reviews. To save money on tickets or determine which type to buy, read our Tips for Saving Money on Walt Disney World Tickets post. Our What to Pack for Disney Trips post takes a unique look at clever items to take. For what to do and when to do it, our Walt Disney World Ride Guides will help. For comprehensive advice, the best place to start is our Walt Disney World Trip Planning Guide for everything you need to know!
YOUR THOUGHTS
Were you at Walt Disney World for the week between Christmas and New Year’s Eve? What was your experience? If you’ve visited during the same week in the past, how did it compare? (Please specify whether your frame of reference is pre-closure or post-reopening.) Thoughts on our analysis for this week in 2023 or looking forward to 2024/2025? Do you agree or disagree with my assessment? Any questions we can help you answer? Hearing your feedback–even when you disagree with us–is both interesting to us and helpful to other readers, so please share your thoughts below in the comments!


Tom – no Spinal Tap joke, turn it up to 11? Hope the baby let’s you sleep soon!
The interesting is throughout the whole period they raised Genie+ prices and it never sold out. Meaning the big price did actually stop families from buying it.
They dropped the price today and it sold out at MK. You could tell Genie+ inventory went faster too.
We were there from Dec. 20-Jan 1 and loved it. We got on absolutely everything we wanted to and then some—rides we didn’t have on our must-do list but were open with short wait times. We had a party of 10 ranging in ages from 7 to 74 and all had a great time. Especially New Year’s Eve at Epcot. The only issue we heard from anyone were people staying off property who couldn’t get lightning lanes for avatar or rise because they were already sold out by the time the parks opened from the 29th-2nd. But those staying on property had no issue. It was truly magical and an amazing vacation.
Magic Kingdom on the 28th was very doable, with a midnight close. We walked on Small World after fireworks, Pirates was only 30 minute standby at noon. From dinner time on, we focused on rides, using the LLs we had stacked. Jingle Cruise was 10 minute standby at 6pm! The Disney gods were on our side!
VERY surprised to see the price of Genie+ drop down to a high of $29 this morning!
It’s January 1 and we have been in the Magic since Dec 28 staying at the Dolphin our favorite hotel. We are in our 70’s and have been coming the week between Christmas Snd New Year’s for almost 30 years. We come other times as well but we love the excitement of the holiday. Because we have been many times we don’t feel the need to do everything in the park so ou strategy is to be there before rope drop and back at the Dolphin collecting a fabulous milkshake at the Fountain by 11. It didn’t seem any more crowded than usual but then compared to the millennium of1999 nothing has ever come close. I was very disappointed in Epcot firework which did not really have a show at midnight but just a count down. Are they saving money? They did not repeat the 6:30
Show Do you know what’s up with that?
My family and I were there from 12/20-12/29, and up until 12/28, we were able to have wonderful experiences that didn’t feel overwhelmingly crowded. Rope drop was incredibly effective, as was spending our time at MK on party days. We also booked all of our must-do restaurants in the first hour of the 60-day mark for our first day.
On 12/27 we had a great time at HS in the morning from rope drop to about 10:30 am, took a break, and park-hopped to EPCOT since we got a late afternoon predicted virtual queue time for Guardians.
12/28 got off to a promising start — it was pouring rain, but we were in line for the Avatar ride by 7:40 am and the cast member told us it was 50-60 minutes from where we were. We thought it would get worse all day and had a big dragon fan in the party, so it seemed like a good use of time. Unfortunately, there was a partial breakdown and the ride operated at diminished capacity, which they announced around 8:30am. We did not realize how far we were from the front of the line or I might have bailed then. We actually got on the ride at shortly before 10:30 am. All of us had sore feet, sore backs, and although the 3 hours were enough time for our socks and shoes to dry, they got wet again as soon as we left the ride. I went back to the hotel and enjoyed the animals and the ambiance for the rest of the day. Most of the rest of the party went back out, even though Extended Evening hours at AK did not seem to reduce the wait times below 90 minutes for most of the interesting rides.
The only other obvious sign of crowds that we weren’t able to work around was that between 4 adults and 3 teenagers, we were never able to get on the Tron virtual queue, in spite of staying on property and setting alarms. We managed to get on Guardians of the Galaxy on our second-last day at around 4:45 pm.
I am commenting to say what a very well written article this was!!! No bait and reporting nonsense info. My husband and I are ” Disney Adults” . The best part of getting older is retirement and now getting to use our APs when it’s not hot as the sun or during those very busy weeks. We did that with our children for 25 years.
In 2023 we visited 5 times from New York.W we went in Nov and Dec
Each week we did different parties and different holiday activities. It truly is the
most amazing place for the Holidays!!!
Thank you again for the well written post.
Is it possible the explanation for the higher average is due to Genie+ selling out consistently. So it feeds upon itself: people see it sells out, see the averages so they buy it before seeing if they need it selling out at more parks. Then the maximum possible capacity is allocated for G+ users at all parks (even DAK, where it sold out every day, maybe for the first time?) pushing standby times higher.
I think last year G+ was not sold per park, only as a bundle? Is it possible they were able to sell more and it spiraled out of control?
Interesting. Lots of people, another in-house hotel coming, and essentially less to do in the parks for the forseeable future. For example, two closures coming soon in AK with no real hard opening dates for replacement attractions.
1) On days like this, it’s not really the on-site hotels that move the needle on crowds–it’s the off-site ones and total hotel capacity across Orlando.
2) Define “soon” 😉
Good Morning Tom.
Because of length I know this will come up for your review and I really dont care if it’s published or not. Just want to comunicate a few things.
Dinosaur and It’s Tough Being a Bug are scheduled for permanent closure early this year. I believe Kali River Rapids is doing its seasonal closure as well. I cannot agree that onsite accommodations like the new DVC highrise at the Many Knees Resort (Couldn’t resist that one: Poly Kneesian- Many Knees – Oh well.) won’t contribute to more bodies through the gates. Ya got more rooms, ya got more people, unless of course the economy takes a serious nosedive. Because I travel heavily I have close to a million off-site hotel points not to mention airline miles. I’m also DVC. Our usual Modus Operandi if we dont drive down is to fly into either MCO or, if I want to use my own ship, ISM. As Disney has a wonderful reputation for not having DVC rooms ready anywhere near your requested check-in time, we usually use hotel points to stay off site first night. We don’t hit a park on our first day so it doesn’t matter where we stay. Unlike other places in the country, we have never had a problem booking into the offsite hotel of our first choice just outside Springs on the spur of the moment for that first night. Ever. Even using points, rooms of which are severely limited by the venue, usually to five percent or less of total racks. Wouldn’t you think that if off-site rooms were in such high demand that they, being much cheaper than Disney venues, would fill up faster? With regard to expansion, Disney’s capital investments in WDW over the past several years have been poor. Offhand, I can only think of one totally new attraction, that being Tron. The rest, like Tiana’s Unnecessary Adventure, are all rethemes or replacements of attractions like Splash Mountain or Ellen’s Energy Adventure with Guardians / Cosmic Rewind. Even the long remake of Epcot has generally resulted in nothing more than additional places for people to spend cash. This is a very long-winded way for me to say that Disney would rather manipulate crowds than relieve them with expansion or new attractions. I find it interesting to read posra about how people are so happy to have gotten in X number of rides by planning their whole day, even their entire visit, around maximum efficiency and mobility. That’s not my idea of a good time, adds nothing to my vacation. We’ve been coming to WDW since 1973. Stayed at Shades of Green then. Later participated in the soft opening of the Grand Floridian. Have fond memories of the old Grand Plan. Wife even gave a quick riding lesson to some clueless actress they stuck on a horse on the beach for a live episode of Regis and, I think it was Kathy Lee. Regis said hello to me in the Floridian. My response to my wife was “Who the hell was that?” Anyway, I enjoy your posts very much even if, on many occasions, I don’t agree with you. I guess I just operate in a different, older time zone than the younger families who now populate Disney. Another long-winded way of saying that I’m not going to alter my idea of a Disney vacation to satisfy some corporate bottom line. Disney has obviously established a “New Normal” for its parks and is busily educating people to fit into it. Not gonna play, and if it becomes too odious, I can always sell my DVC points back to Disney and come far less often. I guess AK’s Dinosaur isn’t the only relic of the past that may end up closing!
Best to you and the family!
Jack
I just got back, I was there from 12/23-12/30.
So some direct personal feedback:
While crowds were insane, I suspect increase allotment to Genie+ is the biggest factor in increased lines, compared to 2022. If, in 2022, 85% of capacity was allotted to Genie+, but in 2023, 92% was allotted to Genie+.. then standby lines will increase significantly, even if attendance remains the same. It appears there was far more Genie+ availability in 2023 than 2022, supporting this hypothesis.
Anyway — Now my personal experience. We bought Genie+ 5 out of 7 days. We did NO rope drops. We never really arrived in a park before about 2pm. We stacked Genie+, and did a few individual lighting lanes. On out 2 non-genie days, we did less attractions more casually. Ultimately, despite the insane crowd levels, we got to enjoy almost every attraction we wanted to (with a couple exceptions as per below).
Day by Day:
Saturday before Christmas — our flight arrived in the afternoon, we planned evening in Epcot. I had been stacking Genie+ since the morning. We had Remy and Soarin before dinner, Test Track and Guardians of the Galaxy after dinner. I had just missed getting a Genie+ for Frozen, oh well.
Sunday — Christmas eve — Magic Kingdom. Stacked Genie+, arrived around 2pm. With Genie: Did Haunted Mansion, Peter Pan, Pirates, Big Thunder Mountain, and Dumbo. My kids did Tron with ILL, while my wife did Cinderella meet with genie. Also after fireworks, did Small World as a a near walk on. For the most part, crowds largely cleared out of Magic Kingdom after fireworks. We also took an early evening break for dinner at Citricos. Did Watched the 3pm parade. And we watched fireworks from Frontierland. So we got a LOT done between 2pm and 9pm. No waits for anything.
Monday – Christmas -night — Return to Epcot. No Genie. Planned to use extended evening hours, but..
Before evening hours, we spent time in the Seas aquarium, we did the walk through at Moan’s water journey. Watched fireworks. At the start of extended hours, we to Frozen, but the ride went down. My kids went to Guardians (with the 6pm queue). Adults opted to leave the park, but first did Remy as a walkon. Yes, despite it being Christmas, extended evening hours were very peaceful.
Tuesday — DHS — Stacked and arrived early afternoon. Genie was VERY effective. Did Rise of the Resistance with ILL. With Genie+ — Got passes for Smuggler’s Run, Runaway Railroad, Tower of Terror, and Toy Story Mania. My kids got Rock N Roller Coaster instead of Runaway Railroad but the right went down and they did TOT a second time instead. We did Fantasmic with the dinner package. We missed our TSM return because dinner at Brown Derby took 2 hours with awful service. We could have done more things after the early show of Fantasmic but opted to leave.
Wednesday — Back to Magic Kindom, without Genie, just for some casual time. Did Country Bears and Mickey’s Philharmagic without waits. My kids did Tron with ILL.
Thursday — Animal Kingdom, 2pm arrival. Now felt the crowds really getting bad. Bought Genie+ and ILL for Flight of Passage. This was the first time that effectiveness of Genie+ was marginal but got the 3 attractions we wanted — Safari, Navi River, and Everest. Then Everest went down, got an anytime. Adults ended up using the anytime for an extra showing of the Lion King. Everest came back online, kids went there.
There was essentially no availability for a 4th genie at 2pm. And our only line of the week: The Lightning lane return at Navi River was still about 30-40 minutes, WITH a Genie pass.
We were getting tired, opted not to stay for extended hours. It appears crowds and lines very quickly dissipated into the extended evening hours.
Our last day — Friday 12/29 at Disney Hollywood Studios. 2pm arrival, with Genie+. Not bad, but not nearly as effective as earlier in the week. Got Genie+ for Smuggler’s Run, Runaway Railroad, (my kids wanted Rock n Rollercoaster but it was sold out by 10:30am), Toy Story Mania and Star Tours. Got on line for Indy stunt show, but the performance filled up. Saw the Mickey picnic movie, saw Frozen Sing Along. Ate at Sci Fi Dine in (Fast service and quick meal). Left the park by 8pm.
Overall, Genie+ was not cheap but it saved us a lot of time in line. Look at it as “per attraction,” we were paying about $8-$12 per attraction, saving between 30 and 200 minutes in each attraction.
So despite the Christmas crowds, was able to do multiple premium attractions per day, plus lots of other non-premium, all without stressful rope drops, without burning the midnight oil. We never waited for the Skyliner (we stayed at Riviera.. we did not leave Epcot immediately after fireworks). Busses were efficient when we took them. Biggest annoyance of the Christmas crowds was jammed pathways. And don’t even consider watching Magic Kingdom fireworks from in front of the castle.
But with good planning and willingness to invest in Genie+ / ILL, could really get a lot done without huge stress.
This was my first ever Christmas as WDW. I thought it would be one and done. But honestly, I think I’ll do it again in a couple of years.
Thanks for that extensive firsthand report–very much appreciated. It’s particularly interesting for me as a potential glimpse into our future–so I’m glad to hear that your conclusion was still that you’d do it again in a couple of years. We currently love NYE at WDW, warts and all…and hope to continue loving it.
Interesting hypothesis about LL allocation/capacity and the impact on crowd levels. While neither of us having any way of proving or disproving this, I’m skeptical. The trend you’re describing started around late Feb/March, and crowd levels have pretty consistently fallen in spite of that. It strikes me as odd that NYE would be the one exception to that, and even Christmas week wouldn’t. I’d be more persuadable as to that point if, with the $39 price point came much better LL availability, but that didn’t seem to be the case. But again, no way of knowing for sure–it just doesn’t seem to me like a variable that changed last week (and only last week).
We went to Disney October 14-18 and the wait times were really high, for example 80 minutes for Frozen Ever After and Peter Pan. We reluctantly ( I hate paying extra) used Disney Genie every day. I would not go in October again.
I’m starting to wonder how much overflow of the holiday crowd will be there in January instead. MK will be open until 11p a few nights we’ll be there this month! Without park reservations, I’m curious how they’re predicting which parks will be so busy as to warrant extended hours. I’m crossing my fingers that all will be well!
The biggest issue we had was ride closures due to break downs or late openings of rides during early Magic. Yesterday at Magic kingdom both space mountain and 7 dwarfs opened late. Space
Mountain after the end of early Magic. We were on Buzz lightyear and it broke down. Then went to ride BTM and it broke down while we were in line and they made everyone exit the line. In the last 2 days we were on rides that broke down on us on the ride on 5 rides! All in all this was what was frustrating.
We were still able to accomplish what we wanted with Genie+ and lightening lane. We were able to ride Tron and Guardians, as well as watch the fireworks shows at Epcot and Magic Kingdom on New Years Eve!
We were one of the MANY visitors between a Christmas and New Year’s Eve, and while the crowds were as bad as you describe, it was still possible to have a great time and get on most of the attractions if you did the following (and you describe so well on your website)
1) Rope Drop at Early Opening for Disney resort guests
2) Buy Genie+ and have a plan in which attractions need priority (either due to wait times or family preferences)
3) Take a break midday and don’t push yourself. It’s impossible to ride everything in one day with these crowds. Figure out your priorities and plan accordingly.
We had a blast and I want to thank you for the wealth of information on your website that helped us have a great time.
We managed to achieve a ton of rides and entertainment between Christmas and new year by getting up early, we’d then leave late morning to enjoy quiet resorts at Wilderness Lodge and Beach Club before wandering back for virtual queues and evening entertainment. Worked out brilliantly for us and certainly hasn’t put me off coming at this time of year, if anything this experiences makes me more keen to return!
We also haven’t used genie, genie+ or ILL
I’m writing this while taking the bus back to CSR from MK on Jan. 1. I have pictures on my phone of us in super low crowds on this day pre-closure. For example, the area in front of the castle would be practically empty. I was shocked at how busy MK was today, even first thing in the morning. The walkways were very crowded with people, wait times were relatively high, BUT, the lines for food and bathrooms were very short, which was a blessing. We are one of those families that can only come here during school breaks, so we come with the attitude that it’s going to be very crowded and we build in resort time every day so we don’t get burnt out. Happy New Year!
Phew. I went. I survived. It was… dare I say it… still magical in its own way?! But I don’t want to do it again lol.
We spent Dec 23-25 and Dec 30-31 at WDW this year (and we spent Dec 27-Jan 2 at the parks last year).
23-25 was mostly a pleasant surprise (I was expecting absolutely terrible), and especially with the cold weather and extended evening hours (and giving Disney a lot of extra money for G+ and ILL), we were able to ride several headliner coasters on Christmas (including 3 rides on GOTG, as well as knocking out both coasters at DHS). On Dec 23, Animal Kingdom was practically a ghost town after 3pm, I suspect a lot of people bought tix hoping to hop elsewhere. I regretted that we had to leave at 6 for dinner reservations. Dec 24 at Epcot wasn’t low crowds, but it didn’t feel too miserable. We booked a Behind the Seeds tour to help get away from the crowds for a bit.
The 30-31 was a different story. G+ and ILL went extremely fast and the crowds seemed heavy (enough that it’s hard to navigate walking quickly with a family of 5). We started NYE at DHS because we didn’t get reservations for EPCOT before they sold out—and it was unfortunate because MNMRR was down most (if not all) of the day, they weren’t selling G+ at all as far as I could tell, and it put even more pressure on the rest of the park. I was worried we won’t be able to hop to EPCOT, but they appeared to be letting people in all night. We love watching fireworks around the world with our kids on NYE, but we were both completely exhausted by 9pm last night.
We are planning to visit WDW again next year, but not the week between Christmas and NYE.