
Disney World’s Good Times (for Spring Crowds)…Are Ending?

Following the peak winter week last month, Walt Disney World visitors have enjoyed some good times thus far in March 2023. This crowd report shares recent data, thoughts on what’s likely to happen next with attendance levels during and after Spring Break, and just how slow the last couple weeks have been in the parks.
Historically, March has been a ‘tale of two seasons’ at Walt Disney World, with peaks and valleys–high highs and low lows. That’s why we’ve identified early March as one of our favorite times to visit (it’s routinely one of the top 4 weeks of the year) in our Best & Worst Months to Visit Walt Disney World. In the last two years, this dynamic hasn’t been quite as pronounced, but a lot of normal trends haven’t played out during that time.
There were the typical roller coaster crowd levels as recently as March 2020, and I don’t mean before and after the parks closed. Although, obviously, there were fewer people in them starting March 16 of that year. Maybe 2019 is a better example, when the month started out slow (like 2020) but then spiked for spring break. So, how have crowds been in March 2023 so far? Let’s take a look…
As always, what’s covered in these “crowd” reports is actually posted wait time data that’s pulled from My Disney Experience and compiled into graphs for tracking and comparing various days, weeks, months, and years. A lot can be gleaned from posted wait times, but it’s not necessarily conclusive of in-park congestion or crowds.
There are several other variables that impact “feels like” crowds, from the start of the 2023 EPCOT Flower & Garden Festival to weather to guest demographics to ride breakdowns to operational efficiency to time of day or day of the week. And that’s just a partial list! Beyond that, wait times are often inflated–but at least there’s usually consistency in the inaccuracy, if that makes sense.
In short, wait times are an imperfect measure of Walt Disney World’s raw attendance or crowds–which have increased by several million people over the course of the last decade-plus. With that out of the way, let’s dig into the data and look at Walt Disney World wait times. As always, all graphs and stats are courtesy of Thrill-Data.com:
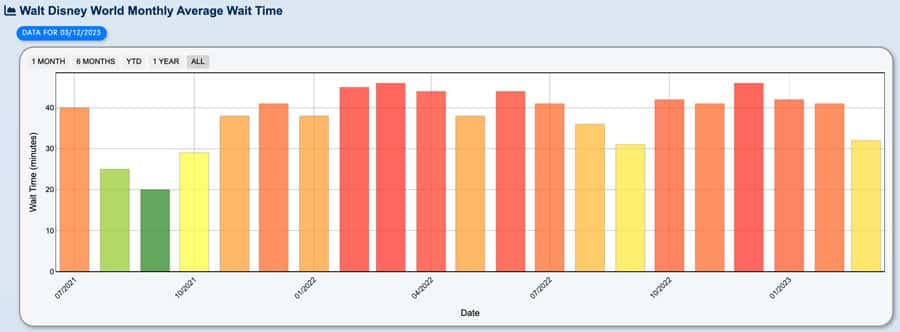
We’ll start with the monthly numbers for Walt Disney World as a whole.
While I love to overanalyze wait times data, this pretty much tells the whole story. I won’t bury the lede: 90% of this post boils down to this one chart. Through the first 11 days of the month, March 2023 is only 1 minute busier than September 2021, which was far and away the slowest month of last year. Early fall off-season crowds but with early spring weather?! Sign me up.
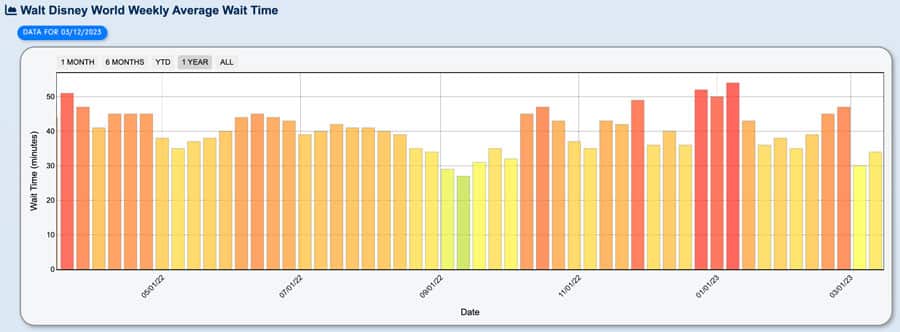
If we break it down by week, it shows pretty much the same thing. For the most part, the first two weeks of March have been significantly slower than the last 3 weeks of February.
The beginning of this month has also been better than the slow weeks of January, which is interesting. With that said, this chart actually doesn’t tell the full story, as many of those weeks encompass busy and slow dates. So let’s look at the dailies…
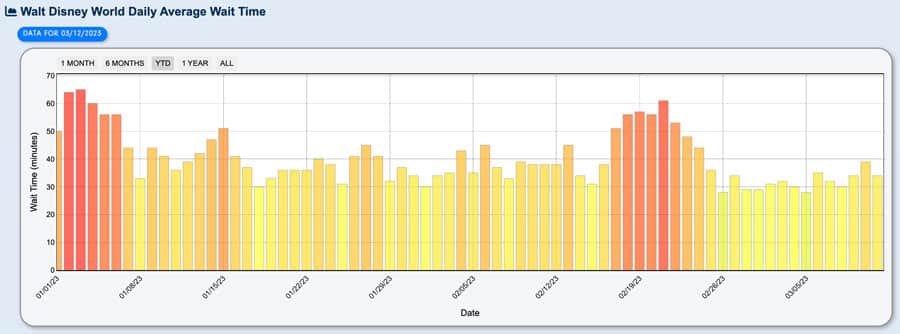
This is a bit more useful, and it shows that wait times actually started falling in the second half of Mardi Gras week and into the Princess Half Marathon Weekend. By that Sunday, wait times had bottomed out at 28 minutes on average, for a 1/10 crowd level.
Average wait times have been around that since, only increasing in the last few days. Still, most days have had averages at or under 30 minutes, and the highest crowd level has been 5/10. It has been a remarkably good stretch for visiting Walt Disney World!
These graphs look very similar to those from 2019 or 2020. I know I joked above about the second half of March 2020 falling further than this, but obviously, that is not how things would’ve played out in the absence of the closure. That winter had been busier than ever before the early March reprieve, and spring break would’ve likely been even worse. Suffice to say, you might want to file these charts away for when you start thinking about the timing of your 2024 Walt Disney World vacation. The last two weeks are probably not an anomaly, but rather, a return to normal.
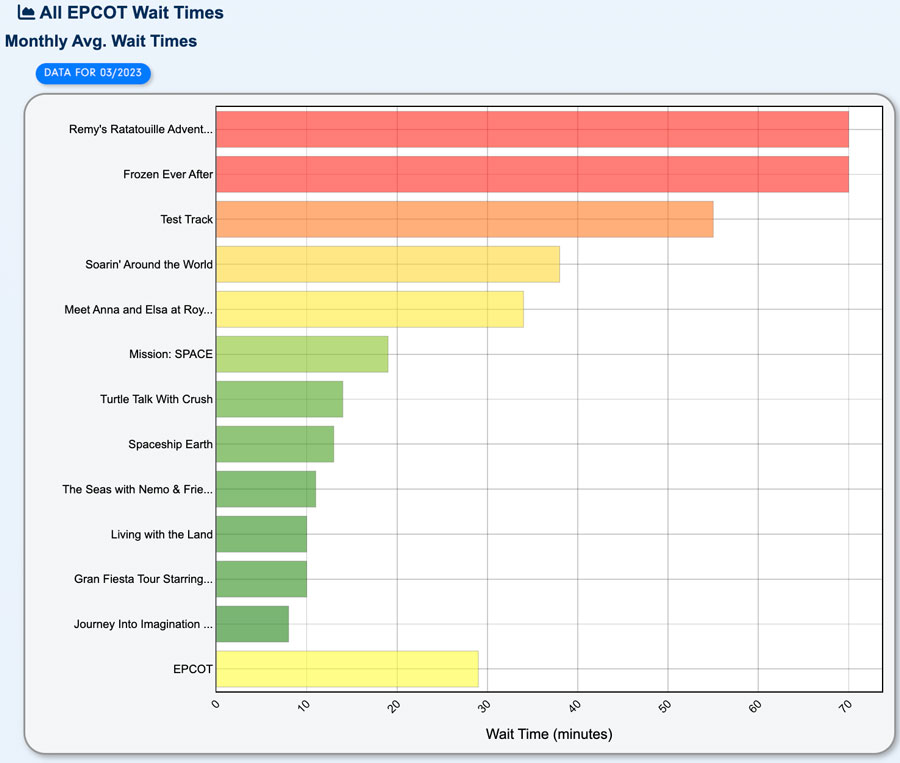
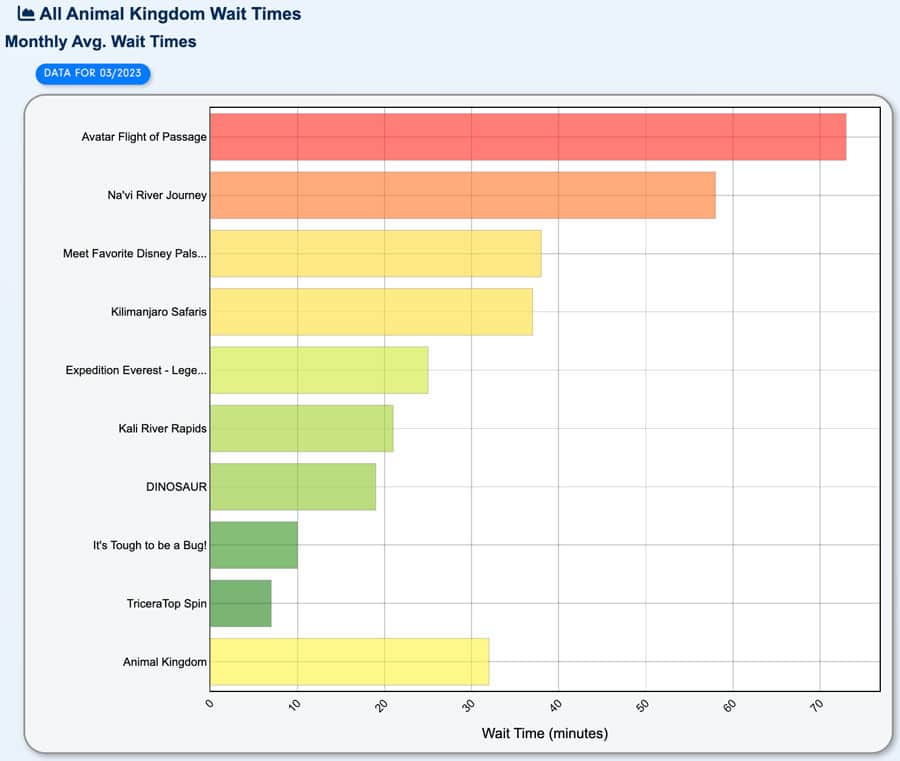
When crowd levels are this consistently low, the individual parks don’t really add anything, so I won’t waste your time with needless commentary. Nevertheless, here are those numbers for those who want them:
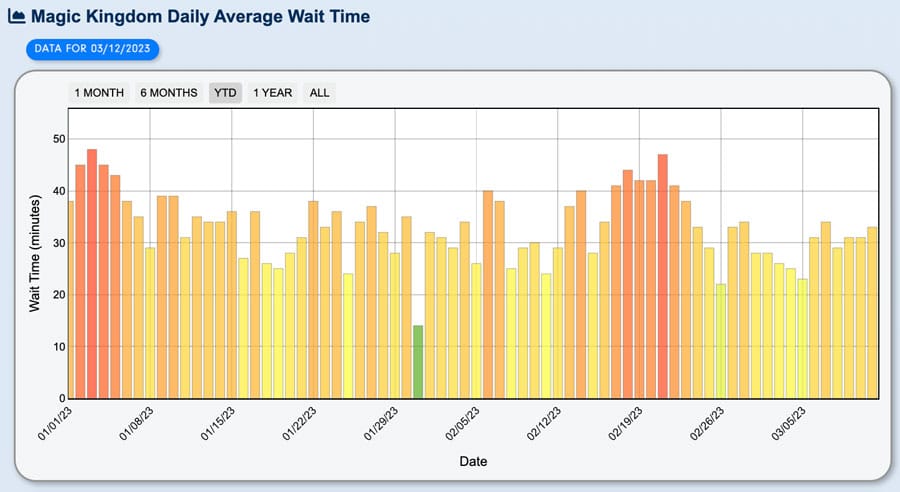
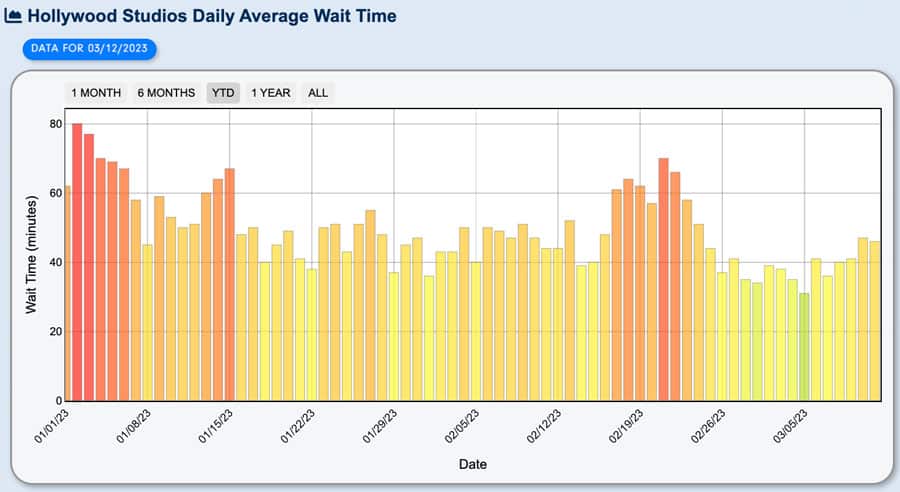
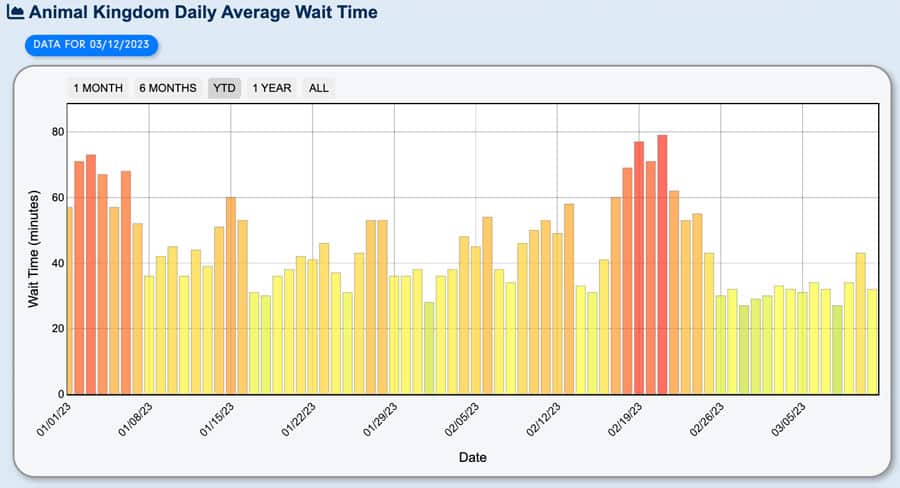
For the most part, what you see is what you get with the per park crowd levels. Wait times spiked leading into and out of Presidents’ Day, but fizzled out toward the end of that week, falling from moderately high on Thursday and Friday to flat-out light levels on Sunday. They’ve stayed in that range ever since, only increasing in the last few days.
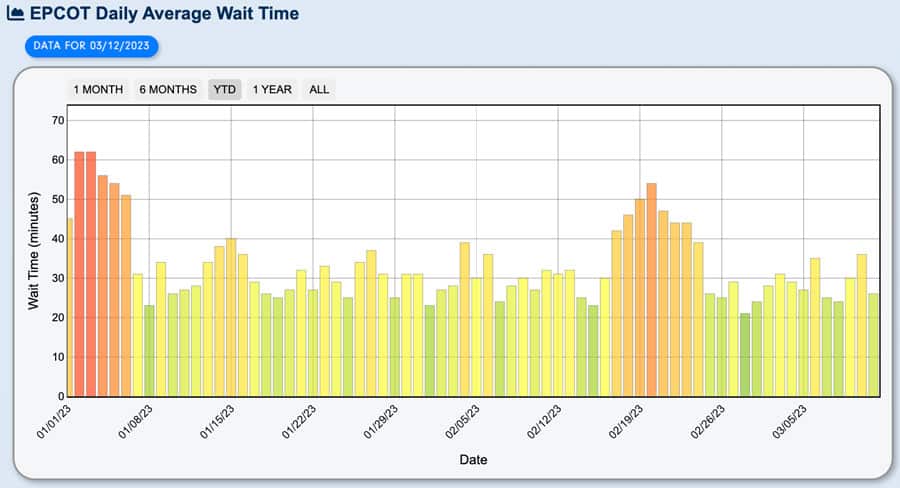
As always, EPCOT is the one park where what you see is probably not what you get. If you visited on February 21, you would’ve encountered wait time levels that amounted to a 9/10 crowd level, but you also would’ve missed the end of Festival of the Arts by one day. If you visited on March 1, you would’ve been there for 2/10 crowd levels according to wait times, but also the start of the 2023 EPCOT Flower & Garden Festival.

I would be willing to bet that if you asked 100 people to walk around EPCOT on both of those two days, and never had them do attractions or look at wait times, the majority would say March 1 was busier. More than any other park, EPCOT is the locals’ park, and that’s evident in scenarios like this.
If you’re a tourist focusing on attractions, you still would’ve enjoyed low wait times, to be sure, but you would’ve felt much more congestion than the crowd level suggests. There’s no good solution to this discrepancy, other than pointing it out. This does happens at the other parks to some extent, but not to nearly the same degree as EPCOT.
Now let’s turn to the average attraction wait times for the month of March 2023 thus far:
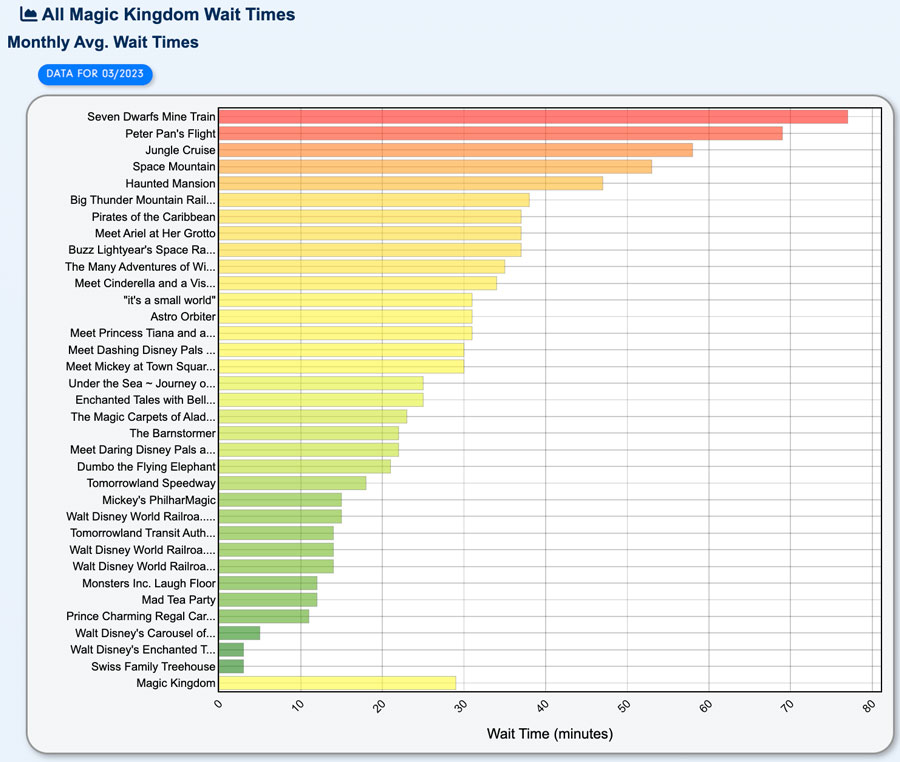
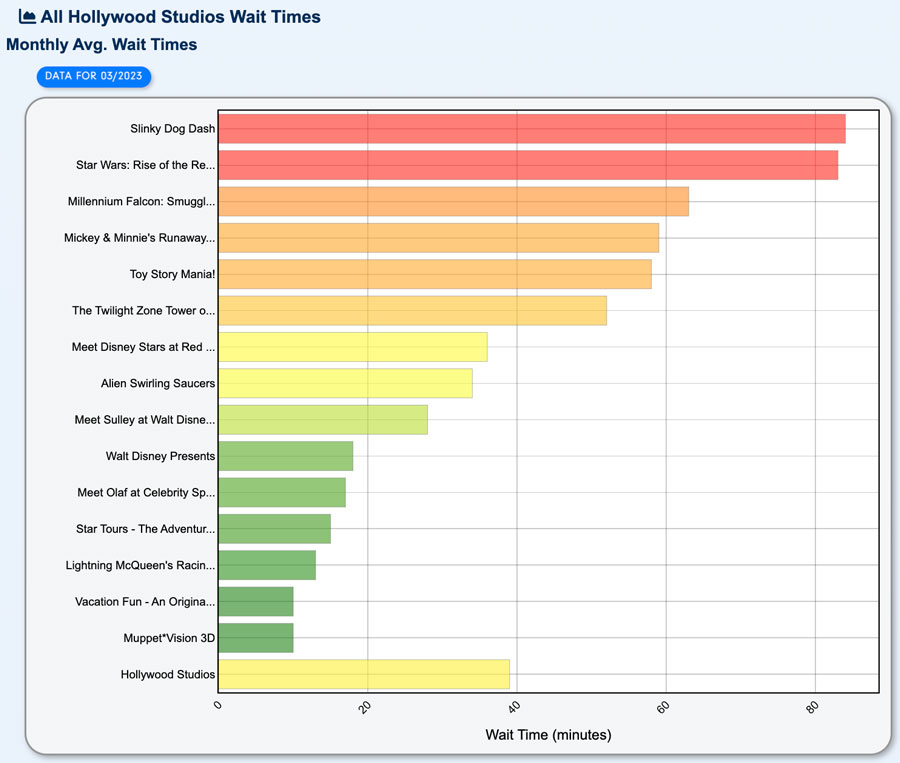
A few things worth calling to your attention here. First, we now have more wait times data for both Enchanted Tales with Belle and the Ariel’s Grotto meet & greet. The latter has been a Lightning Lane that books up fastest most days, and that might lead you to conclude that it’s high priority. The average wait times say otherwise. That’s reflected in our updated Magic Kingdom Genie+ Rankings.
Similarly, the Adventurers Outpost Minnie & Mickey Mouse meet & greet at Animal Kingdom (#3 on the list above) continues to be popular, and now ranks above everything outside Pandora. Remember, these are averages over the course of the entire day. Do this before 11 am and there’s a very good chance your wait time is under 15 minutes. (I’ve seen it as a totally empty queue on multiple occasions.)
Finally, the Tower of Terror stealth refurbishment is over, so that attraction’s average wait time is in freefall. This is also reflected in our updated Disney’s Hollywood Studios Lightning Lane Rankings. In general, we’ve noticed Genie+ getting much easier to use at DHS. It’s difficult to tell whether this is a temporary phenomenon due to current crowd levels, or the supply/demand dynamic has changed. We have some testing to do there this week…
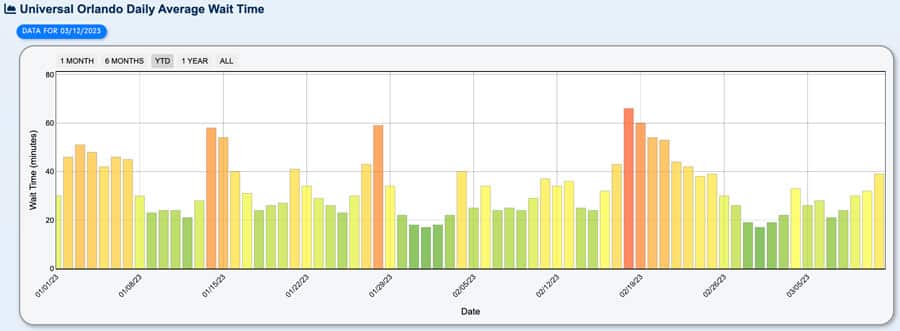
For those wondering how Walt Disney World’s wait times compare to Universal Orlando, the trend is about the same for late February through mid-March 2023.
I wouldn’t be the least bit surprised if there’s a divergence during this upcoming week. Universal Orlando’s Florida resident ticket deal doesn’t have blockout dates for Central Florida spring break, meaning that more locals could choose Universal as a staycation option. But in all likelihood, both theme park complexes will hit high crowd levels.
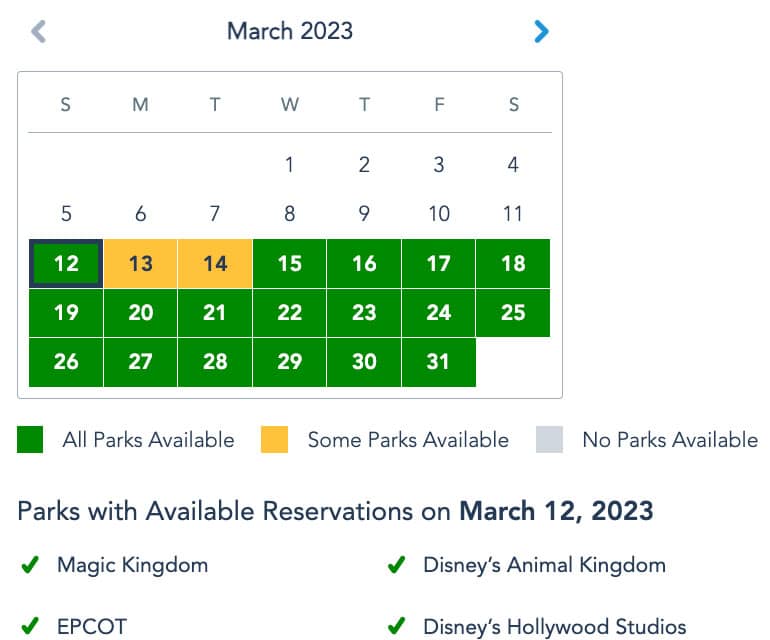
Looking forward, I’ve gotta admit that I’m slightly surprised by the park reservations situation. Right now, Magic Kingdom and DHS are unavailable for Monday and Tuesday, but that’s it. The rest of the week is wide open. Equally as significant, the Annual Passes that aren’t blocked out have full availability after today. A similar scenario played out around Presidents’ Day, so it’s not a complete shock.
It’s nevertheless a positive that Walt Disney World has not been utilizing Park Pass to redistribute or normalize attendance across all 4 parks. This is something we observed even last August and September, when crowd levels were at their lowest. I’m really curious what prompted the change. Could be staffing, guest satisfaction, or lost business as a result of trying to “force” people to visit certain parks. Perhaps a combination of the above.
Regardless, this trend should put us one step closer to Walt Disney World retiring reservations for everyone except APs, or perhaps for all dates except peak holiday weeks. If next week stays green–or even yellow–the Park Pass system arguably has served its purpose and is no longer needed for all guests or dates. If Bob Iger wants to claim another big win on the “listening to feedback from our guests” front, the door is now open for a big rollback of Park Pass.

For spring break season crowds, another variable is the 2023 Florida Resident Ticket Deal for Walt Disney World. That’s only valid Mondays through Fridays (so weekends are always out), and also has blockout dates this coming week, April 3-7, and April 10-14.
This coming week is spring break for Osceola and Orange County, among other less significant (from an attendance perspective) school districts around Central Florida. Even with the resident ticket deal blocked out, Orlando-area school districts out on spring break should have a huge impact on attendance since so many locals are Annual Passholders, and reservation availability is currently ample.

Ultimately, it’s been an excellent two-week run at Walt Disney World. It’s nice to see this “valley” once again after a couple years during which they only dipped a little between late February and early March. In all likelihood, this is a return to normal rather than an outlier.
Again, if you’re planning for a 2024 Walt Disney World vacation, we’d highly recommend keeping these dates in mind. This is a top tier time to visit thanks to the mild weather, EPCOT in bloom, and low crowds. It’s the calm before (and after) the storm, and there are only a handful of weeks that we’d rank higher from both a quantitative and qualitative perspective.
Now comes an interesting test. Our Spring Break 2023 Crowd Calendar for Walt Disney World predicted that this coming week would be the worst of spring break. That should have started to materialize yesterday, with locals causing crowd levels to rise before the tourists arrived in full force. It’s starting to happen today (March 12, 2023) with higher wait times already and Genie+ returning to its record-high price. That suggests that Walt Disney World’s internal attendance forecast is at its highest level, and crowds will only get worse from here.
Maybe not, though. Wait times have gone up, but not nearly as much as would normally be the case on a 10/10 peak season day. It’s entirely possible that our (and Disney’s own!) forecast will be wrong. Walt Disney World aggressively blocked out resident tickets and hasn’t sold new APs in a long, long time. Disney’s prices are high and airfare also isn’t cheap. Even though there ended up being some 10/10 days and Genie+ sold out for the first two times ever, we overshot our predictions for Presidents’ Day and Mardi Gras.

While predicting colossal crowds for spring break, we’ve also been saying there are signs pent-up demand is fizzling and that last Christmas might’ve been the last hurrah for that. That has been evident from Walt Disney World’s increased discounting alone, but is also suggested by leadership making positive changes to improve guest satisfaction. It’ll be interesting to see how the next few weeks end up playing out, but I’m already starting to think that our expectations for spring break were too high.
That’s the good news–the bad news is that it’ll still probably feel very busy. Even if our crowd predictions were incorrect for the coming week, it’s not going to be anything like the last two. Being “way wrong” here means 8/10 or 9/10 levels instead of 10/10+ crowds, with over a dozen attractions seeing triple digit averages and more sold out Genie+ days. It’s still going to be bad–that’s pretty much a given. Rather, it’s a question of just how busy it ends up being, and how long the high crowds stick around. Regardless, these lower levels for late February through mid-March bode extremely well for late April and May 2023. So there’s that to look forward to!
Planning a Walt Disney World trip? Learn about hotels on our Walt Disney World Hotels Reviews page. For where to eat, read our Walt Disney World Restaurant Reviews. To save money on tickets or determine which type to buy, read our Tips for Saving Money on Walt Disney World Tickets post. Our What to Pack for Disney Trips post takes a unique look at clever items to take. For what to do and when to do it, our Walt Disney World Ride Guides will help. For comprehensive advice, the best place to start is our Walt Disney World Trip Planning Guide for everything you need to know!
YOUR THOUGHTS
Did you visit Walt Disney World at the end of February or first half of March 2023? What did you think of the crowds? Any parks, times of day, or days of the week noticeably worse than the others? Did you find the past few days to be noticeably busier than the first half of the week or previous weekend? If you’ve visited in past weeks before spring break, did you notice a big difference in crowd levels? Do you agree or disagree with anything in our crowd report? Any questions we can help you answer? Hearing your feedback–even when you disagree with us–is both interesting to us and helpful to other readers, so please share your thoughts below in the comments!


We are available 11/5/23-11/8/23 (Sun-Wed) to visit Magic Kingdom and Hollywood Studios one day each. We will also attend MVMCP if it is available on those dates. Our dates are locked in due to a conference. It appears the RunDisney 2023 Wine and Dine Half Marathon is 11/2-5. We are staying at the Hilton Bonnet Creek hotel and will utilize early entry to both parks and stay until close. After reading your various planning guides we are proposing the following schedule but would like your input if something may be better due to crowds and/or wait times:
1) Sunday 11/5 – Hollywood Studios/early entry til close (half marathon finishing up-will it affect DHS and also traffic or transportation from Hilton to park?)
2) Monday, Tuesday or Wednesday 11/6-11/8 Magic Kingdom/early entry & MVMCP for same night (half day/party night) depending on when MVMCP is.
3) If for some reason MVMCP is not during 11/6-11/8, which day would be best for Magic Kingdom with early entry?
Do you still have to make reservations for each park. Can I purchase season passes, or are they gone for a while.
Hi Tom, posted on the March 2023 page too, then saw this so thought I would add my experience: we are just back from a fab 10 days at Disney from 27 Feb to 9 March: timing chosen in part based on your best times to visit guides – as you predicted, crowds were very reasonable final week of Feb coming off the back of RunDisney, rarely waiting more than half an hour: comparing to today a week on, crowds are up at 120+ minutes for even some of the less ‘wow’ rides. We also used your strategy tips for Early Entry and had ourselves in the queue for Rise of the Resistance at 0745, a good fifteen minutes before Early Entry even officially began! Will definitely recommend your blog to any future visitors!
Interestingly, we did find Universal (both parks) to be very crowded on Mon 6th March (slightly less so on Tues 7th) – partly with large school groups and marching bands!
I’ve been an avid reader of your website since March 2016 and we chose Feb 26-March 11 for a big trip based on your predictions. THANK YOU!! Crowds were low and the weather was awesome. We didn’t purchase Genie plus and we still did everything we wanted to do. It was the best trip! I have friends there now (they obviously don’t read your blog) and they’re not able to do much without Genie+. We noticed a big increase in crowds starting in March 9.
We did Guardians twice and my boys did Smugglers Run 8 times. (It was their favorite ride.)
I read your tip about doing headliners later in the evening, as posted times are often inflated. We did Mine Train with a posted wait time of 70 minutes and waited only 18 minutes! We did SDD with a posted wait time of 80 minutes and waited 35. Seriously, thank you! Your advice made our trip awesome!
“There are several other variables that impact “feels like” crowds”
My favorite variable that shows up in the data, or doesn’t show up depending on your point of view, is the one that causes a dip in the average MK hour-by-hour wait times starting at 3pm. I assure you, the people watching the three o’clock parade instead of standing inline definitely feel like crowds!
(FYI: Now that there’s a 12pm showing of the daytime parade, there’s a dip there, too.)
I am planning a short trip April 27-29, (an early mother day with my girls). It sounds like the crowds may be on the milder side which will be great. We were there in late January, and the crowds were not too bad.
Thanks for all the great info!
Angia
Hey Tom, I’ve been avidly reading your posts since December 2019 when we’d booked to come to WDW from the UK for 10 days in September 2020 ().
We’re FINALLY looking at rebooking for next year, and were planning on 10 days in September once the schools had gone back. This post though has thrown the cat among the pigeons!! We’ve always been a bit concerned about the heat and possible hurricanes in September, but on the flip side hate queueing with a passion! Would you say there’s potentially going to be a 10 day window in March 2024 that could be a good bet for low/moderate crowds? I try to keep up to date with US holidays but as they seem to be state based I find it a bit tricky, so if you’ve got any recommendations I’m all ears. Many thanks, Simon
I was in the parks from 3/6 to 3/9. The first three days were amazing with low crowds and wait times. I bought G+ as it was a bit warm for me and I didn’t want to stand in lines. They were very effective until the last day. March 9 started with an IT problem so no one could book their 7 am G+ selections. Didn’t get much in the way of top tier attractions. The spring break crowds definitely started to arrive that day. Lots of unaccompanied minors as bands, choirs and sports teams started to arrive so more noise, rowdiness and running.
We just got back from a short trip from March 4 to the 10th. It was very nice with what seemed like lower crowds and wait times for several rides were quite low. We did not do any 7am planning and did everything we wanted to with minimal waiting. Weather was perfect in the 80’s daytime and 60’s at night. One giant rain storm that lasted a couple of hours, otherwise phenomenal! Only at night during the light shows did it feel crowded. Skyliner and boats were relaxing and it felt like there were more buses running around when we used them. Airport transfers were with Uber and they were $32 each way for quick, hassle free rides. Overall a very enjoyable week. Our flight (Southwest) home was delayed over 3 hours due to crowded skies.
This is obviously just anecdotal, but my last WDW trip in early March 2018 was a perfect blend of weather and low to moderate crowds. I think it was the first week of the month (Flower & Garden had just begun). Definitely my new favorite time to visit.
Hi Tom,
I believe I asked this before but with more information maybe you have a better idea. Do you think the first 2 weeks of March 2024 will have the same lower crowds since Easter is earlier in 2024?
I can’t imagine Easter having any impact on crowds at the beginning of March 2024. School districts aren’t going to move their breaks forward from late March to early March as a result of that. To the extent there are changes, they’ll move spring break from early April to late March.
What earlier Easter does mean is that the second half of March 2024 will be much, much worse.
Thank you for explaining. It is much appreciated.
We’re heading down April 2-April 7. What are the odds park hours will be extended? Right now, for example, MK closes at 10 that week rather than 11. I’d love to know it was open until 11 and that deluxe extended hours were until 1.
It all depends upon crowd forecasts. I would expect 11 pm extensions for Magic Kingdom, but the fact that they haven’t already happened is mildly concerning. Still almost a month for that to change, though!
Any idea if the Florida resident ticket offer will be extended past April? We are planning to be there the first week of June and have been holding out for a new offer or APs to return but our 60 day window is quickly approaching and no sign of new offerings yet! 🙁
I wouldn’t expect it to be extended, but if there’s a travel slowdown and summer bookings are down, it’s a possibility. In that case, I think they’d bring back APs, though. I still think that’s going to happen after spring break is over.
Tom, just got back from a March 3 — March 11 trip. Crowds (felt like) were low to moderate. It was fantastic! Thanks for the update.
You’re welcome–thanks for the report!