
Why Disney World Rides Can Have Worse Waits Than Posted Times!
Walt Disney World wait times are usually inflated. The actual versus posted wait times disparity for rides at Walt Disney World has been a known issue for years and topic we’ve covered in the past. For the reasons discussed there, it’s usually a positive for guests that improves satisfaction. (Updated December 4, 2024.)
However, we’ve received complaints about wildly inaccurate wait times and lines that are longer with worse waits than what the posted time suggested. Many fans have reported this messing up their days in Magic Kingdom, EPCOT, Hollywood Studios, and Animal Kingdom–and wondered why this happens.
This post answers that, explaining the main causes of underestimated wait times as a general matter. We also list several of the most notorious and high-profile offenders that are more likely to have significantly inaccurate wait times, and share the main reasons for the discrepancies.
Let’s start with some background into actual versus posted wait times at Walt Disney World. For starters, this is absolutely nothing new. Walt Disney World has been doing this for as long as I can remember, which is at least the last couple of decades. Anyone who has ever visited the parks and used standby lines to a significant degree for a few days can tell you that posted wait times are higher than actual ones more often than not.
Even though it’s nothing new, this has been on the radar of more fans in the last few years, as Walt Disney World now has a financial incentive to inflate wait times now that line-skipping is monetized via Lightning Lanes. That’s beyond the scope of this post, and a topic we’ve discussed before.
As for the subject at hand, let’s explain why wait times can sometimes be worse than what’s posted and how often this actually happens…

It’s Getting Better – This article was originally published last year at a time when actual wait times were all over the place as compared with posted ones. It was becoming more frequent to wait longer than a posted wait time, which had been a rarity in the past–posted wait times were almost always inflated.
While this can still be a problem as of December 2024 for the reasons discussed below, the last 6 months have been much better. This is a topic we recently discussed at length in Shorter Standby Lines and Lightning Lanes at Walt Disney World?!, which explains how–generally speaking–utilization of Lightning Lanes is lower. Fewer people in the fast lane means that both that and the slow lane (standby line) move more fluidly.
It also has cascading effects. If an attraction does break down, there’s less of a backlog of Lightning Lane guests to “process.” Disney issuing fewer Lightning Lanes in the first place means that the system won’t suddenly be inundated by these guests, causing the ratio of guests to be pushed higher. (Speaking of which, there’s no way it’s currently 80:20, as discussed below. It’s probably closer to 50:50, if not slightly in favor of standby!)
Posted wait times are still absolutely inflated the vast majority of the time, but they’re once again inflated by consistent and predictable percentages for the most part. And it still is possible to wait longer than the posted time for the reasons discussed here. It’s just a lot less common than at the same time last year, as lines are generally flowing as they should.

Overstated vs. Underestimated Waits – This might seem like an odd topic for a post, since “everyone” knows that Walt Disney World notoriously inflates wait times. And we’re not suggesting otherwise. There’s really no debating whether this is happening, and is standard operating procedure. In fact, I doubt there’s a single attraction at Walt Disney World that doesn’t have an inflated wait time, on average. Actual waits being shorter than posted waits is the rule, not the exception.
There are several reasons why Walt Disney World deliberately inflates wait times. It’s useful for crowd control and it’s good for guest satisfaction–an extension of the ole “underpromise and overdeliver” mantra. It’s surprisingly simple: guests will be happy if they wait less time than is advertised, but unhappy if they wait longer. Since it’s tough to make predictions that are 100% accurate, it’s better to err on the side of inflation.
Over the course of the last few years, our experience across all of Walt Disney World has been that actual wait times average about two-thirds to 75% of posted wait times most of the day. That drops to around 50% at night, if not lower. Those are averages. We’ve waited significantly less and, on rare occasion, more than the posted wait times. This post is really about those rare occasions, and explaining why that happens, as opposed to the normal underpromise and overdeliver approach.
Ride Breakdowns, Delays & Lightning Lanes – If you’re wondering why, as a general matter, attractions sometimes have longer actual wait times than what’s posted, downtime is the leading explanation. Breakdowns or delayed openings are the obvious angle of this.
If an attraction normally operates for 10 hours per day but that drops to 8 hours, it has effectively lost 20% of its capacity while losing some amount of its demand that is, more likely than not, less than 20%. Meaning that almost as many people as before the breakdown still want to ride it. Not all of them will be able to, though, because that’s not how numbers works.
That part is a math problem, but it’s not necessarily obvious why wait times would be understated at this point. The simple answer is because they’ve become less predictable. While Walt Disney World has a pretty good idea of wait time trends over the course of a normal operating day, that confidence drops as soon as unintended circumstances occur.
It’s more than just that, though. Further complicating matters is the Lightning Lane. You might think that since this always exists, it should be static and also a non-factor. But Walt Disney World has multiple ‘phases’ for Lightning Lanes based on the circumstances.
During normal operations, standard procedure calls for a roughly 4:1 or 80:20 ratio of Lightning Lane to standby guests at the the attraction’s merge point. Meaning that for every one person admitted into the load area (or wherever merge occurs) through the regular queue, 4 people are pulled from the Lightning Lane line. This is the baseline–the ratio only gets less favorable for the standby line!
In the final phase, the ratio can be as much as approximately 10:1. This is the unofficial-official internal guidance for Cast Members, but operates alongside an informal mandate: keep the Lightning Lane line manageable. Meaning that if there’s a huge overflow queue of Lightning Lane guests spilling out the attraction front entrance–and not just because of a logjam at the touchpoints–Cast Members will use their discretion to bring that down.
From this, it shouldn’t be difficult to discern why a posted wait time could be understated. It’s still rare. Usually, when an attraction comes back up from downtime, Disney will massively inflate the wait in order to discourage people from jumping into the standby line. This helps with processing the backlog of Lightning Lane guests, and also keeping expectations in check as the standby line progress comes to an absolute crawl. (Seriously, a 30 minute actual wait on a 60 minute posted time doesn’t feel like a win when you only have a dozen or so guests in front of you in line and you’re moving at a glacial pace.)
Again, the element of unpredictability is key. Depending upon the duration of the downtime, there might be a backlog of several hours’ worth of Lightning Lane guests…and it’s difficult to know when they’ll arrive. Further complicating matters is the Multi-Experience Lightning Lane, which can mean that an attraction or two breaking down can have outsized impacts on the accuracy of posted wait times pretty much park-wide.
As for the why of this…it also should be pretty obvious. Lightning Lanes cost money and Walt Disney World doesn’t want to be doling out refunds and recovery when those guests. So naturally, they’re going to prioritize accommodating those who dropped the big bucks on Lightning Lanes over the commoners who “only” spent thousands of dollars on accommodations and regular ole park tickets. Hey, we’re not saying it’s a great and fair system–we’re just telling you how it works!
With that in mind, let’s go through a few attractions where there can be a disconnect between the posted and actual wait times…
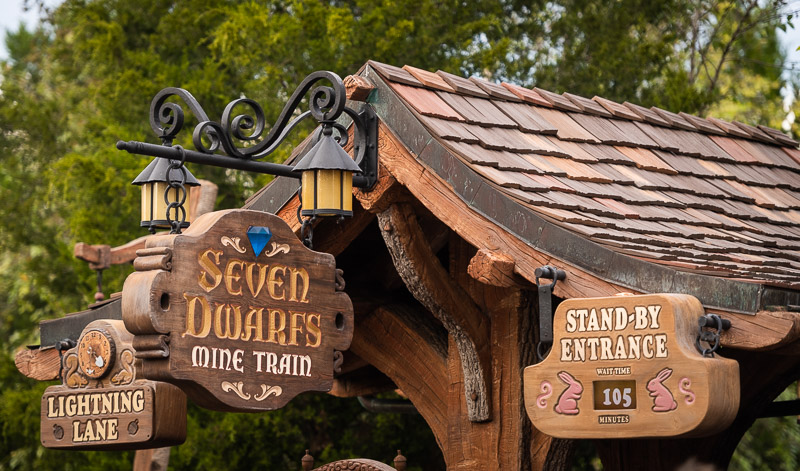
Seven Dwarfs Mine Train – Usually, the more popular the attraction, the higher the amount of wait time inflation. Prime examples here are Seven Dwarfs Mine Train, Peter Pan’s Flight, Frozen Ever After, Rock ‘n’ Roller Coaster, Slinky Dog Dash, Millennium Falcon Smugglers Run, Avatar Flight of Passage, and Na’vi River Journey. This is not an exhaustive list.
Seven Dwarfs Mine Train is so commonly inflated following the fireworks that our Ride Guide for Seven Dwarfs Mine Train highly recommends doing that attraction after the fireworks and ignoring the posted wait time. This is consistently and predictably overstated, and that’s entirely by design. It’s to discourage guests from jumping in line at the end of the night so Magic Kingdom can be cleared quicker.
With all of that said, there are rare occasions when the posted wait time actually underestimates the the actual wait. This is usually due to the dreaded delayed opening, which has an accordion effect since so many people try to do the ‘SDMT Shuffle’ in order to ride Seven Dwarfs Mine Train during Early Entry or at regular rope drop.
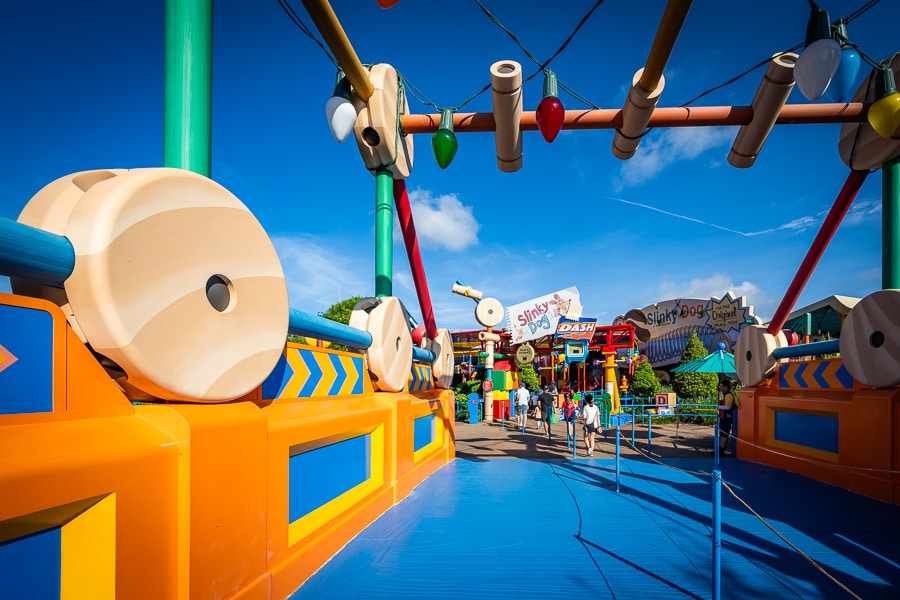
Slinky Dog Dash – Pretty similar situation here. Most of the time, Slinky Dog Dash has exaggerated wait times.
My theory, and I have no way of proving this, is that wait times are always more difficult to predict with Slinky Dog Dash even in the absence of breakdowns. That’s because this is the most popular Lightning Lane attraction in all of Walt Disney World, and as a result, guests are often “forced” into later return times. If you have young kids, it might be overly optimistic to think you’ll still be in DHS at 7 pm, but if that’s your only option for this tough Lightning Lane…you’re probably going to take it!
Additionally, guests can hit a wall (hard!) at Disney’s Hollywood Studios unlike any other park at Walt Disney World. Between those two factors, I’d be willing to bet that the “abandonment rate” of Slinky Dog Dash Lightning Lanes is pretty high. That’s another wildcard that makes its wait times less consistent and predictable.
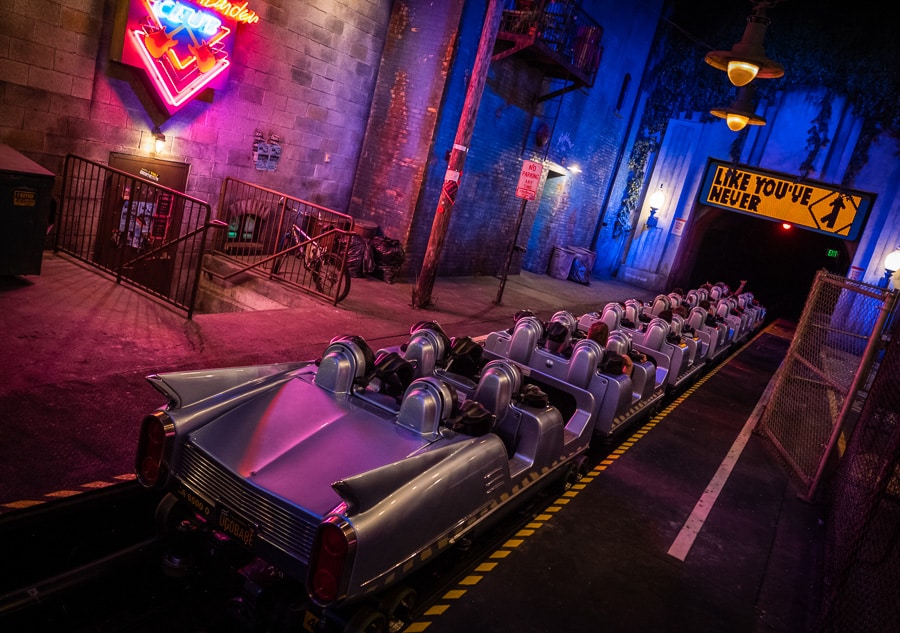
Rock ‘n’ Roller Coaster – This is a bit of an artifact, as Rock ‘n’ Roller Coaster has had fewer wait time woes in the second half of this year. In the first half and last year, it was a common source of frustration due to multi-hour and even multi-day downtime.
The coaster still does experience closures that can throw a monkey wrench into things, but they’re far less common. If we were making this list based on the last 3 months alone, I doubt RnRC would make the cut.
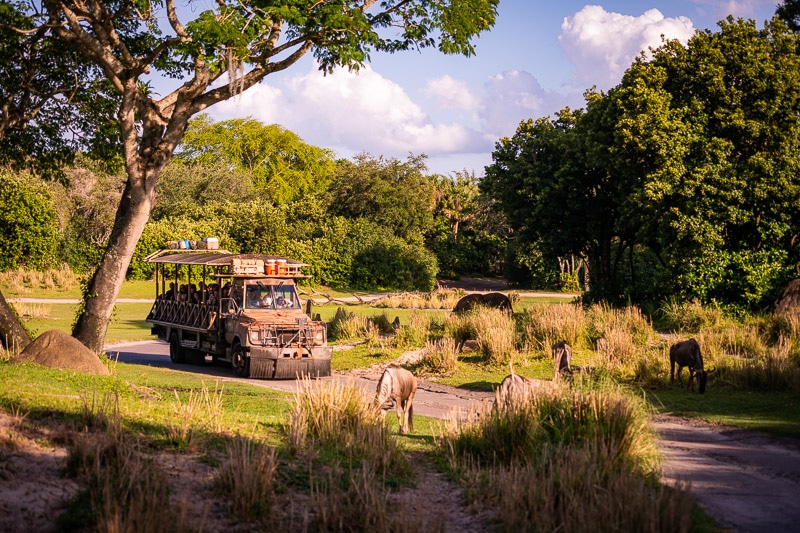
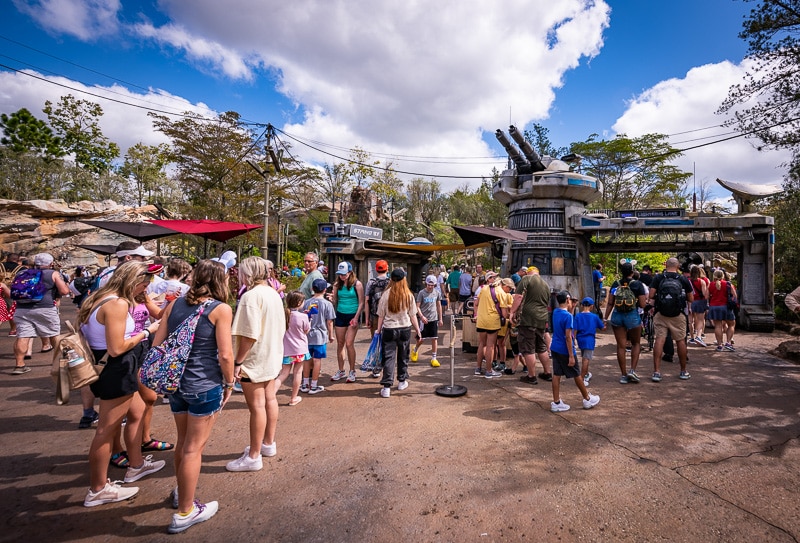
Kilimanjaro Safaris – This is actually a sort of fun one that isn’t immediately apparent, but once you hear the explanation, it makes perfect sense and seems obvious in hindsight.
It’s the animals. All it takes is one stubborn rhino–jealous of the hippopotamus who was pet by Bob Chapek, and looking for a current executive to call their friend–to get in the road and block the vehicle path for ~10 minutes to throw a serious monkey wrench into operations.
In talking to former safari drivers, despite this being a fairly frequent occurrence, even a couple of brief delays can have outsized impacts on both the standby and Lightning Lanes. It actually caught me by surprise just how much of a ripple effect the critter traffic jams can cause.
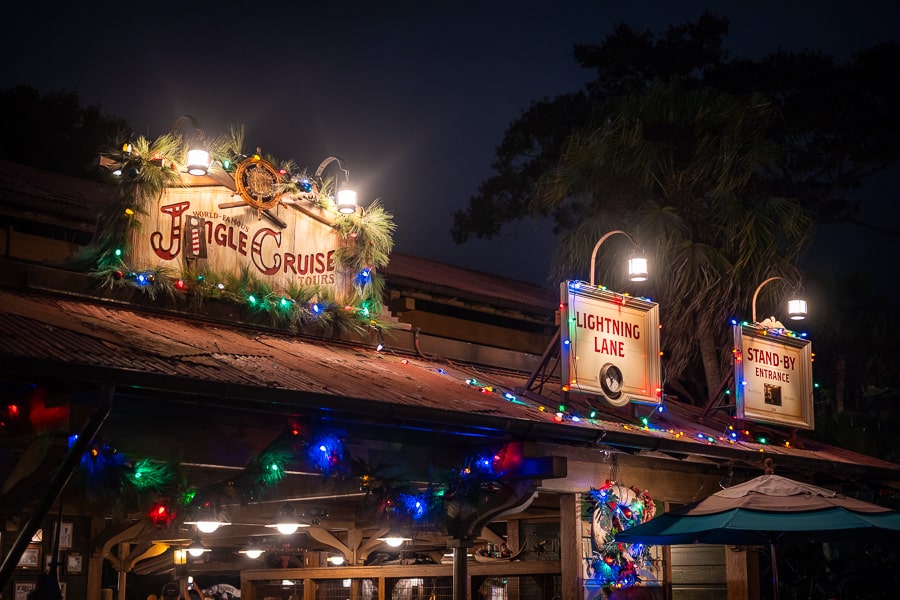
Jungle Cruise – Somewhat akin to Kilimanjaro Safaris, except plot twist, the animals causing the issue here are humans. The fake wildlife have no bearing on operational efficiency.
The big variable here is inconsistency in the number of boats in circulation, which is down across the board in the last few years. Hence Jungle Cruise climbing up the wait times chart–it’s not all about the monkey madness from the reimagining or the movie a few years ago.
Although I don’t have anything to back this up beyond my anecdotal observations, but I also think wait times are more inconsistent with Jingle Cruise. I’ve seen wait times shoot up for that overlay, especially around the start of the MVMCP mix-in or around sunset.
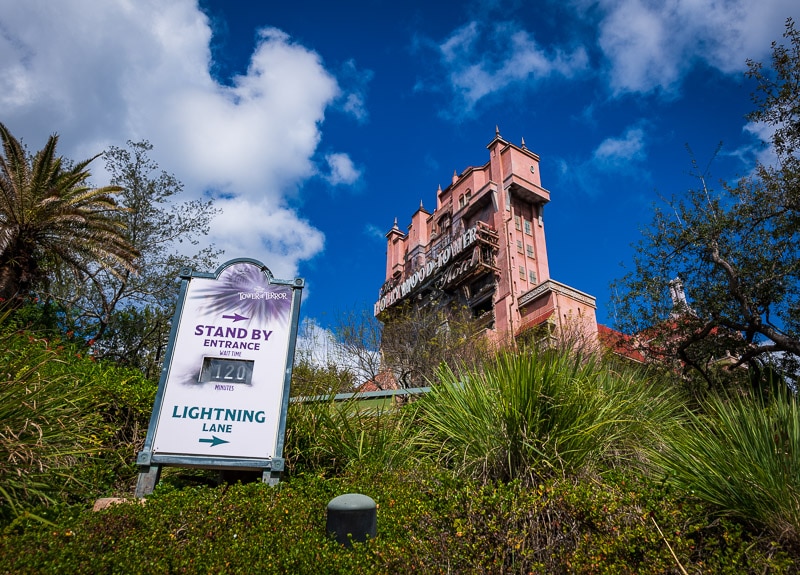
Tower of Terror – It has been an up-and-down year for the Twilight Zone Tower of Terror. Its average wait time shot up last spring, then plummeted towards the end of summer before quickly rising again in the winter. This dynamic was due to a lengthy “stealth” refurbishment that took each elevator shaft down, with a gap in between the downtimes. That meant that the attraction was effectively operating at half-capacity for about 4 months on two different occasions.
On the plus side, that was consistent and predictable within those timeframes–the downtime was a known quantity and built into posted wait times. On the downside, it’s not uncommon for an elevator shaft to go down unexpectedly. When that unplanned downtime occurs after Lightning Lanes have already been distributed, don’t be surprised if you get caught in a longer-than-quoted line. (The multiphase nature of Tower of Terror also doesn’t help with wait time accuracy. We measure the wait to the first pre-show, but you might feel differently about that!)
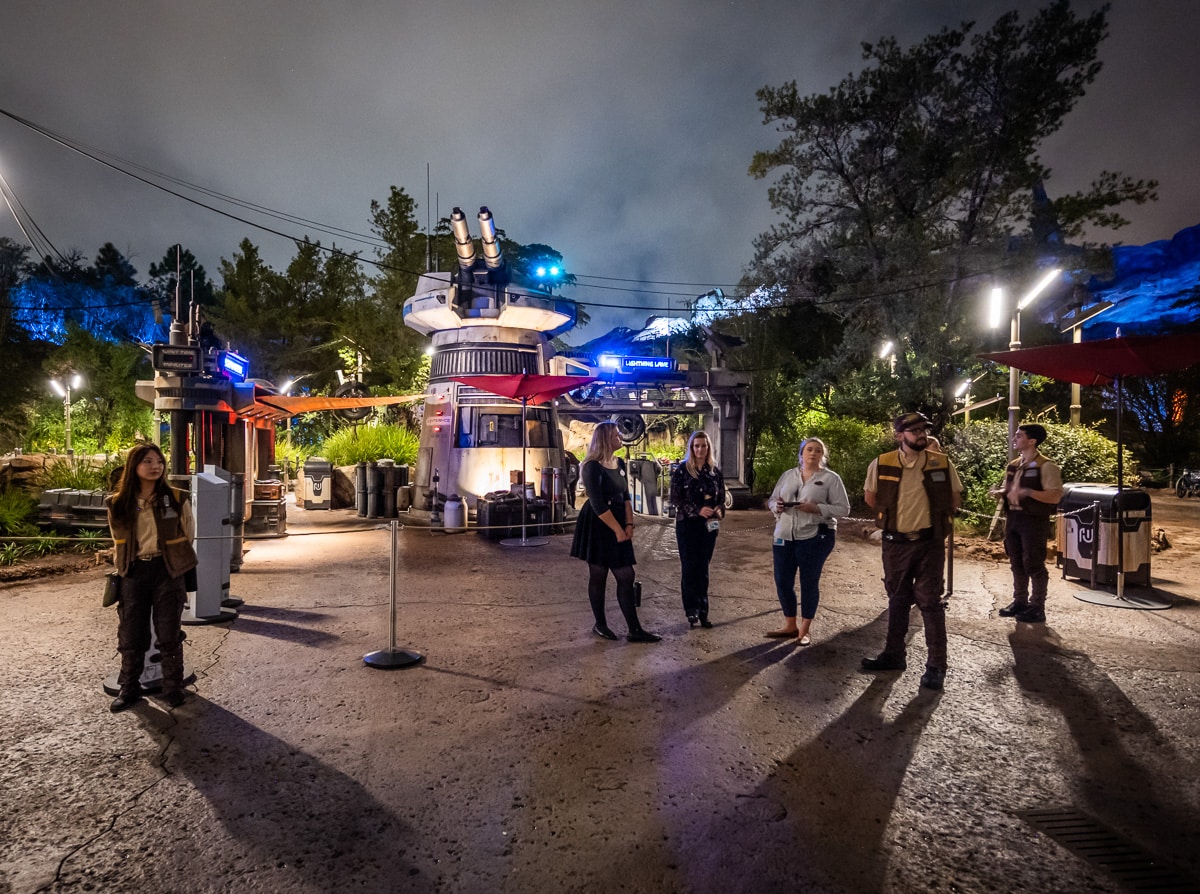
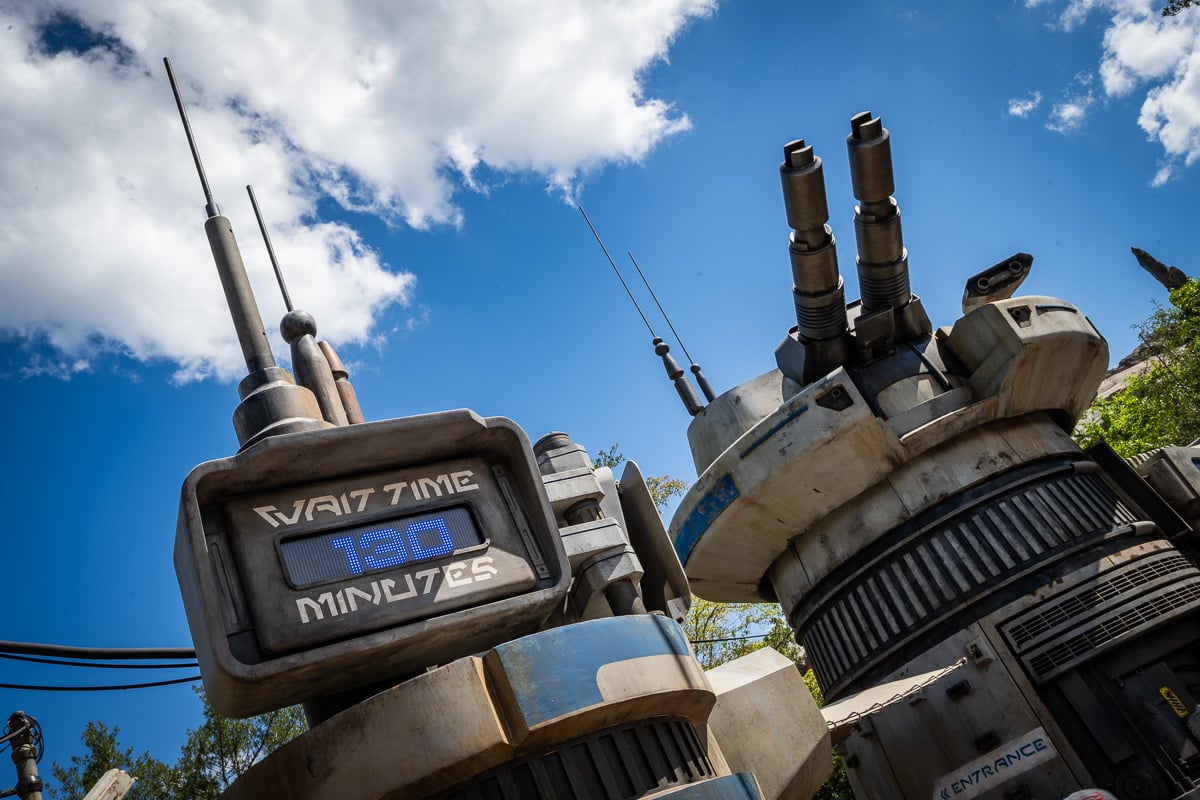
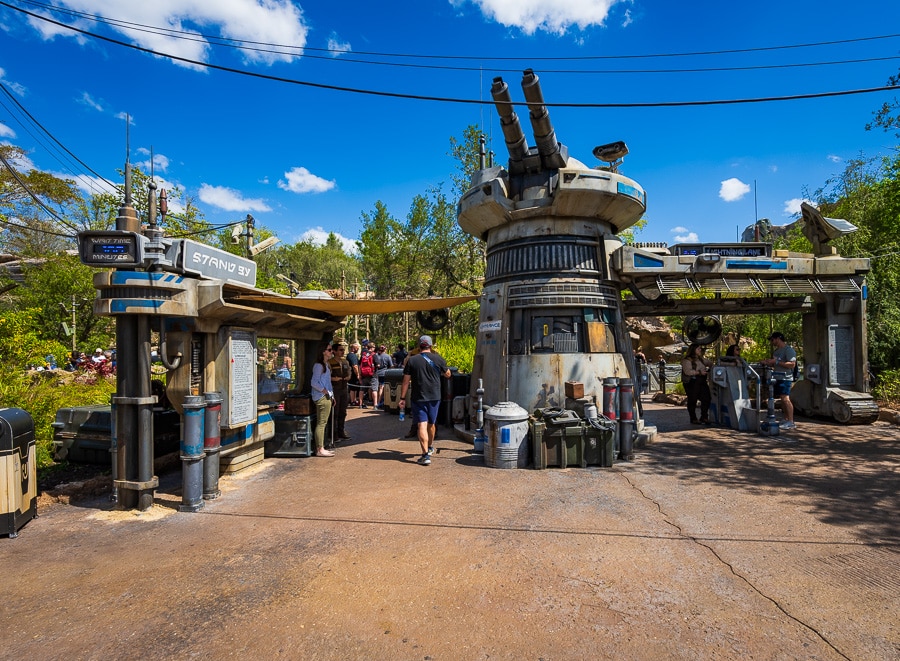
Star Wars: Rise of the Resistance – Saving the best for last, Star Wars: Rise of the Resistance was the inspiration (well, along with Kilimanjaro Safaris) for this post in the first place. That is doubly true during times like right now.
During peak holiday weeks, this attraction often has standby wait times of 2-3 hours. When the line is that long, the odds of a breakdown occurring while you’re in line are pretty high. (There was a point when Star Wars: Rise of the Resistance was almost guaranteed downtime at least every 3 hours. Thankfully, its reliability has gotten far better.)
A breakdown of Star Wars: Rise of the Resistance often requires a full ride reset, which means approximately an hour of downtime. Adding insult to injury, when the attraction returns from being broken down and has a backlog of Lightning Lane guests, guess who it’s going to prioritize? If you picked those who have been patiently waiting, stuck in the standby line over the people paying extra, boy do I have some bad news for you.
At its worst, this can mean that a posted 180 minute wait time for Star Wars: Rise of the Resistance actually ends up being more 240 minutes. That’s “only” 60 minutes extra because that 180 minute time was almost certainly inflated to begin with. Walt Disney World still builds a massive buffer into Star Wars: Rise of the Resistance because the attraction is prone to breakdowns and delays.
Less extreme examples involve it having been an up-and-down day for Star Wars: Rise of the Resistance but you are not in line during a breakdown. In that scenario, there’s still a backlog of Lightning Lane guests, but this is usually reflected in the posted wait time. Not always, though, and that ~100 minute posted wait time could turn into 120 minutes.
The flip side to this is that the 75 minute posted wait time at 7:45 pm might be an actual wait time of 20 minutes or less. Again, Disney builds a buffer into the wait time for Star Wars: Rise of the Resistance due to its reliability woes. It’s one of the least-accurate wait times at Walt Disney World as a result, both over and under. As its downtime has decreased, its posted wait time is much more often an overestimate these days. I’ve lost count of how many times we’ve done it at the end of the night as a near walk-on when the posted wait time was over 60 minutes. A huge win to end the day…and this post!
Planning a Walt Disney World trip? Learn about hotels on our Walt Disney World Hotels Reviews page. For where to eat, read our Walt Disney World Restaurant Reviews. To save money on tickets or determine which type to buy, read our Tips for Saving Money on Walt Disney World Tickets post. Our What to Pack for Disney Trips post takes a unique look at clever items to take. For what to do and when to do it, our Walt Disney World Ride Guides will help. For comprehensive advice, the best place to start is our Walt Disney World Trip Planning Guide for everything you need to know!
YOUR THOUGHTS
Have you encountered actual wait times that were worse than posted times at Walt Disney World? If so, at which attractions? What has been your experience with actual vs. posted wait times at Walt Disney World? What about with ride downtime and breakdowns? Do you think most to be inflated, accurate, or understated? Do you agree or disagree with my assessment? Any questions we can help you answer? Hearing your feedback–even when you disagree with us–is both interesting to us and helpful to other readers, so please share your thoughts below in the comments!


No disagreement on the reasoning. I would just add in defense of inflated times: It’s not just the unpredictability of delays adding time but that the error only skews in one direction. Delays can add indefinite time. But there is really no offsetting error that would reduce the time significantly in the other direction. I.e. half the people in line leaving all at once, or rain making tracks slippery so cars go twice as fast… so when running normally, underlying statistics would already be skewed in one direction only. That is without adding any safety cushions, etc.
Tom, Do you have a post that details the “worst” ride wait times through the best times across all parks? I am considering a VIP tour and to get the biggest bang for our buck I am thinking of doing the “single pass” Lightning Lane Attractions and then the “worst offenders” – being the longest wait times or the hardest to book LL availability. I’m also trying to decide if I should focus our 7 hours on MK & HS and skip Epcot/AK since they would be easier to tackle on our own later in the week. Finally – I am thinking of taking a big swing and booking the tour from 2-9 on a Halloween party night – my reasoning is to get prime viewing (without the wait) for both the 2pm parade and the Halloween fireworks at the end of the night – we wanted the VIP day to be first so we could take a more leisurely pace the rest of the trip and not worry about missing any “must-dos”. I am loving the blog btw and reading every article like a college student cramming for exams lol! Thanks a bunch
There are a lot of reasons for this phenom and ZERO of it has to do with guests’ expectation or satisfaction. A simple excel spreadsheet equation could tell you a ride that is 30 seconds in duration which is a 3 seater could move 100 people in X amount of time, sprinkle in a few LL and voila, near perfect timing. BUT that isn’t what disney management is doing. It is all about the G+ and LL money. Which if there were more improvements and less breakdowns would make it tolerable. Though I do like being stuck on the safari when one of the animals are blocking the roads, so super cute. Clearly the animals have learnt that if they stand in the road someone will rush out to give them a sugar cane treat to move. Little snack pirates ❤
We experienced exactly what you described regarding 7DMT. We were in MK the Monday after the Wine and Dine Half Marathon. 7DMT was done for the first couple hours, so when it started running again we rushed in to the standby line, which was estimated at approx. 85 minutes. Now, I know that’s low for that ride usually. 🙂 But we ended up waiting in line for 2 hours, and our half marathon feet were KILLING us! As we got to the front, I started watching the LL line and doing the math. Cast members would spend 10 minutes letting LL riders onto the attraction, and then would grab approx. 20 riders (or 1 minutes worth) of riders from the standby line. The 10:1 ratio you talked about. I’d never seen it for myself. OUCH!!!! And, as we exited the ride, I was shocked to see that the LL line was incredibly long and snaked around the front and side of the attraction. No wonder they were letting so many people on!
I thought I’ve seen wait times underestimated in the morning because crowds increase faster than wait times, but sure enough, most everything I can remember is on Tom’s list. (*Maybe* Peter Pan’s Flight if you include accurately estimated.)
I’m not sure if this “counts” but I’ve seen wait times underestimated just because a big theater show let out and everyone crammed in the nearest ride – but the wait time didn’t update quiiiiite fast enough to take into consideration the sudden mob.
Happy Thanksgiving. Hope you get to enjoy your first one as a family of three. Cheers.
Here here. Have a great first Thanksgiving! Once they start crawling it’s all downhill from there 🙂