
Very Busy Fall Break at Disney World
The month is more than half over, and October 2022 is already proving to be much busier at Walt Disney World than summer or early fall. This wait times report covers data for the month-to-date at Magic Kingdom, EPCOT, Hollywood Studios, and Animal Kingdom, plus predictions of what to expect for the rest of this month and the holiday season.
To quickly recap the last few months, August and September largely marked a return to off-season crowd levels. Some fans who visit annually during this time of year reported “feels like” crowds that were higher than they expected. Nevertheless, it was still the best stretch of the year from the perspective of wait times, which were about 34-35 minutes across all of Walt Disney World, on average.
That is especially true once school went back into session through the second week of September. During that stretch, crowd levels were typically in the 1/10 to 3/10 range. That bottomed out the week of September 11, when the average resort-wide wait time was 27 minutes. The following weeks last month got progressively worse, but nothing as bad as what we’ve seen in October 2022 thus far.
As always, wait times are not conclusive of attendance or in-park congestion. There are several other variables that can impact “feels like” crowds, including but not limited to festivals at EPCOT, weather, guest demographics, ride breakdowns, operational efficiency, wait times manipulation, and park operating hours. This is just a partial list, and all of those are significant variables right now.
In short, wait times are an imperfect measure of Walt Disney World’s raw attendance or crowds. Imperfect as they might be, wait times are still the best measure of crowds–and the only objective one. The alternative is relying on individual guest perceptions, which are much more flawed and incomplete. It’s impossible for anyone to be everywhere at once, and hard to know whether you’re in a pocket of crowds, what efficiency issues exist, and whether guests are disproportionately doing attractions or loitering about.
With that out of the way, let’s dig into the data and look at Walt Disney World wait times. As always, all graphs and stats are courtesy of Thrill-Data.com:
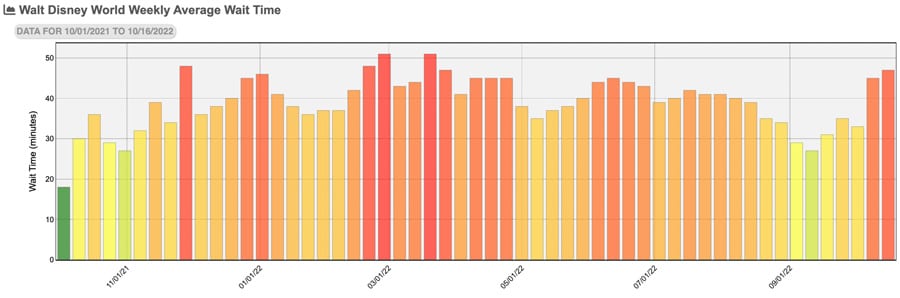
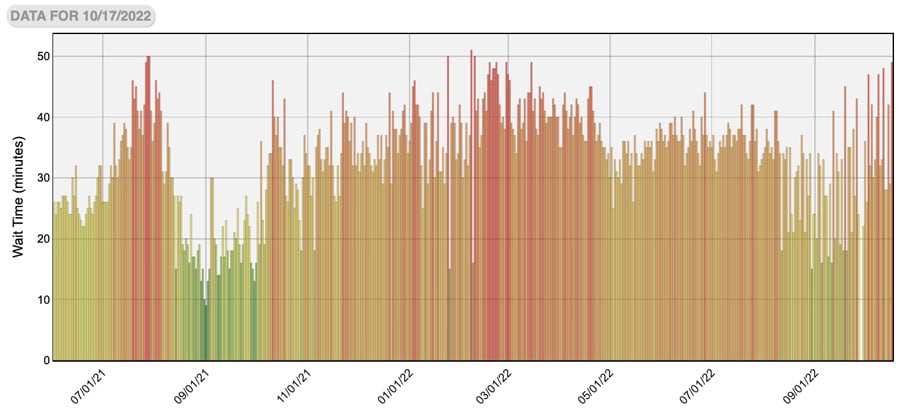
We’ll start with the weekly numbers for Walt Disney World as a whole.
As you can see, it’s a huge spike in October, especially over the course of the most recent two weeks. September was the least-busy month of the year, whereas October has been among the worst. Moreover, if the current pace holds (and it likely will) 2022 will surpass 2019 as the busiest–as measured by wait times–year ever at Walt Disney World.
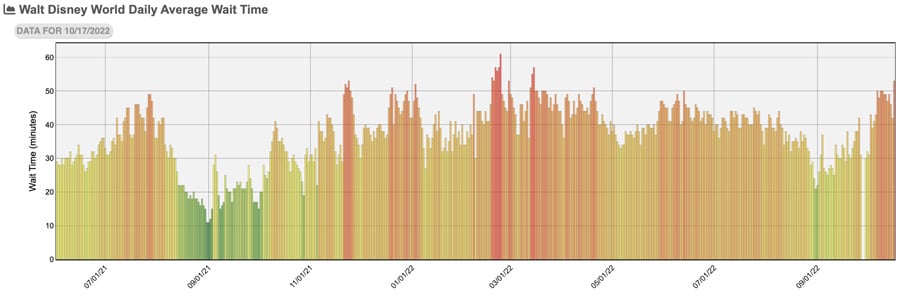
Above is a look at the daily numbers. Walt Disney World has been experiencing elevated attendance during the Columbus Day/Indigenous Peoples’ Day holiday weekend and weekdays thereafter. As previously discussed, many schools use this as a proxy for setting their fall break, making it a popular post-summer and pre-holiday time for vacations.
Consequently, crowd levels have been a 9/10 or 10/10 every day except one since October 7. As a whole, the average wait time across all attractions during that stretch was 47 minutes. That makes it one of the busiest stretches of the entire year, just after the weeks of Presidents’ Day and the peak weeks of spring break and Easter. To put that into perspective, the average wait time towards the tail end of September and first week of October ranged from 33 to 35 minutes, and there were already complaints about increased crowds then.
For park by park analysis, we’ll start with Magic Kingdom. This graph resembles a real roller coaster (or perhaps a prickly porcupine), essentially bouncing between peaks and valleys.
As usual, this is due to Mickey’s Not So Scary Halloween Party, which really disrupts attendance patterns at Magic Kingdom. This is something we’ve covered at length, again and again.
One interesting thing we’re starting to see here is party-shortened days that have crowd levels above 1/10 or 2/10. We warned you that this would happen, and in the last week there have been 3/10 and 4/10 party days on the ‘uncrowded’ end of the spectrum. This is because people have been “forced” into those party-shortened days by the reservations system.
However, the non-party days have also increased as compared to last month, with those 10/10 days in Magic Kingdom becoming more common. To illustrate, the most recent non-party day had an average wait time of 49 minutes, whereas the most recent party day had an average wait time of 29 minutes. That differential is actually larger than the gap we were seeing between the party-shortened days and non-party days last month or in August.
Once again, we strongly recommend doing Magic Kingdom during the day prior to the start of MNSSHP, bouncing to another park by ~4 pm. Even with 3/10 or 4/10 days, you’ll still come out ahead by avoiding Saturdays, Mondays, and other non-party days. (So long as you’re fine skipping fireworks or evening in Magic Kingdom–but you can always Park Hop over on a different evening!)
We’ve also covered the upside to this approach in our new My “Party Day” at Magic Kingdom WITHOUT Genie+.
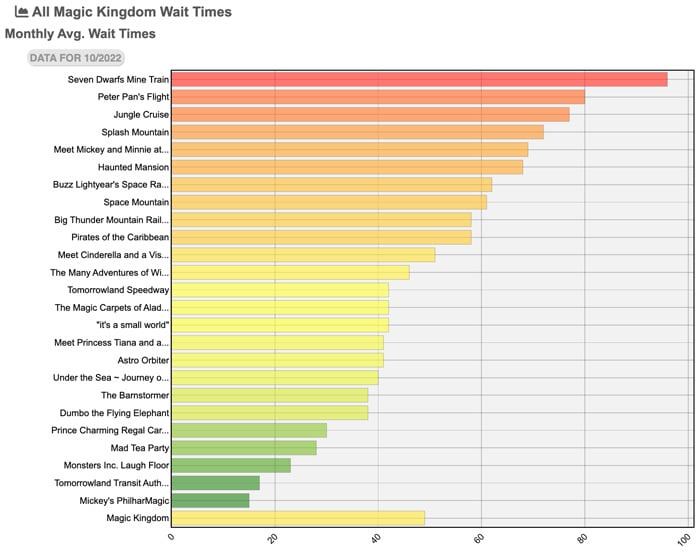
Above are the specific ride averages for Magic Kingdom.
As you can see, there are 8 attractions with average wait times above an hour. Last month, there were only two attractions that hit or exceeded the 60 minute mark (Peter Pan’s Flight and Seven Dwarfs Mine Train).
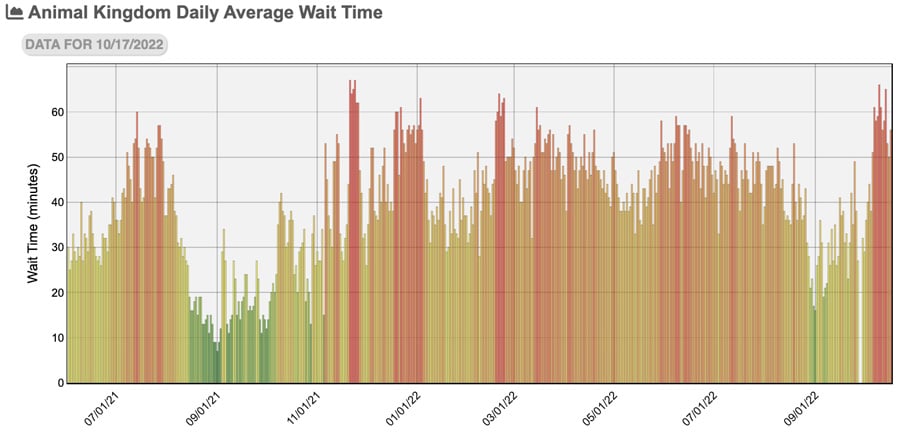
Next up is Animal Kingdom.
Animal Kingdom has seen several of its worst days of the year in the last week, exceeding the previous highs around Presidents’ Day. As we’ve discussed previously, Animal Kingdom’s limited ride roster buckles whenever crowds are heavy. It’s the park with the biggest range between lows and highs (just look at the beginning of September v. October).
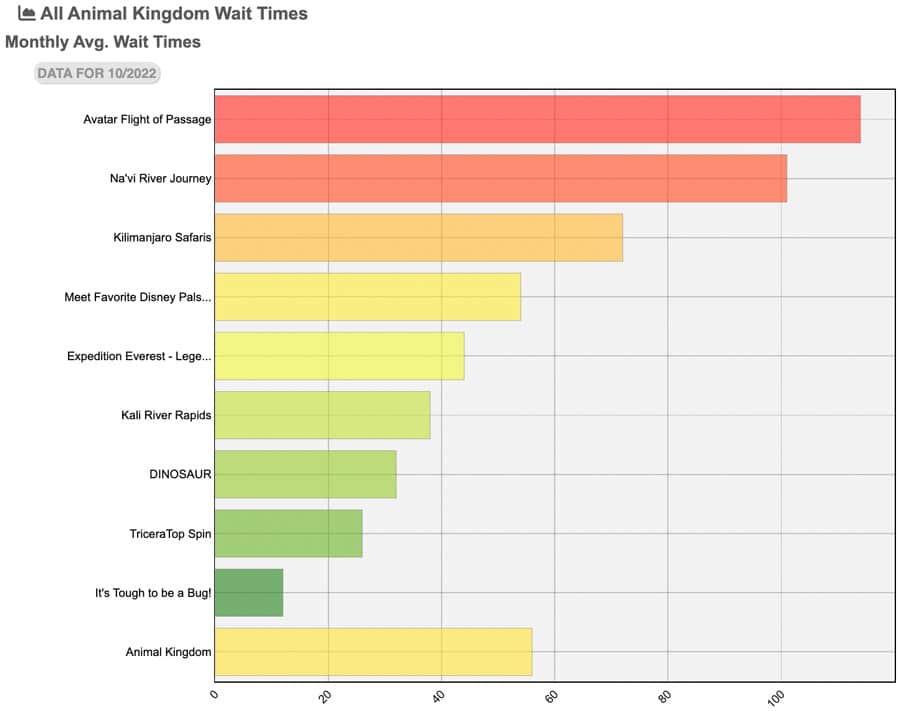
Here are Animal Kingdom ride averages for the month.
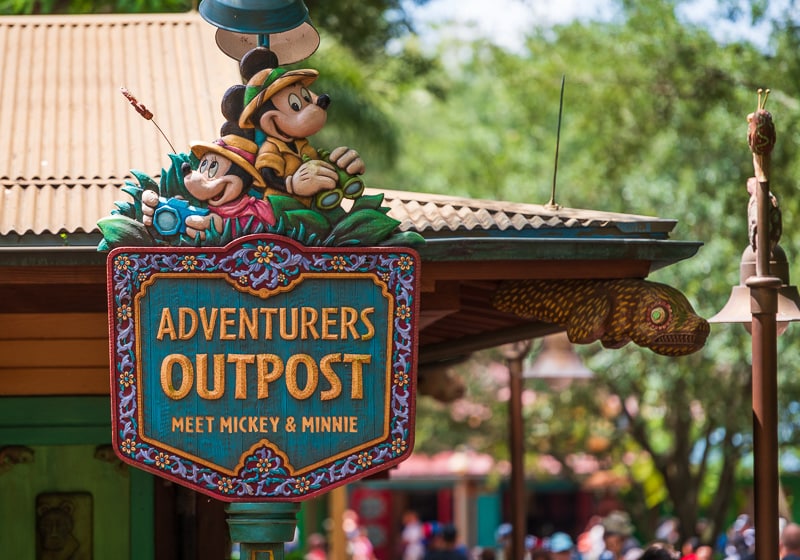
Both Pandora attractions are eclipsing 100 minutes, as compared to averages just over an hour last month. Still not terrible once you get past the top trio (I’m surprised the Adventurers Outpost meet & greet isn’t worse given the other wait times), but those waits are bad enough to lift the average.
On a positive note, Animal Kingdom now closes after sunset and the Tree of Life Awakenings have returned! We highly recommend staying for evenings in DAK to enjoy the Tree of Life Awakenings, plus Pandora and the rest of the park after dark.
Our Animal Kingdom Afternoon Arrival Strategy is once again the ideal approach for this park. Alternatively, Early Entry or rope drop are great. Genie+ is a waste of money at Animal Kingdom for at least the next month. Totally unnecessary (not that it ever was).
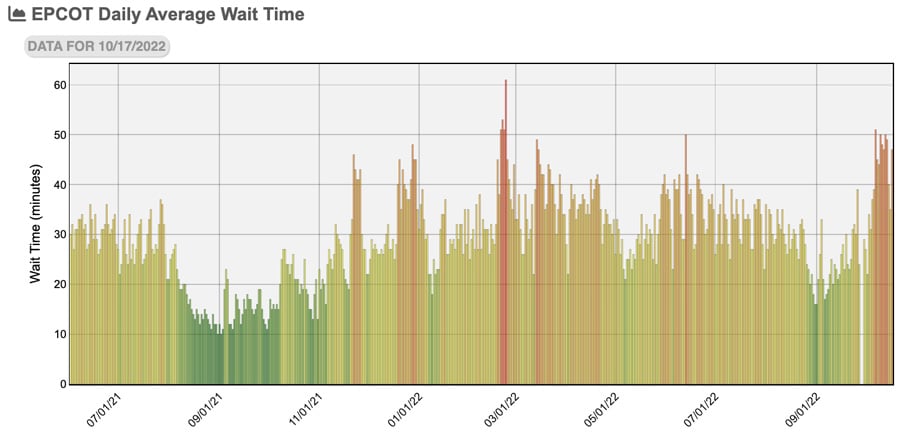
Over at EPCOT, it’s pretty much the same story–wait times bouncing from low-lows to high-highs.
Even that is not the full story. EPCOT is notorious for a divergence between “feels like” crowds/congestion and wait times. This is especially true in World Showcase, during festivals, and on weekends and evenings. World Showcase is worse on weekends due to day drinking, while evenings are busier for people Park Hopping over to watch Harmonious. In short, people show up for things other than attractions, so that elevated attendance isn’t picked up by wait time data. We try to avoid EPCOT on weekends during this time of year, and that’s precisely why. (Yet another reason why Fantasmic cannot come back soon enough!)
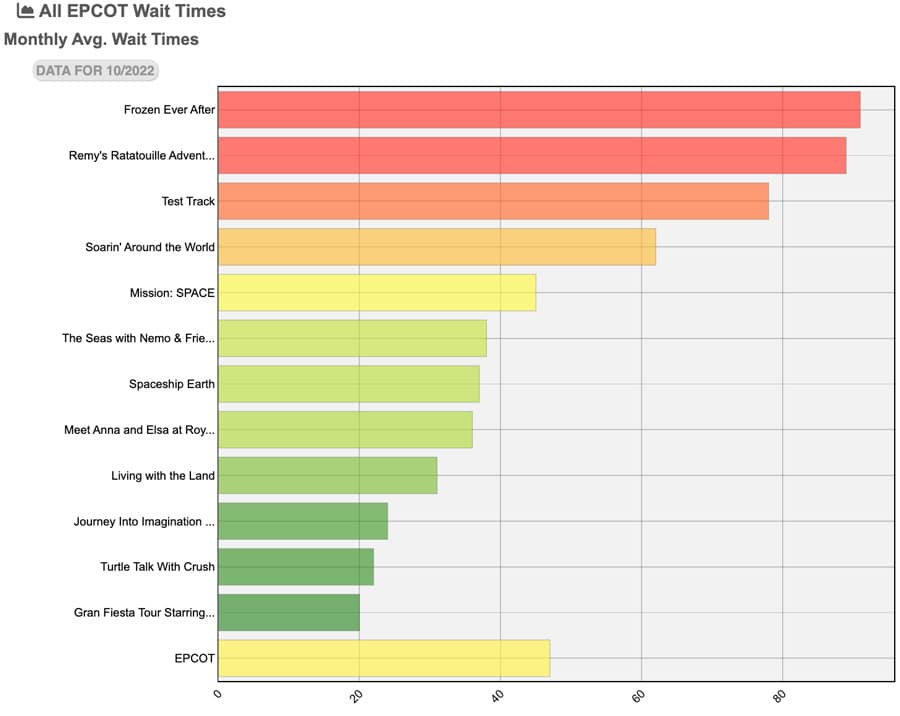
Average wait times for Frozen Ever After, Remy’s Ratatouille Adventure, and Test Track are all close to or above 80 minutes for the month. Even Soarin’ Around the World is above an hour–I can’t remember the last time it reached that level on a consistent basis (probably last November).
We like Extended Evening Hours at EPCOT, but we prefer morning–see EPCOT Early Entry v. Genie+. Spoiler: Early Entry wins handily. Once again, it’s pointless to purchase Genie+ at EPCOT for at least the next month or so.
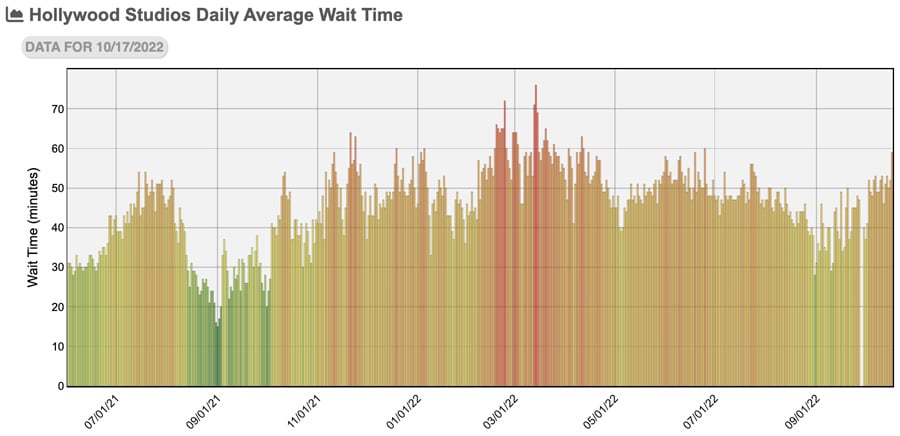
Finally, there’s Disney’s Hollywood Studios.
This is quite the anomaly, if you’re going just by the graphs. Disney’s Hollywood Studios is “only” hitting 8/10 on the crowd calendar, and the spikes aren’t nearly as bad as EPCOT, Animal Kingdom, or even Magic Kingdom on non-party days. So…what gives?
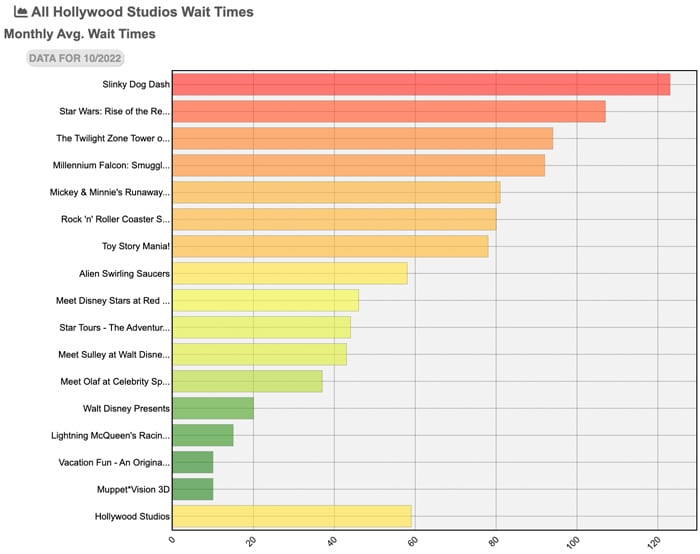
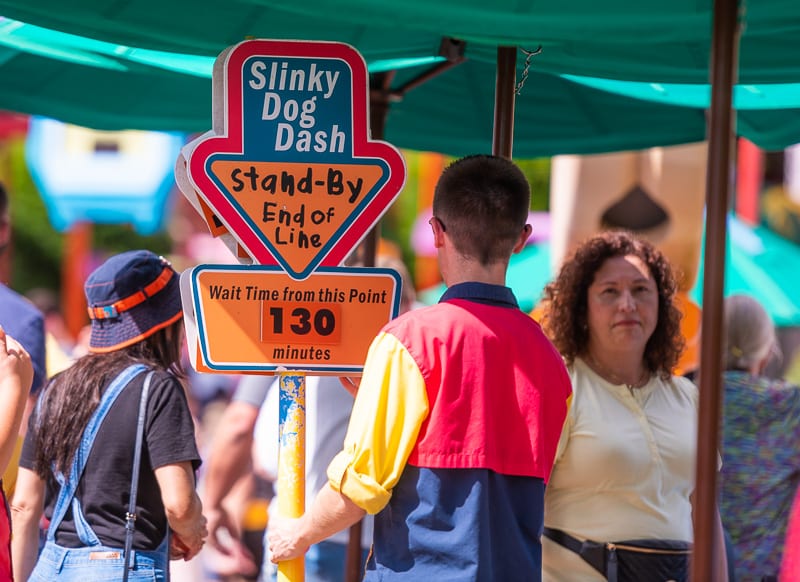
Above are ride-by-ride wait times for Disney’s Hollywood Studios this month. These are the worst of any park, with 6 attractions at or above 80 minutes. Both Slinky Dog Dash and Star Wars: Rise of the Resistance are currently in triple digits territory, and are likely to stay there.
If you’ve seen some of the viral wait times posts showing a 7-hour (!!!) posted wait time for Star Wars: Rise of the Resistance, you might question its average.
While it’s true that RotR has posted some insane wait times over the last week, those are the exception rather than the rule. That is more likely to happen when the attraction experiences a delayed opening, downtime, or reduced capacity.
Since it sells Individual Lightning Lanes under the assumption of regular capacity, the posted wait time spikes like crazy to “accommodate” the paid riders in those circumstances. Even then, those multi-hour posted wait times are likely to discourage standby riders. (I say “likely” because I haven’t put that to the test–and never will. I just know that’s the underlying rationale, and something we have experienced firsthand even with lower wait times at Star Wars: Rise of the Resistance.)
As always, crowd levels are relative to each park and not one another. Meaning that even though DHS has headliners that are “outperforming” the pack in terms of high wait times…this is par for the course at this particular park.
As for why the crowd levels aren’t worse given these wait times, my guess is that Walt Disney World has been capping capacity at a lower level in an effort to push people towards other parks. This would be the smart move, as Disney’s Hollywood Studios was absolutely miserable back in February and March when the average wait time was routinely above 60 minutes.
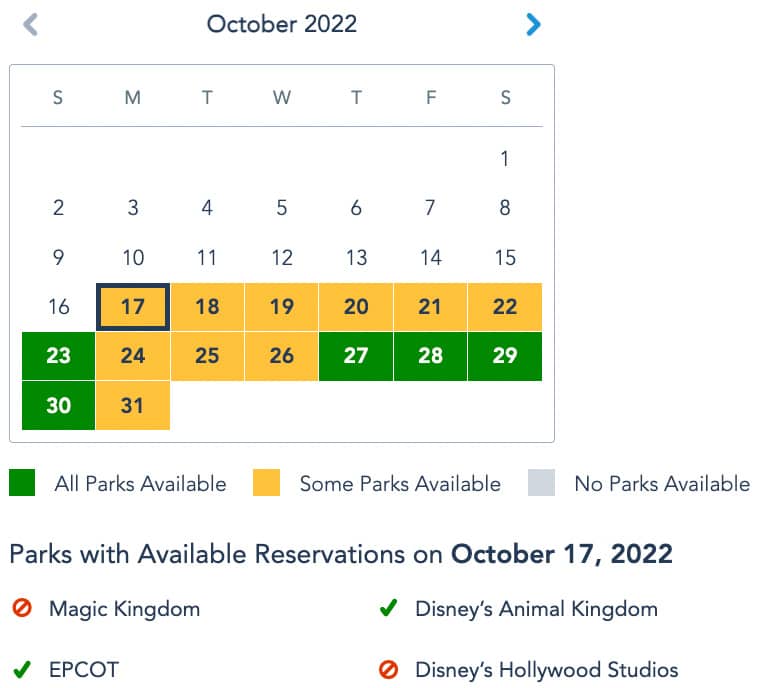
This is also something reflected by the Disney Park Pass calendar, which is yellow between today and October 22, 2022. Interestingly, Sunday is green before more yellow next week. (While there’s not a ton of consistency among days of the week, Sunday has tended to be better than other days recently.)
To put that into perspective, every single day in September was green at this same time last month–and mostly remained that way. Our expectation is that all of those days turn yellow as the dates draw nearer, with Magic Kingdom and Disney’s Hollywood Studios continuing to be the parks least likely to have availability.
As discussed in the latest update to the October 2022 Crowd Calendar, the worst week of the month was likely the one that just happened. The Columbus Day/Indigenous Peoples’ Day holiday always catches people by surprise, but it is busy at Walt Disney World during that long weekend and the dates thereafter because it coincides with fall break for many school districts.
We’re still expecting a drop-off this week and next week, but nothing on par with August or September. It’ll be more like regular dates during the spring or the summer. Our expectation is that the last full week is the second-busiest of the month, but still not nearly as bad as last week/fall break. The big question is whether the remainder of the month is busy enough for October to surpass February and March as the busiest month of the year (to date).
Ultimately, November and December will almost certainly surpass all months that came before, including October (regardless of where crowd levels land this month once the dust settles).
The week encompassing Halloween and the start of November 2022 will likely be busy. The Wine & Dine Half Marathon Weekend (November 3-6, 2022) will also elevate crowds, but that should be partially upset by that being the gap between two holiday seasons. The week after that includes both Jersey Week and Veterans’ Day, and will be busy as a result.
However, we’re hopeful that the week after that (November 13-18, 2022) and the week after Thanksgiving (November 27 to December 2, 2022) will see reprieves from the peak season crowds. Those dates along with a scattering of others in December shouldn’t be terrible.
With that said, they won’t be great, either. Crowds won’t let up in any consistent manner until after winter school breaks end in the second week of January 2023. The big questions are whether fall break is the ‘new normal’ for the rest of the year or if there will be slow stretches in the next three months between all those holiday weeks at Walt Disney World.
Planning a Walt Disney World trip? Learn about hotels on our Walt Disney World Hotels Reviews page. For where to eat, read our Walt Disney World Restaurant Reviews. To save money on tickets or determine which type to buy, read our Tips for Saving Money on Walt Disney World Tickets post. Our What to Pack for Disney Trips post takes a unique look at clever items to take. For what to do and when to do it, our Walt Disney World Ride Guides will help. For comprehensive advice, the best place to start is our Walt Disney World Trip Planning Guide for everything you need to know!
YOUR THOUGHTS
Thoughts on the very busy fall break at Walt Disney World? Predictions for the rest of October through December 2022? How bad do you expect crowds to get for the heart of Halloween and the holiday season? Have you done Magic Kingdom during the day of a MNSSHP night? Thoughts on our forecast, analysis, or anything else? Agree or disagree with our commentary about “feels like” crowds v. wait times? If you’ve visited in prior months during the last year, how did crowds compare between then and now? What did you think of the wait times? Any parks or times of day noticeably worse than the others? Do you agree or disagree with anything in our report? Any questions we can help you answer? Hearing your feedback–even when you disagree with us–is both interesting to us and helpful to other readers, so please share your thoughts below in the comments!


We just got home from 8 days in WDW, been taking the kids since early 90’s but first trip w/grandkids. It was the most crowded October I have personally seen. At times it felt claustrophobic walking through the parks. Also, I have never experienced so many rude guests. We had adults that pushed in front of kids for parades and refuse to sit down, multiple families on many occasions cut in line for transportation and on a couple rides ( when they could find a way) , and the ones who just berated casts members . We did notice the price increases in several areas and some of the missing perks we normally loved . We definitely found we had to take advantage of genie+ and some ILL in order to juggle wait times and little ones although I cringed at some of the prices we paid for them.
We will be at WDW 12/26-1/2. I am looking at staying at one of the Hiltons (official WDW) in Disney Springs area but am concerned we will not be able to purchase LL+ as we will have to wait until the park opens to purchase and they might be sold out due to the expected crazy crowds, am i correct???
I know it was a long time ago now, but moving the Magic Kingdom closure from 7pm to 6pm (for hard ticket events) was such an unfortunate change which contributes to the crowd situation. I think Disney would improve things a lot by reversing it. Maybe there were operational problems with the 7pm closure but it can’t be worse than having their flagship park unfit for purpose for much of Sep-Dec.
Totally agree–and this was the conversation that was had behind the scenes when deciding to move to After Hours events last year.
When the decision was made this year, I wonder if the assumption was that Fantasmic would’ve returned months before MNSSHP started and would help absorb displaced crowds on party nights.
Too bad they can’t move these hard ticket events to Animal Kingdom. That would be the perfect solution from an attendance-distribution perspective!
Tom, first let me just say that your blog was instrumental to my family’s (13 people!) successful trip to Disney world last week. I lived on this blog for months beforehand, and referenced day plans, ride reviews, etc during our visit. I will recommend your writing to anyone heading down there for the first time- or even anyone going back.
Next, I’ll say it’s good to see these numbers, because my GOD did the parks feel packed. We did MK on Wednesday and an employee told us there 90k people in the park. I don’t know if that’s high, but it felt like a lot. We went back the next day for MNSSHP and learned there were 20k guests. The difference was enormous, and we were able to ride all the stuff we missed at MK the day before. The downside was that we didn’t engage too heavily with the Party specific stuff like character meets, etc.
Wait times at EPCOT were manageable with LL and we found the same with AK, but I don’t know what we would have done without Genie+. At one point the wait time for Rise of the Resistance was 420 minutes.
All told, a tremendous vacation and one that we’re eager to do in a smaller family unit, hopefully during a quieter week. Thanks!
Tom, I was wondering if there was much of a difference in crowds during the week of Pop Warner last year at Disney World with Universal hosting the events now? The events this year look like they’re being held the first full week of December. I happened to be at Universal at the start of the event last year and the two days leading up to the event were absolutely splendid crowd wise but turned a bit worse the last day as all the groups started to arrive so I was just curious if that affected Disney much.
We just came back from a Columbus Day week trip. The parks were crowded and if you didn’t use Genie+ you were definitely waiting in some very long lines. I studied up on Genie+ and had a game plan but I can’t imagine how we would have done as much as we did without Genie+. I am looking at the tip boards this week and I would have killed to have as many options that are available now.
You Wrote,
“One interesting thing we’re starting to see here is party-shortened days that have crowd levels above 1/10 or 2/10. We warned you that this would happen, and in the last week there have been 3/10 and 4/10 party days on the ‘uncrowded’ end of the spectrum. This is because people have been “forced” into those party-shortened days by the reservations system.”
Or could it just be your readership is far larger than you think? I already know your humble response.
Not only do we love MK on party days but we start there on our party day as well. Great times. Thanks for all you do. Your advice goes out to way more than you realize. It’s funny but WDW Park lovers are like a magnet drawing out many others who have the same affliction. And we all pass on what knowledge we have gleaned elsewhere. Disney fans are among the nicest people in the WORLD!
Very helpful! Your advice increased our confidence that Early Entry is the way to go. Love doing the parks at night so we’ll do EE and afternoon breaks.
Do you recommend buying Genie+? We have only two days at the parks, including park hopper. We do have the DAS. (So that should help us out somewhat). If we follow your itineraries for no genie+, will we be running around like hamsters? Also, we will be there November 7 week. What days would be best to visit Typhoon Lagoon, weekends for Veterans Day?
Thanks so much for your blog!!
Weekends or Veterans Day
We were just at the parks Oct 10-14. We got G+ for MK, HS, and Epcot, but not for AK or MK the second day. We also had DAS and did early entry. I will say that G+ was a huge waste of money at HS and Epcot if you have DAS and early entry. Hardly any rides were available on G+ after 10AM for a return time before late afternoon; so it was worthless. If you are strategic about when you hit DAS for the long wait time rides (like select seven dwarfs DAS and then go eat), and select the next DAS as soon as you are scanned in and walking to get on the ride, you will be great. Early entry was key, and fun fact – they let us in at HS and Epcot 1 hour instead of 30 minutes early. Made a huge difference for getting to ride Star Wars and Pandora rides with minimal wait.
So, do early entry. Plan on getting to parks 1 hour before official open in case they let you in too. DAS beats Genie plus by SO MUCH. Have fun!
@Kris
Thank you for your feedback! Sounds like you all had a great trip last week:) I was thinking G+ would only help us out a little bit, like 3-4 rides /day. Because we are Parkhopping only having 2 day tickets, thought it may be worth it. I am good with utilizing DAS, like you did. It really does help our child at the parks. That’s awesome that you got in an hour early! We will definitely do that. We’d like to get there early in the mornings and leave by around 11 AM. Then we will use the extra evening hours at Epcot.
It was very crowded last week but for some reason it didn’t seem as awful as I’d feared. With the exception of Hollywood Studios. I was there Friday and it was terribly hot and the crowding was nearly panic inducing. I have never seen more children having meltdowns in my life. I very nearly joined them but we left instead.
I received two surveys this year after our days at HS. Both asked several questions about my level of satisfaction with the crowds on those particular park days. I wondered then if they would limit occupancy at HS in attempt to improve guest experience.
What are you thinking about the week after Jersey week? We arrive 11/15 and leave the the 19th (no park planned on a Saturday) Hoping to try to catch a bit of a lull before Thanksgiving crowds arrive but now not so sure! Think we have a shot at the WL CHRISTMAS TREE being put up somewhere in there?
In the discussion of crowds at MK did you mean to say party days with 3-4/10 instead of 1-2/10? Right now it says non-party days?
Thanks for the comprehensive analysis!
Correct! Sorry about the confusion–it’s easy to confuse the two when typing. (I need more distinct terms, as even this isn’t crystal clear, I fear.) I’ve edited the problem sentences, so hopefully all is accurate now!
We just returned from a week at Disneyland and universal HHN. Every article said max capacity with 8-10/10 each day. Waits were only 15-45 max with genie+ used throughout day. I’m not understanding peoples complaints either with genie. We must have used it at least 4-5 times per day.
1) Crowd levels are measured by posted wait times. They will definitely be shorter (significantly so) when using Genie+ and Lightning Lanes.
2) To my knowledge, no one is complaining about the usefulness of Genie+ at Disneyland. It works really well there. (If anything, I’m surprised you were only able to use it 4-5 times per day!)
We were in MK for a short while the day of our party night. Even with early entry the day lines were sooo long. Next time we’re doing two party nights…the lines were minimal and the entertainment was great. The lines in AK were horrible on Friday. Nothing under an hour, 90+ for most. We ended up just going home. Never thought I’d say it…but we miss what the parks were like during Covid!
Ouch, sorry to hear that!
As pleasant as things were crowd-wise after the parks reopened, I definitely don’t miss it. The short hours, limited dining, no entertainment, and just the tense mood in general. I know Christmas is going to be crowded, but I will gladly take it over what things were like in Nov/Dec. 2020. YMMV, though! 🙂
Is Tower of Terror undergoing maintenance on some of the elevators? I’m surprised to see its wait times up there right behind RotR (though ToT is a better attraction than Slinky and possibly even RotR!).
Also, this isn’t meant to disrespect your site at all, but these posts make me miss easywdw.com, Josh did a great job with analytics.
Tower of Terror is not undergoing a stealth refurbishment as was the case earlier in the year, but it has had significant issues with downtime on half of the attraction recently. If that persists, it might lead to finishing the other half of the refurbishment, but I really hope they’re able to get through the holiday season.
I don’t take that as disrespect. It’s an honor to be compared to Josh, even if unfavorably. He changed the game for the better, and continues to leave a colossal void every day.
Kevin, I was thinking the exact same thing about really missing Josh while reading this. And grateful to have this site as my go-to. Thanks, Tom. Appreciate all of your work.
Be well and check on those you love.
I was wondering about Tower as well as on October 17th LL’s were gone by 10:45a which is atypical for Tower. Also, the wait times for standby were nuts. Tom, I’m sure you’ll give any Tower updates as you uncover them and thanks for all your hard work. I, too, was a Josh follower but am glad I’m found your blog.
I went in September (amazing) and I’m going back in December. I was worried about September due to the August levels, which turned out to be a false concern. With these levels in October however, I’m pretty worried about our December trip. Last year the first week of December was lovely. This year, I’m wondering if it’ll be bearable.
My expectation is that the first week in December will be worse than last year, but not by orders of magnitude. Fantasmic WILL be back by then (knock on wood) and that’ll help with evening crowd redistribution in a big way.
Personally, I’m not worried. Yes, it’ll be worse than September–no doubt about that–but it’s so much better of a time to visit. And that should be the best week of the month!
I’m also thinking about an impromptu early December visit after visiting in September! But since I don’t really intend to ride rides (going with an older group) I’m just hoping for a pleasant ‘stroll around Epcot’ day.