
Peak Christmas Crowds Arrive at Disney World
Like clockwork, peak season crowds have arrived for the week of Christmas at Walt Disney World. Wait times are already up and are only likely to go higher as the parks see their heaviest attendance during the closing weeks of 2021. This report shares recent data, thoughts on what’s likely to happen next with attendance this week, and why wait times don’t tell the full story–or anywhere close to it–of high holiday season “feels like” crowds in the parks.
Let’s start with that last point, as it seems like a lot of people missed that in our wait times report from last week, which was somewhat-regrettably titled December Crowd “Slowdown” at Walt Disney World. In today’s era of only reading the headlines on social media, that didn’t exactly play well with the Facebook commentariat. Despite the title’s air quotes, many “readers” lambasted the report, saying their trips during the first half of December were the busiest they’ve ever experienced at Walt Disney World.
That post’s analysis stated that we had “been in the parks a lot both before and after Thanksgiving, and there’s a clear before/after divide in wait times. That’s undeniable, as it’s evident in the data above. This is especially true for the parks that aren’t Magic Kingdom. Although anecdotal, our perception of ‘feels like’ crowds doesn’t reflect the same. It definitely hasn’t been as bad the last two weeks, but it has still been packed–busier than I would’ve expected for the first two weeks of December, especially without Pop Warner. To the contrary, the last couple of weeks have felt like the busiest early December we’ve ever experienced at Walt Disney World.”
The next couple paragraphs of that go on to explain how different demographics can impact the relationship between congestion and wait times, with a prime example being October 1 when Magic Kingdom was packed but had short lines. I’m not going to rehash all of that because, presumably, if you’ve made it to the fourth paragraph of this post, you’re actually reading beyond the headlines.
Nevertheless, it’s perhaps worth reiterating that the wait time data here isn’t just us running around the parks with a notepad, jotting down times we see in a notepad at random. It’s scraped from My Disney Experience constantly by Thrill-Data.com and compiled in graphs and all sorts of interesting charts on their website. That site is worth checking out if you’re a data junky, as you can create custom graphs, track wait times, etc–there are some really powerful and interesting tools.
As we’ve stressed repeatedly, wait times are not conclusive of attendance. There are several other variables that can impact “feels like” crowds, from festivals at Epcot to weather to ride breakdowns to operational efficiency. (That last one is huge right now, and why December 2021 is incomparable to December 2019.) Beyond that, wait times can be manipulated by Disney, are often inflated, or otherwise inaccurate. They’re an imperfect measure of raw attendance or crowds.
However, wait times are still the best measure of crowds. The alternative is relying on individual guest perceptions, which are much more flawed and incomplete. We are in the parks numerous times per week, and I could easily identify the difference between a 5/10 and 10/10 day just by eyeballing congestion–but not between an 8/10 and 9/10 day. It’s impossible for us to be everywhere at once, and hard to know whether we’re in a pocket of crowds, what efficiency issues exist, and whether guests are disproportionately doing attractions or loitering about.
All of this is why we try to offer a blend of data plus color commentary with our anecdotal observations in these crowd reports. Usually, I prefer the wait times to anecdotes–but know they also don’t tell the full story, especially right now, with the parks still not firing on all cylinders. As a supplement to that, I think on-the-ground accounts can be valuable, but I have the self-awareness to understand that my experiences are limited to a small portion of Walt Disney World’s 43 square miles (I’m a fast walker, but not that fast!) and not representative of everyone’s experiences on any given day.
Anyway, enough with the rambling preface. If you find value in these crowd reports, you probably already have a similar perspective–but I felt it was worth reiterating for new readers or first-timers who may question methodology or wonder what’s up with Walt Disney World wait times v. attendance right now.
Let’s turn to Walt Disney World wait times over the course of the last week…
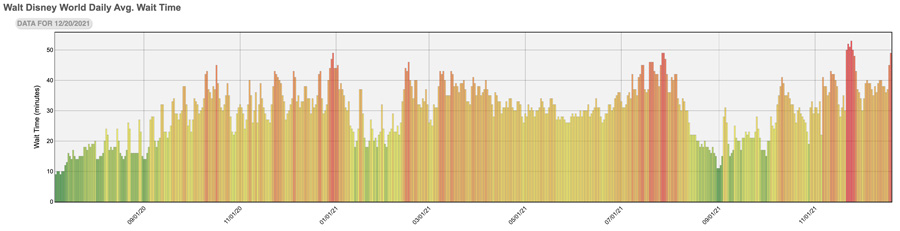
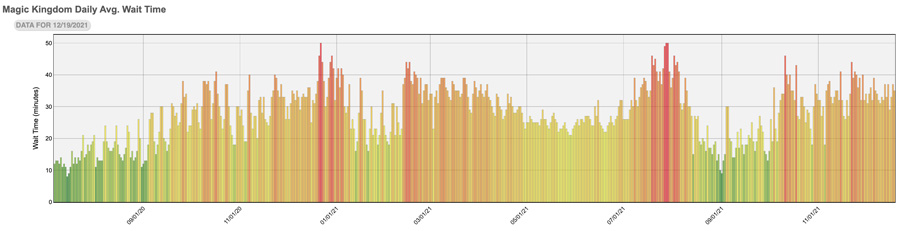
We’ll start with a high level look at weekly wait time averages across the entirety of Walt Disney World. (As always, all graphs and wait time stats courtesy of Thrill-Data.com.)
Thanksgiving week still represents the peak of this year thus far, with something of a lull in mid-December when it comes to wait times. It’s difficult to decipher, but this weekend–December 18-19, 2021–show a spike on par with the week leading up to Thanksgiving. In fact, this Saturday was significantly busier than the Saturday before Thanksgiving, with Sunday only one minute lower than its Thanksgiving week counterpart.
Breaking this down by park, where we’ll briefly look at Magic Kingdom. As has been the case for the last month, there’s little variance in daily wait times.
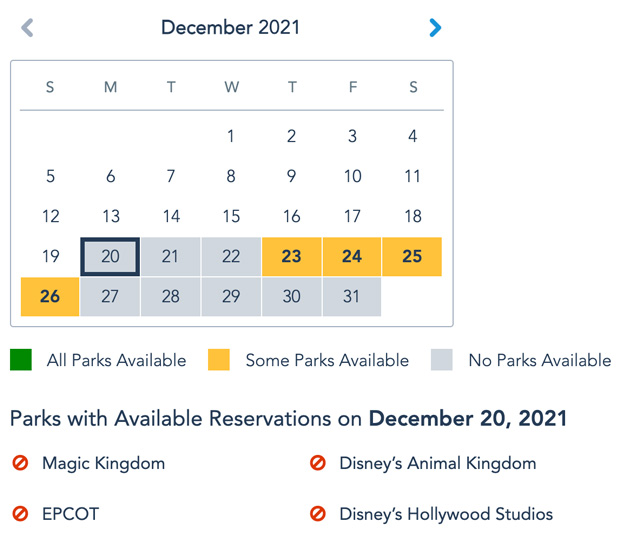
Most of this is explained by the lack of Disney Park Pass availability for Magic Kingdom. Fully booked is fully booked. Perhaps the more surprising thing is that Disney has seemingly capped crowds at lower levels than back in July, when fully booked days peaked higher.
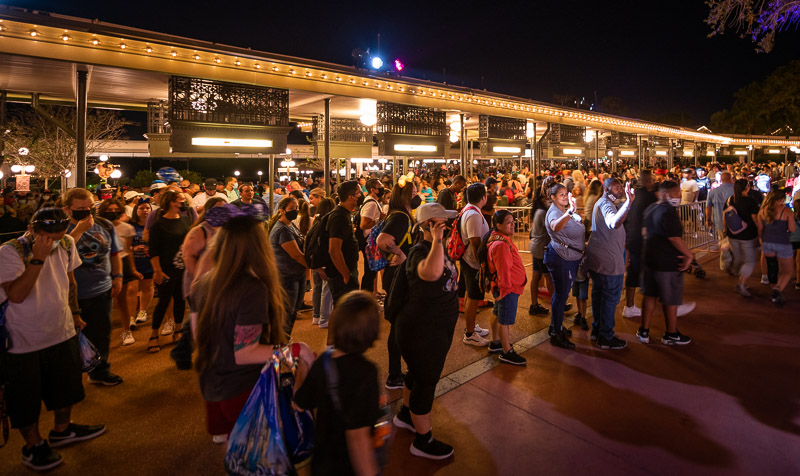
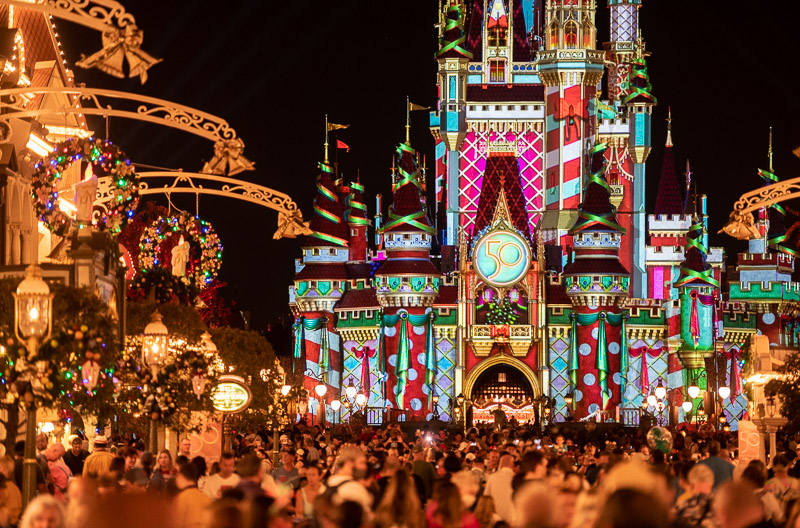
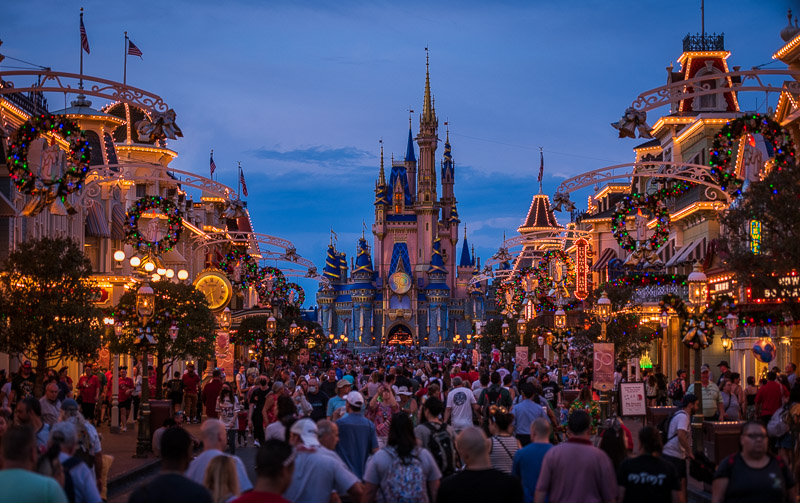
If I had to guess, the reason for the lower cap is probably front-of-park congestion for Christmas castle projections, Disney Enchantment, and the mass exodus thereafter. Daytime density throughout the park can be bad, but we’ve yet to see anything on par with late July. Peak crowding occurs on Main Street in the evenings, which is somehow significantly worse than late summer.
This is something we’ve mentioned a few times, but we’d implore you to wait out the post-fireworks crowds before leaving Magic Kingdom. The congestion is borderline unsafe, and has been for the last month. You’re either going to be waiting for transportation in a sea of humanity outside the park or in a more pleasant situation inside Magic Kingdom. Walt Disney World will not strand you, so take your time leaving.
Mind you, this is with Walt Disney World artificially limiting crowd levels at Magic Kingdom. The above graph would look very different if Disney Park Pass were eliminated and organic demand were allowed to play out. Walt Disney World’s flagship castle park usually draws higher attendance than the other three–especially around Christmas.
This isn’t to say Disney is being “responsible” with crowding on Main Street and outside the entrance after park closing. Just that it could be even more chaotic, if things were allowed to unfold naturally. Just because the current situation is bad doesn’t mean it couldn’t be worse.
At this point, the Disney Park Pass system doesn’t exist for keeping crowds low–that hasn’t been the case for ages. It’s to keep them manageable and prevent attendance from overwhelming staffing levels and available resources. Some fans have advocated for eliminating reservations “since the parks are busy regardless.”
This perspective overlooks the possibility that crowds could get so much worse if this were allowed to play out in free-for-all fashion. Walt Disney World still is not equipped to handle the same guest loads as in a normal year. I’m no fan of the reservation system in the long term, but it’s a “necessary evil” in the short term given the demand-capacity imbalance.
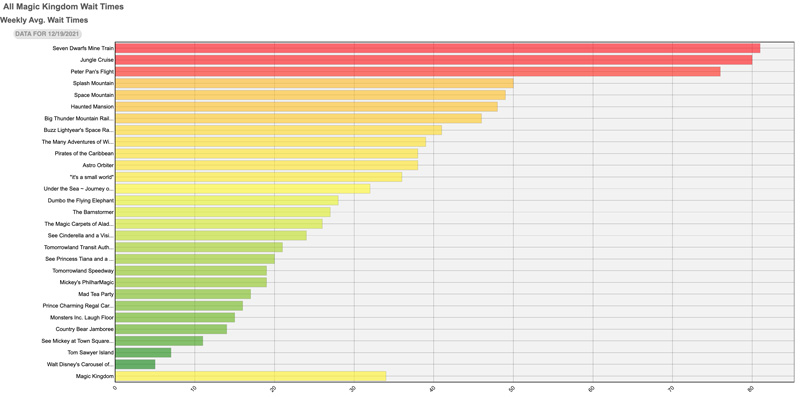
Above is a look at Magic Kingdom average daily wait times by attraction for the last week.
Jungle Cruise is averaging 80 minutes, Seven Dwarfs Mine Train is averaging 81 minutes, and Peter Pan’s Flight is at 76 minutes. These highs are all just a tick lower than in our last crowd report, but other rides were higher, resulting in an average wait of 34 minutes. That’s still good enough for Magic Kingdom to hit 8/10 on the crowd calendar as measured by wait times.
That alone should underscore how this is not a measure of “feels like” crowds. Anyone who was part of that post-fireworks mass exodus would likely tell you it felt like an 11/10 on the crowd calendar.
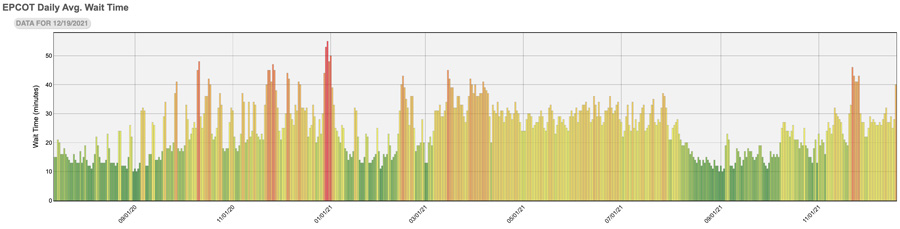
Continuing to Epcot, where crowd levels once again spiked over the weekend to their pre-Thanksgiving levels with December 19, 2021 hitting 9/10 on the crowd calendar.
As always, “feels like” crowds at Epcot–especially in World Showcase–are always worse on weekends and evenings. We’ve spent a ton of time at Epcot this holiday season and our anecdotal experience is that the park has felt very busy almost every night. Wait time data simply does not tell the full story–or even the best story–when it comes to Epcot. There are simply too few rides and too many other reasons why people visit Epcot.
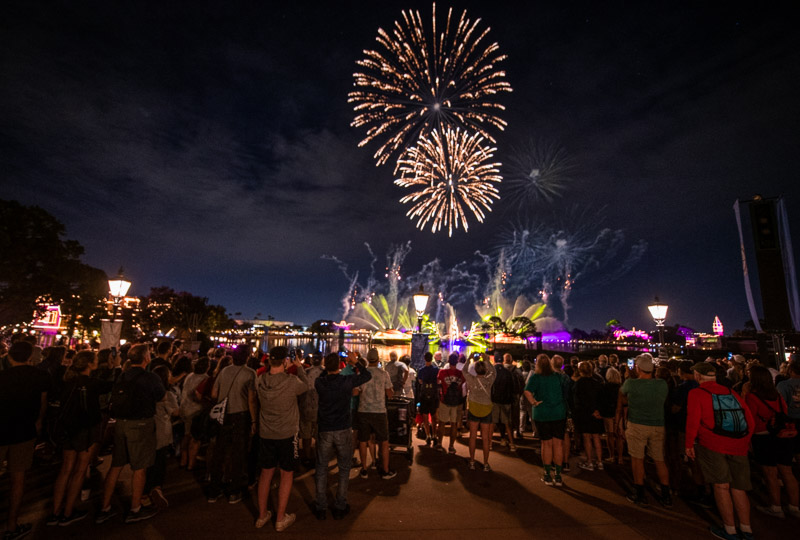
In particular, Harmonious viewing is pure chaos.
Speaking of which, we’d implore you to read our Best Harmonious Viewing Locations at Epcot for advice on where to see the new nighttime spectacular. We regularly see guests camped out 6+ rows deep in spots that offered good views of IllumiNations, but are subpar for Harmonious.
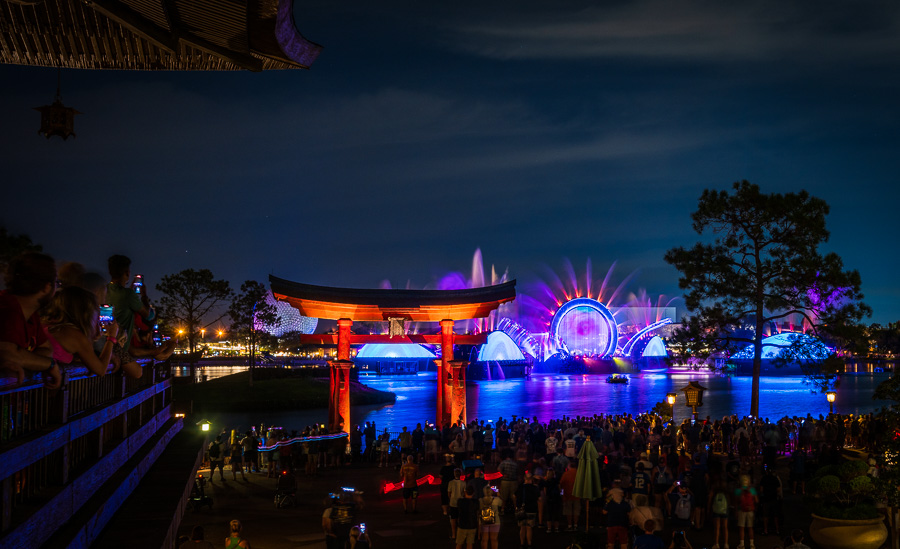
You are better off just standing in the uncrowded courtyards of Japan or Italy than packed like sardines on the bridge between France and the United Kingdom. That was a great view for IllumiNations or Epcot Forever, but not Harmonious!
This is a very different nighttime spectacular, and the viewing advice has changed. However, guests haven’t “caught up” to that, and are still staking out subpar spots. It’s sort of like when Main Street Electrical Parade ended, but people kept camping out for it on the curbs every evening for months because they were reading outdated resources.
(If you take away absolutely nothing else from this post, it’ll be worth your time for the tidbits about leaving Magic Kingdom and watching Harmonious. Seriously, so many headaches can be avoided with those two tips.)
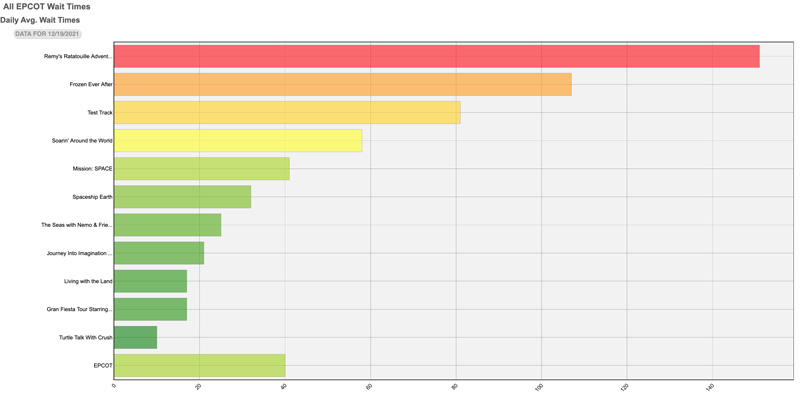
Anyway, here’s the attraction breakdown for Epcot.
Remy’s Ratatouille Adventure remains the anomaly that we might as well throw out from the data. Following that, Frozen Ever After is still averaging an extremely high 107 minute wait, and Test Track is at 81 minutes. Everything else, including Soarin’ Around the World, is under an hour. As we’ve mentioned before, Future World becomes a ghost town after 8 pm and ~95% of the guests in Epcot all cram into World Showcase.
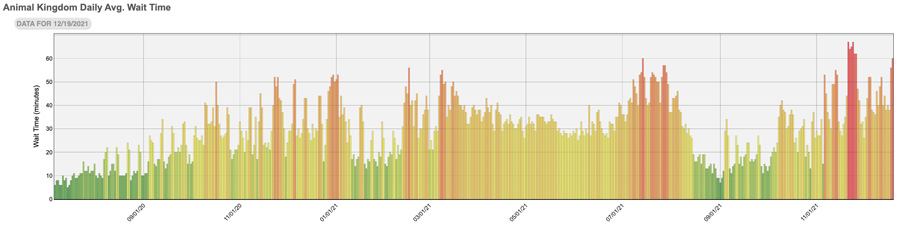
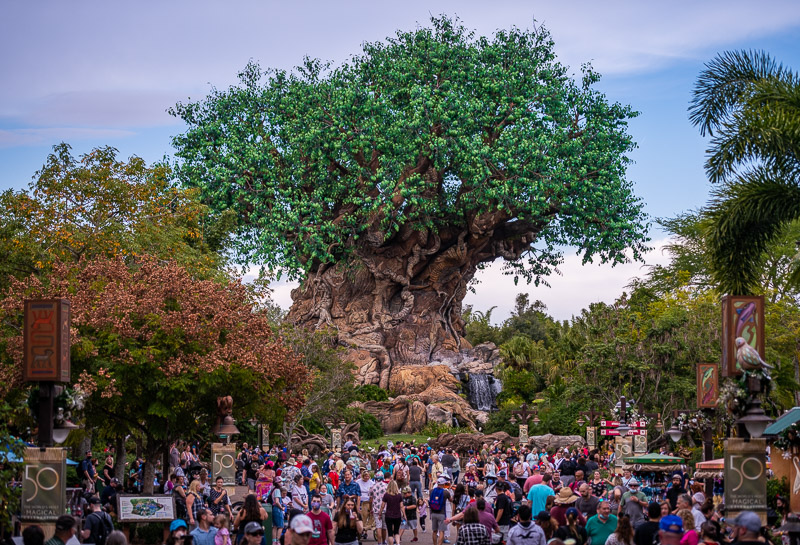
Animal Kingdom is once again climbing to pre-Thanksgiving wait times, and we’d expect that trend to worsen over the course of this week.
This weekend saw 10/10 crowd levels, with hour-long averages. Granted, there aren’t many rides in Animal Kingdom, but that’s still not great. Spoiler: it’s not going to get any better until 2022.
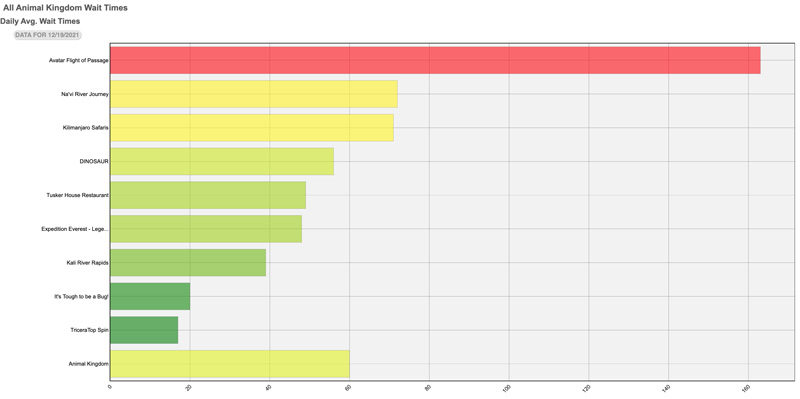
Over the weekend, Avatar Flight of Passage averaged 162 minutes (!!!) and Na’vi River Journey averaged 71 minutes. Kilimanjaro Safaris wasn’t much better at 70 minutes, while Dinosaur averaged 56 minutes. Tusker House Restaurant is also on that list for some reason, which I can only assume is a scraping error. Then again, we haven’t dined there in a few months–perhaps they added a ride inside since then.
Expedition Everest “only” averaged 48 minutes. That’s much higher than it was before as an Individual Lightning Lane attraction, but almost certainly not the highest it’ll go now that it’s on Genie+ temporarily(?). We continue to recommend staying late at Animal Kingdom, even if that means arriving late. You’ll encounter significantly lower posted wait times after 5 pm, and the actual wait times will be even lower than that.
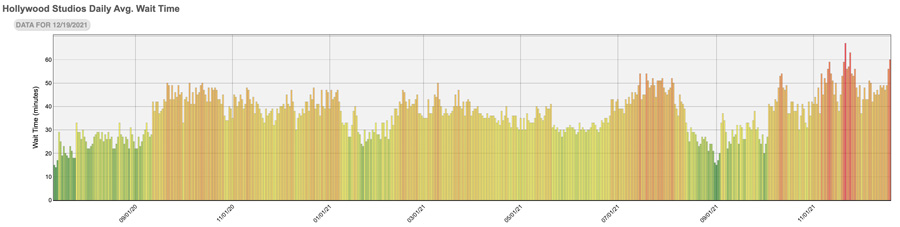
Finally, there’s Disney’s Hollywood Studios. This continues to be the busiest park at Walt Disney World, and it’s back at 10/10 crowd levels. We were not at DHS over the weekend, but will be later this week and are already dreading it. Hollywood Studios is unpleasant when wait times are 8/10–it’s downright miserable at 10/10.
Disney’s Hollywood Studios simply cannot absorb crowds with its current lineup. On the plus side, Indiana Jones Epic Stunt Spectacular is now back–we’ll see to what degree that helps things. Our guess: not at all. Walt Disney World likely increased the attendance cap by a corresponding degree, meaning it all nets out on fully booked days. (Honestly, I wouldn’t bet against DHS waits getting worse with the return of Indy.)
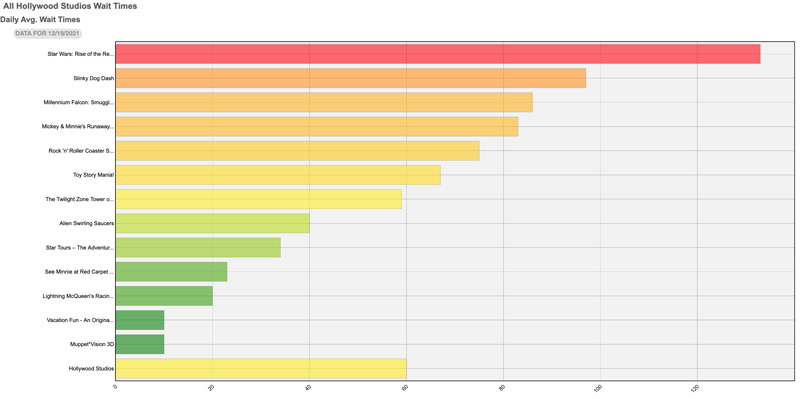
On Sunday, Star Wars: Rise of the Resistance averaged a 133 minute wait time, Slinky Dog Dash averaged 97 minutes, Millennium Falcon Smugglers Run averaged 86 minutes, Mickey & Minnie’s Runaway Railway averaged 83 minutes, Rock ‘n’ Roller Coaster averaged 75 minutes, Toy Story Mania averaged 67 minutes, and Twilight Zone Tower of Terror hit 59 minutes.
The total average time it would take to do all 7 of those rides is exactly 600 minutes–or 10 hours. Tack on another 40 minutes if you wanted to do Alien Swirling Saucers for some reason. It would take you from park open to close just to do those attractions, plus lunch and dinner. That’s without any shows, meet & greets, shopping, etc.
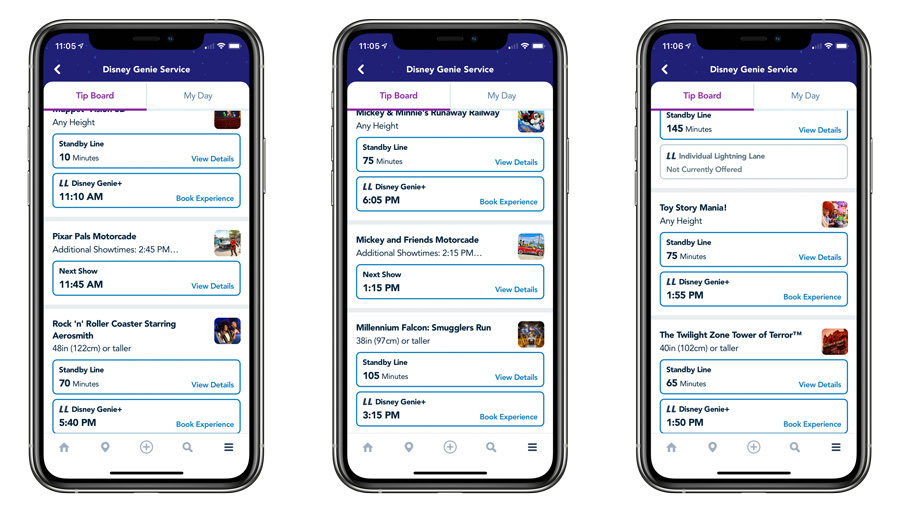
This is why Genie+ is worth it at Disney’s Hollywood Studios, even if you’re only able to knock out 3 headliners with it. That’s the likely scenario given that Slinky Dog Dash is gone within seconds and Millennium Falcon Smugglers Run fills up in under 2 hours after that (the latter is often refilled throughout the day, though).
As I sit here writing this on December 20, approximately 3.5 hours after park opening, every headliner except Slinky Dog Dash is available with return times before 5 pm. (Follow our Speed Strategy for Genie+ Selections and DHS Lightning Lane Ride Ranks to max out your Genie+ count at Disney’s Hollywood Studios.)
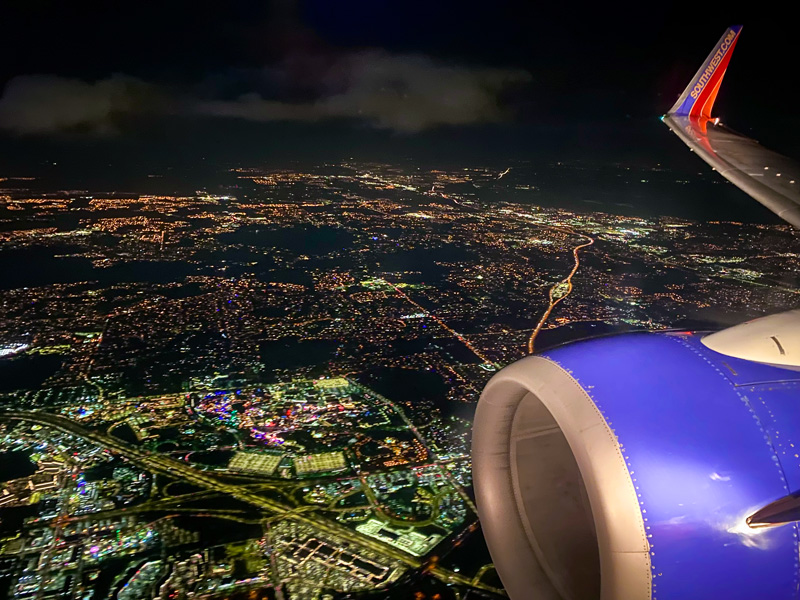
Looking forward, you can expect sky-high crowd levels throughout the next two weeks. This should end up being one of the 5 busiest weeks of the year–unless Walt Disney World set reservation caps lower after seeing the chaos of Thanksgiving. Orlando International Airport last night was far and away the busiest I had seen it in the last two years, and supposedly, MCO was even busier on Saturday. (It was quite the contrast to GRR, which was a ghost town by comparison.)
If I had to guess, going off nothing except instinct, my prediction is that wait time and crowd levels will peak for this week on December 22 or 23. Christmas Eve and Day will still be incredibly busy, but probably not as consistently crowded throughout those entire days due to guests doing “family stuff,” table service dinners, and so forth. That alone will act as a bit of a release valve on wait time numbers. It’ll still be an incredibly crowded couple of weeks, but that plus Park Pass limits and AP blockouts will prevent things from really spiraling out of control. We’ll be in the parks throughout this week to test Genie+ changes and see daily ops of Christmas entertainment, so we’ll keep you posted on how things are going.
Planning a Walt Disney World trip? Learn about hotels on our Walt Disney World Hotels Reviews page. For where to eat, read our Walt Disney World Restaurant Reviews. To save money on tickets or determine which type to buy, read our Tips for Saving Money on Walt Disney World Tickets post. Our What to Pack for Disney Trips post takes a unique look at clever items to take. For what to do and when to do it, our Walt Disney World Ride Guides will help. For comprehensive advice, the best place to start is our Walt Disney World Trip Planning Guide for everything you need to know!
YOUR THOUGHTS
Predictions on crowds for the two weeks before Christmas 2021? Thoughts on our forecast, analysis, or anything else? Agree or disagree with our take on “feels like” crowds v. wait times? If you’ve visited in prior months during the last year, how did crowds compare between then and now? What did you think of the wait times? Any parks or times of day noticeably worse than the others? Do you agree or disagree with anything in our report? Any questions we can help you answer? Hearing your feedback–even when you disagree with us–is both interesting to us and helpful to other readers, so please share your thoughts below in the comments!


Went to Disney 12-27/12-31-21. Parks were packed with people all day but especially afternoon. The park hopper option was available the entire time. Disney is certainly NOT worried about Covid. Stayed at Art of Animation because they let you bring your dogs. That was cool but they want to inspect your room each day. So you need to have someone walk the dog while you wait for housekeeping to breeze through your suit. Night time was a no go to any park for us. We have annual passes & are DVC members. Disney has taken away so many perks it is not worth going anymore. They even took away free pictures for annual pass holders. The app is ridiculous. It fails & uses all of your cell power. Had to buy a charger. Hate having to order food & you pick it up & it’s cold & drinks watered down. The Genie/lighting lane is a money grab. OMG Disney you are not magic any longer.
@Tom, I’m here now, and it seems they’ve made some additional changes to Genie. My S-I-L booked at 7am, arrived at park opening, and has been able to hold and redeem one at a time only, but able to book upon redemption. . I slept in and stacked using the 120min rule, but even after arriving at the parks was limited to 120min (not ride redemption) so it seems the app will choose one or the other path and not allow you to take advantage of both
@NZ What world are you living in where scooter users get on rides faster? If they are registered with DAS (which not all of them are) they are entitled to one ride reservation at a time with a wait time as long as the regular standby line.
I am a 100% disable Vet and fat due to not being able to take care of myself as I once did. Not all scooter rider’s want to be in your way, they just want to see the park as best they can. I do not take issue with the number of scooter or the fact some people to not pay attention when driving him. But remember in some case’s they had to put up with a lot of upsetting things in their life’s to get to the scooter stage Tom is right it is hurtful to alway hear you are in anyones way. But I also need to be aware everyone paid a lot for maybe that one day in the park and it always seem like the best day of your life.
Spent last week at WDW. Stayed at Pop Century.
* The Skyliner is one of the the best things Disney has ever done. A super easy and relaxing way to get to DHS and Epcot.
* On the night we went to the Christmas event at MK the line to enter the park at 7PM nearly stretched all the way to the Contemporary.
* The parks are having supply issues. There was NO adult apparel with the 50th logo or 2021 available anywhere, including the Disney store at Disney Springs. Very disappointing.
* Got some great dark ride photos thanks to Tom’s tips and got to every attraction we wanted to do thanks to Tom and Genie+.
I was at WDW from 12/12-12/17, I didn’t find the crowds overwhelming, but in general the parks have lost some of their magic, which is caused by:
1. Having to use the app for everything, I found myself glue to my phone, all day long. And forget about finding an outlet to recharge. You really need to invest in a portable phone charger, <$20
2. The constant annoyance of cast members hounding you to put on you mask.
3. The Genie+ system which still has numerous bugs in it
4. Numerous rides are constantly breaking down
I have an annual pass, but will not return in the next few months
I also agree there are to many scooters in WDW. Is possibly because you can get on the the rides faster also?
We rode The Millinium Falcon several times in a row on the single rider entrance. We were all adults, so we did not mind.
We made it to the Indiana Jones show on the 19th. The seats were packed 15 minutes prior to showtime. We had such a great vacation, despite the enormous wait times. Your guides helped get the most out of it and we are very grateful.
Can we please not turn the comments section here into a debate about ECVs? It’s not relevant, and no one is going to change anyone else’s mind–or Disney’s policies, for that matter.
I get that there are elements of this topic that fall into pet peeve territory, people want to vent, etc. Just keep in mind that there are real people on the other end of this with feelings, reading those comments, who need ECVs and already feel judgmental stares or viewed as burdensome by other guests when at the parks.
Do you anticipate 9/10 crowds and wait times for marathon week?
About a week ago, I would’ve said yeah–8/10 to 9/10 that week.
Now? I’m not so sure. Omicron is already exploding case numbers and that’s only going to get worse with Christmas gatherings. I suspect that will result in some cancellations for January/February, but maybe not by Marathon Weekend. It also seems like the overwhelming majority of Americans are ready to get back to normal; the circumstances are very different this year as compared to last, as almost everyone has some form and degree of immunity. So there may not be an appreciable number of cancellations, at all, no matter how this plays out.
I though Scott made a very fair & true comment on the ridiculous number of scooters around Disney, and the undeniable use of them by many who are lazy, or simply out of shape due to their own personal life decisions.
Attacking him for that comment would indicate somebody’s got their head deep in the sand, or is guilty of misuse themselves.