
December Crowd “Slowdown” at Disney World
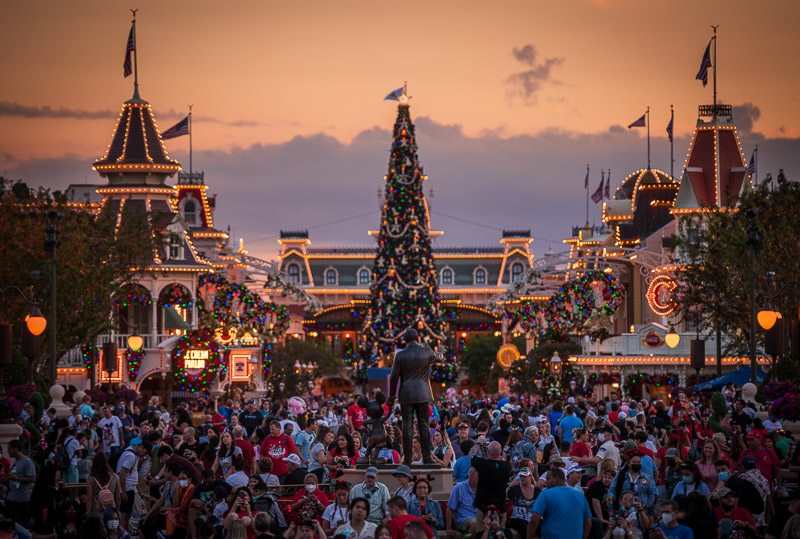
Wait times have dropped in the first two weeks of December 2021 at Walt Disney World, as predicted. This crowd report shares recent data, thoughts on what’s likely to happen next with attendance this week, and why wait times don’t tell the full story–or anywhere close to it–of high holiday season “feels like” crowds in the parks.
We’ve spent a lot of time in Walt Disney World the last couple of weeks, putting our money where our mouths are (I guess? We have APs so it’s not like we’re actually paying for each visit?) during our favorite week of the entire year at the parks. (See our Best & Worst Months to Visit Walt Disney World for 2021-2022.)
Despite it being our top pick, that’s largely for qualitative reasons and not purely wait times. The first week of December is the best week of the month, but it’s during a season that sees higher attendance across the board. Early to mid-December is still significantly busier than mid-September. The difference is that Walt Disney World doesn’t celebrate Christmas during mid-September (yet).
Anyway, our expectation for early December crowd levels were numbers in the 8/10 range, with some dates and parks dipping into 6/10 or 7/10 territory. Still on the upper end of the spectrum for the entire year, but lower relative to other holiday season dates.
Let’s turn to crowds as measured by (standby) wait times to see how those predictions turned out…
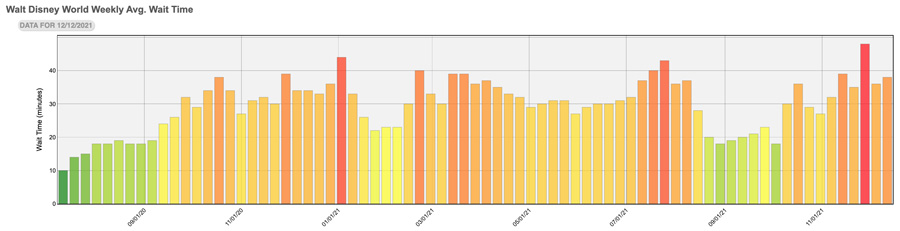
Let’s start with a high level look at weekly wait time averages across the entirety of Walt Disney World. (All graphs and wait time stats courtesy of Thrill-Data.com.)
As you can see, Thanksgiving week (the tallest red line) is plainly the highest bar on the graph, with an average wait time of 48 minutes. This surpasses the previous peak in July of 43 minutes, as well as last New Year’s week, which hit 44 minutes.
The week following Thanksgiving averaged a 36 minute wait time, which is down considerably but still sufficient for an 8/10 score on the crowd calendar. Last week averaged a 38 minute wait, good enough for a 9/10 on the crowd calendar.
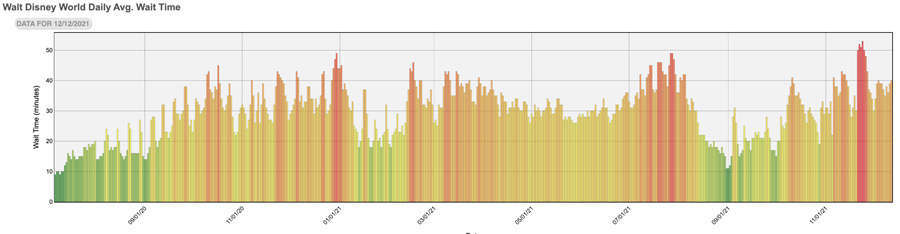
Breaking it down by day, the peak of the Thanksgiving crowds dwarf wait times both before and after the holiday. Most of the dates after those highest highs are still in the 7/10 to 9/10 range, they just look a lot lower because Thanksgiving wait times were so much higher. The scale caps out at 10/10, otherwise those dates would be well above the upper limit.
This is part of why “feels like” crowds didn’t seem as bad after Thanksgiving for those who had experienced the parks in the days before the holiday. When your frame of reference is the highest 10/10 days of the year, a normal 8/10 feels blissfully uncrowded. It’s all relative.
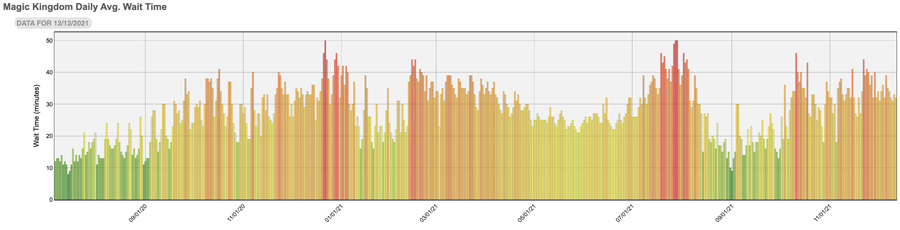
Breaking this down by park, where we’ll start with Magic Kingdom. This is the only park for which we’re going to look at the daily averages, because it’s the only one that doesn’t have such a sharp contrast between Thanksgiving week and subsequent weeks.
Most of this is explained by the lack of Disney Park Pass availability for Magic Kingdom. Since reservations have been ‘sold out’ for almost every single day, there’s not much variance in crowds among days. Fully booked is fully booked. Perhaps the more surprising thing is that Disney has seemingly capped crowds at lower levels than back in July, when fully booked days peaked higher.
It should go without saying, but the above graph would look very different if Disney Park Pass were eliminated and organic demand were allowed to play out. Walt Disney World’s flagship castle park usually draws higher attendance than the other three–especially around Christmas.
At this point, the Disney Park Pass system doesn’t exist for keeping crowds low–that hasn’t been the case for ages. It’s to keep them manageable and prevent attendance from overwhelming staffing levels and available resources. Some fans have advocated for eliminating reservations “since the parks are busy regardless.”
This perspective overlooks the possibility that crowds could get so much worse if this were allowed to play out in free-for-all fashion. Walt Disney World still is not equipped to handle the same guest loads as in a normal year. I’m no fan of the reservation system in the long term, but it’s a “necessary evil” in the short term given the demand-capacity imbalance.
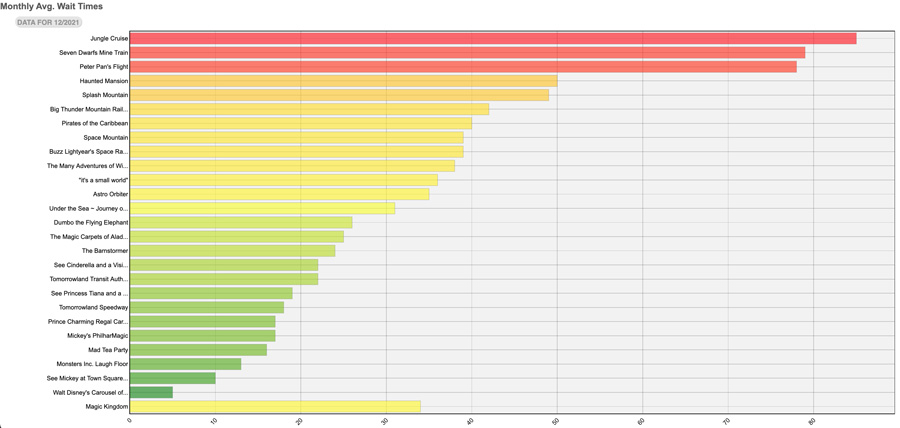
Since this crowd report encompasses the last two weeks, or essentially the first half of the month thus far, we’ll look at average attraction wait times for December 2021.
Jungle Cruise is averaging 85 minutes, Seven Dwarfs Mine Train is averaging 79 minutes, and Peter Pan’s Flight is at 78 minutes. Everything else is under an hour. Haunted Mansion is back in the top 5, as is Splash Mountain thanks to warmer temperatures the past couple weeks. Space Mountain is only at 39 minutes, which isn’t a huge surprise as we’ve seen its average dip lower due to lack of demand for Individual Lightning Lane.
As discussed in our “Sweet Spot” for Genie+ at Walt Disney World, this is the park least likely to have issues with the paid FastPass service. Even guests who take a more laid back approach with that should’ve had no issue scoring Lightning Lane reservations for Peter Pan’s Flight, Jungle Cruise, and Haunted Mansion at the absolute minimum. That would’ve saved an average guest roughly 3 hours waiting in line. (See our Magic Kingdom Genie+ Priorities & Lightning Lane Ride Ranks.)
Magic Kingdom is a great “training wheels” park for guests who are anxious about Genie+ but still wanting to test out the service. It’s the most forgiving park due to the higher ride count–figure out the learning curve here before moving on to Hollywood Studios, where the stakes are higher and it’s harder to do well.
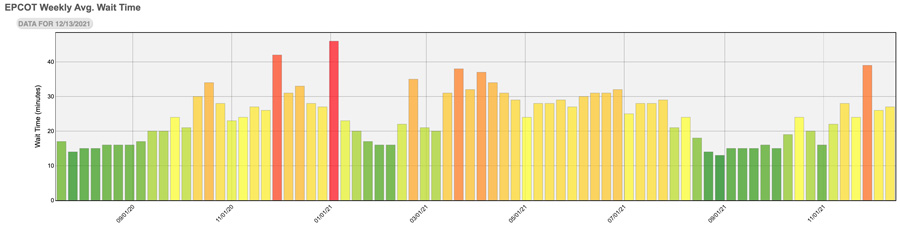
Continuing to Epcot, where crowd levels are now back down to their pre-Thanksgiving levels once again. After spiking to a 10/10 for the holiday, levels are back to 6/10 the last two weeks.
As always, “feels like” crowds at Epcot–especially in World Showcase–are always worse on weekends and evenings. We’ve spent a lot of time at Epcot in the last few weeks and our anecdotal experience is that the park has felt very busy most nights.
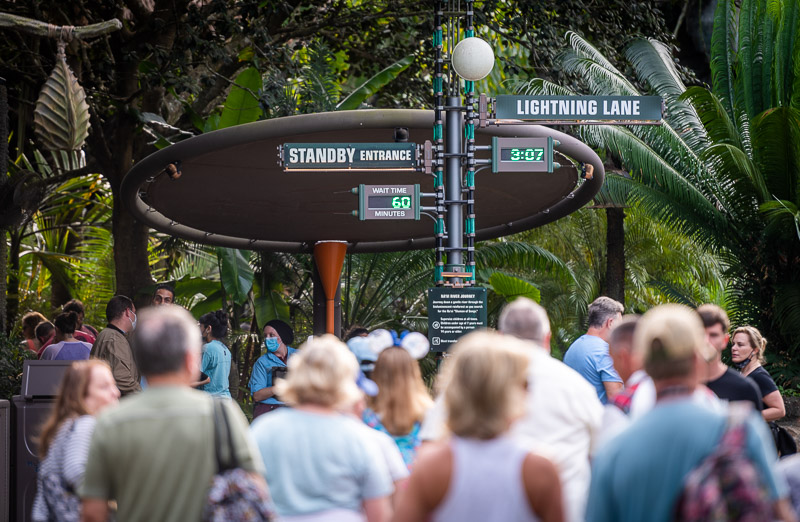
Wait time data simply does not tell the full story–or even the best story–when it comes to Epcot. There are simply too few rides and too many other reasons why people visit Epcot. Still, this is a data-driven report and there’s no other good way of objectively measuring crowds. We’ll just emphasize that a holiday season 6/10 is much busier than a 6/10 in late June.
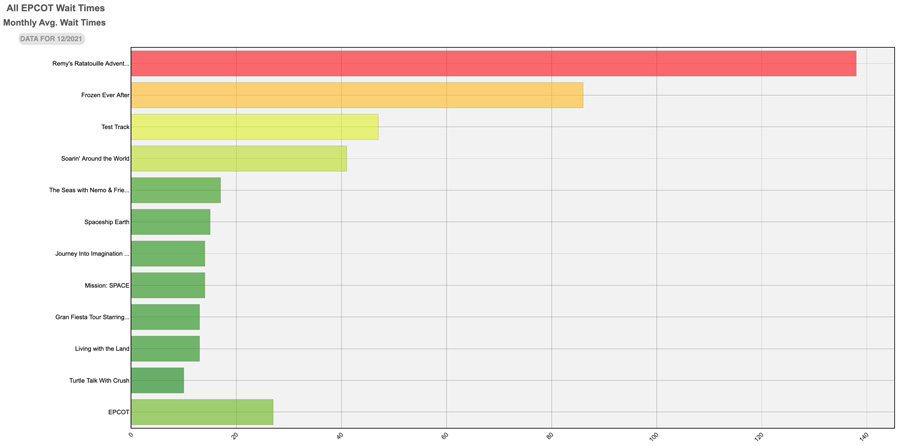
When looking at attraction wait times, you could actually argue that the opposite is true. That’s because June wait times would not have been skewed by Remy’s Ratatouille Adventure, which doesn’t have a traditional queue.
Once you get past that, Frozen Ever After is still averaging a very high 86 minute wait, but Test Track and Soarin’ Around the World are both under an hour. The actual wait times for both–and everything else–plummet in the evening, as Future World becomes a ghost town and ~95% of the guests in Epcot all cram into World Showcase.
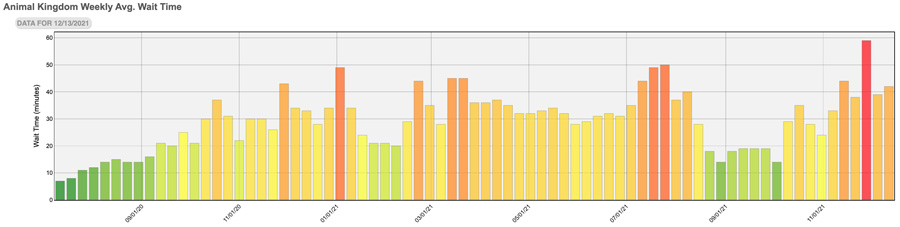
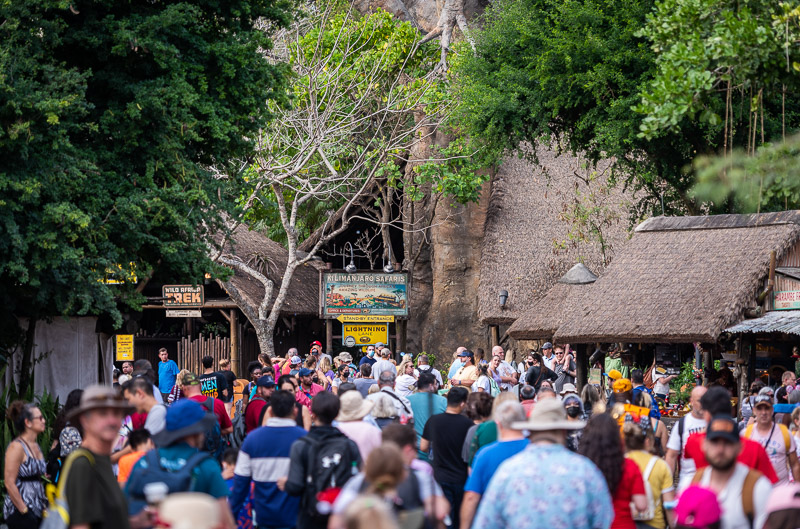
Animal Kingdom had its busiest week of the year Thanksgiving week, and by a wide margin. The average wait time was 59 minutes, which is significantly higher than the previous peak of 50 minutes at the end of July. (Note that both qualify as 10/10 on the crowd calendar.)
The two weeks since have been 8/10 and 9/10, respectively, which is still pretty high…but a significant comparative drop.
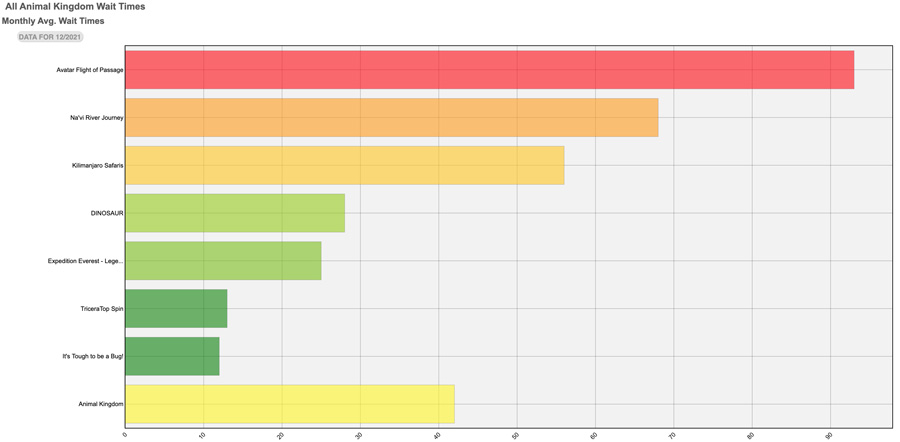
Thus far in December, Avatar Flight of Passage has averaged 93 minutes and Na’vi River Journey averaged 68 minutes. Kilimanjaro Safaris averaged 58 minutes, Expedition Everest averaged 25 minutes, and Dinosaur averaged 28 minutes.
We continue to recommend staying late at Animal Kingdom, even if that means arriving late. We experienced Expedition Everest and Dinosaur as walk-ons in mid-afternoon, and Kilimanjaro Safaris pretty close to a walk-on. The Pandora attractions were likewise not nearly as bad–both tend to peak relatively early in the day.
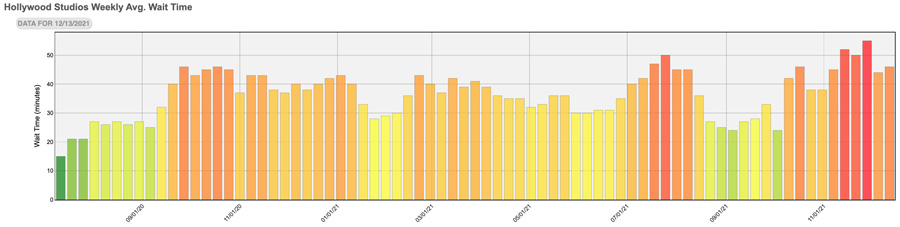
Finally, there’s Disney’s Hollywood Studios. After three straight weeks of 10/10 crowds, DHS feel to 8/10 in the first week of December and 9/10 last week.
DHS continues to be the busiest park at Walt Disney World, and anything above 7/10 here is arguably in unpleasant territory. I doubt many people in the park on only the “less busy” days in the last couple of weeks would describe their visit as such. Disney’s Hollywood Studios simply cannot absorb crowds. Indiana Jones Epic Stunt Spectacular cannot come back soon enough. Even then, it needs the other stage shows, nighttime spectaculars, and more additions to fix the problems. This is nothing new–see our pre-closure post: Disney’s Hollywood Studios: WDW’s Best Rides & Most Frustrating Park.)
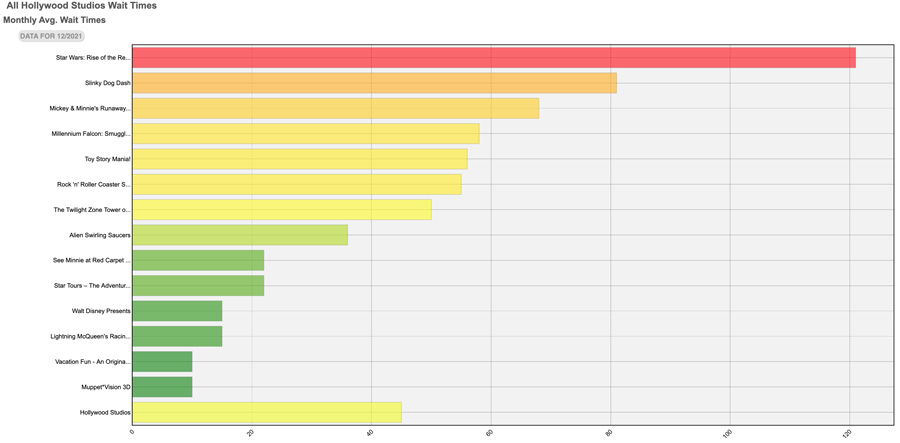
During December, Star Wars: Rise of the Resistance is averaging a 121 minute wait time, Slinky Dog Dash is averaging a 81 minute wait, Mickey & Minnie’s Runaway Railway is averaging 68 minutes, Millennium Falcon Smugglers Run is averaging 58 minutes, Toy Story Mania is averaging 55 minutes, Rock ‘n’ Roller Coaster is averaging 55 minutes, and Twilight Zone Tower of Terror is doing 50 minutes.
These are the longest averages for headliners in any park at Walt Disney World, and the only reason the average wait time is brought down is because it includes things that don’t really have wait times.
We’ve been in the parks a lot both before and after Thanksgiving, and there’s a clear before/after divide in wait times. That’s undeniable, as it’s evident in the data above. This is especially true for the parks that aren’t Magic Kingdom.
Although anecdotal, our perception of “feels like” crowds doesn’t reflect the same. It definitely hasn’t been as bad the last two weeks, but it has still been packed–busier than I would’ve expected for the first two weeks of December, especially without Pop Warner. To the contrary, the last couple of weeks have felt like the busiest early December we’ve ever experienced at Walt Disney World.
Our best explanation for this discrepancy is that there are two different demographics at play. During Thanksgiving week, tourists with breaks from school descend upon Orlando. These guests are largely infrequent or first-time visitors, and are more likely to prioritize attractions–even when wait times are high.
In the weeks that follow, there are fewer travelers and more locals. Among the tourists, there are disproportionate numbers of DVC members and other more regular non-locals. All of these groups are less likely to prioritize rides (that they’ve done before, some many times) and more likely to do “other things.” This explains the gap–more like a chasm–between the feels like crowds in World Showcase, and the 6/10 crowd levels as determined by average wait times.
This really isn’t bold or highly speculative analysis. Orlando International Airport numbers show a steep drop-off in travelers between Thanksgiving week and the last two weeks, as should be expected.
The best recent example of this phenomenon is October 1, 2021. Anyone in Magic Kingdom that day could tell you that the park was absolutely packed, with long lines at everything from counter service restaurants to gift shops. Everything except rides, which indicated a 1/10 crowd level that day. That’s because the people visiting that day disproportionately were not there for attractions, so wait time data did not even begin to pick up actual attendance levels. This is an exaggerated example, but the same idea holds true other weeks of the year–including during the Christmas season, when there are other reasons than rides that people visit Walt Disney World.
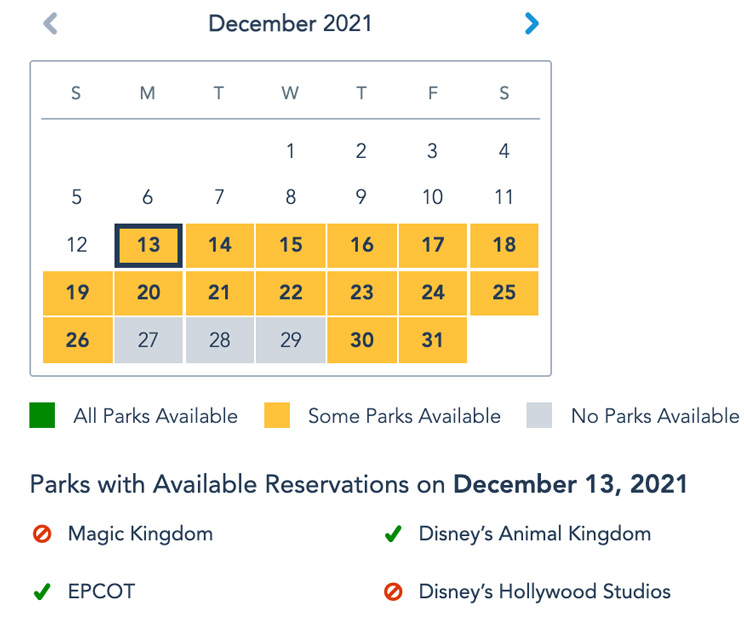
Looking forward, you can expect crowd levels throughout this entire week on par with or above the last two week’s levels. This week, the only park fully booked for Park Pass reservations (for now) is Magic Kingdom, plus Hollywood Studios on a couple of days. Don’t be surprised there’s less availability by mid-week, as locals start realizing this is pretty much be their last chance to visit before the Christmas and New Year’s Eve blockouts take effect.
Crowds should further increase heading into the week…because they always do. That’s when tourists start arriving in full force for the week of Christmas, which should end up being one of the 5 busiest weeks of the year–unless Walt Disney World sets reservation caps lower after seeing the chaos of Thanksgiving. We’ll be in the parks both this week and next, and will have more reports on our experience with holiday crowds, daily ops for Christmas entertainment, and more.
Planning a Walt Disney World trip? Learn about hotels on our Walt Disney World Hotels Reviews page. For where to eat, read our Walt Disney World Restaurant Reviews. To save money on tickets or determine which type to buy, read our Tips for Saving Money on Walt Disney World Tickets post. Our What to Pack for Disney Trips post takes a unique look at clever items to take. For what to do and when to do it, our Walt Disney World Ride Guides will help. For comprehensive advice, the best place to start is our Walt Disney World Trip Planning Guide for everything you need to know!
YOUR THOUGHTS
Predictions on crowds for the two weeks before Christmas 2021? Thoughts on our predictions? Agree or disagree with our theory that fewer tourists–but more locals–drove feels like crowds up and wait times down the last couple weeks? If you’ve visited in prior months during the last year, how did crowds compare between then and now? What did you think of the wait times? Any parks or times of day noticeably worse than the others? Do you agree or disagree with anything in our report? Any questions we can help you answer? Hearing your feedback–even when you disagree with us–is both interesting to us and helpful to other readers, so please share your thoughts below in the comments!


Hi Sarah! To clarify, we did Early Entry, which got us into the MK a half hour early (for all staying at Disney resorts plus some others — Tom has a good post on Early Entry). Then we were able to stay an extra two hours after the MK closed, for Extended Evening Hours (offered once per week at MK, open to deluxe resorts including the Dophin where we stayed).
Yes, we did Haunted Mansion, and though it was crowded in the stretching room, people were wearing masks and we weren’t super crammed together. We could have stayed by the wall to get a little extra separation from others. But yeah, we couldn’t have gotten more than a foot or so away.
Dee, thanks for the info. I am still on the fence but leaning towards going. I saw in your post that you said you got to go to extended hours for moderate resorts. Don’t all resorts get the extended hours? Did you do haunted mansion? I’m wondering about the elevator. We have always been crammed in there and that is not very appealing to me right now.
Hi Sarah, I’m just back from Disney World this week. I agree with Carol above, I’m sure Tom will have more comprehensive comments, but I generally felt pretty safe. We are extra careful, and always wore masks indoors, avoided indoor dining, and we wore masks outside when we felt like things were getting too close. Most people outside are not wearing masks or distancing at all. Not just because it’s crowded, most people just didn’t seem concerned. But the cast members were good about asking people to wear masks indoors and on rides, and most people complied. In lines for rides, most people did put their masks on but there was NO distancing. On rides, the cast members tried to distance by keeping to one party per row — we were never asked to share with another party even if there was space, which was nice. We took buses to parks, to Disney Springs, at less crowded times, so we never felt unsafe on buses. We didn’t do indoor dining — we either ate at outside table service restaurants, or got takeout and ate outside, or brought food back to our room at the hotel. Lots of options so this was not an issue.
Just back from four days at the Dolphin (which we loved) and just one day at the parks, which went much smoother than expected thanks to your tips! Tom, we followed your advice — researching LL return times in advance, starting at rope drop and then taking a break before returning later in the day, going to Peter Pan rather than SDMT at rope drop, etc. We did the morning at MK, then back to the hotel for a few hours when wait times increased after 11, then to Epcot for a few hours later in the afternoon, and then back to MK around 7:30.
Even tho the parks were crowded and MK was at max capacity, we were able to do 18 rides/attractions, and got 8 Lighting Lane reservations thru Genie+ (we didn’t pay separately for any Lighting Lanes). The longest we waited was 15 minutes for Splash Mountain, and that was because we got in line at 9:57pm, just before the park was closing at 10, along with lots of other people. (Some may think we’re nuts, but we skipped the fireworks so we could walk on to SDMT.)
For me the most important advice you gave was (1) to spend some time getting to know the waits and return time patterns before the trip, and (2) prioritize the rides/attractions we wanted to do most. A little extra work but this helped a ton! We basically got to do almost everything we wanted to do with little to no wait, and the key was choosing which rides to do at what time so we could minimize our wait. (During late afternoon we used Genie+ to reserve and immediately ride multiple attractions in Epcot back-to-back with literally no wait. And we ate at the Medina, which was great and had no line while lots of other food booths had massive lines…again thanks to your recommendation.) We walked a lot because we park-hopped twice (definitely much easier without kids!) but did not go back and forth once we got to the parks.
I didn’t love having to do all this work before the trip, and it definitely detracted a bit from the day while we were in the parks, but it was worth it. This is the system now, and we still had a GREAT time. We found Genie+ very easy to use and didn’t have any issues other than getting kicked off for about ten minutes at one point. Sorry this is a long post, but wanted to say thanks so much Tom for all your great advice, your articles here helped a ton!!!
On a side note — we only planned this trip a few weeks ago, but got a great deal at the Dolphin ($210 per night, plus the dreaded $35 resort fee). My room was advertised as “No View” but I had an amazing view of the MK fireworks, plus we got to enjoy the extended evening hours for deluxe resorts on Wednesday for less than the others cost. Loved the room, the dining, the pool, the holiday décor, the location, etc….highly recommend! Lastly, if you’re in the area, take the Skyliner from Caribbean Beach to Epcot during Epcot fireworks — very cool!
We visited Dec 3-9 at Disney World….unbelieveably packed with people every park we
went to. My husband has Parkinson’s, rented a scooter (which was a good thing), but even
that was a hassle at times….a woman crashed into him … hit & run. We paid big bucks for
the extra hours event on Dec 7th, and Magic Kingdom was FULL of people … never got
to the Haunted Mansion ride. I must say, though, that ALL cast members were super
helpful with him … getting him transfered to wheelchairs to get on rides, or getting him and
the scooter on a ride (Jungle Cruise). Nothing but PRAISE for the cast members , certainly
none for the crowds. Have visited 30+ times …. done. It was still memorable.
We celebrated our 59th Anniversary wearing a bridal veil and a top hat with tuxedo, with
Mickey ears….that was fun …. so many congratulations !!! Also memorable. Guess we’ll
try again in a couple of years, if still “kicking”.
Thanks Carol! That’s what I’m hoping that we can still distance. We just love being there an not worried a out getting to do everything or see everything. We are excited to play ping pong at the resort. Ha ha! We haven’t been since January 2020 so really missing it.
@Sarah hopefully you’ll hear from Tom with a really comprehensive response but three points jumped out at me after reading your comment based on our experience during our visit from December 8-12.
1) Disney cast members were polite but consistent and persistent about mask wearing in all indoor locations like rides and shops. During that time it was also possible for us to keep distance at outdoor locations. The only notable exception was a line for coffee and pastries at a joffries stand.
2) we arrived closer to the end of the early morning admission and seemed to avoid the crush from both the early morning and regular admission times.
3) you probably want to avoid universal because masking rules were definitely not focused on there.
Hi Tom! I’m REALLY hoping you see and can help me out. I have been postponing a trip for my daughter and myself since May of 2020. I kept pushing it back after the reopen because of Covid and I missed good opportunities. We are both now fully vaccinated, but I am seeing posts about the crowds and comments about the bathroom lines and that it’s not very clean. Can you give me your perspective on this? We are purely in it for rides and just wandering around. We don’t really care for fireworks , parades, dining, etc. is there a way to distance? We are avid mask wearers but in most pics I see it looks like barely anyone is masking. I’m not only concerned about Covid, it is also cold and flu season. The last time we were there was January 2020, the 22-27, right when news of the virus started to break. It was abnormally crowded for the time according to what people were saying, and the ride times were very long for most rides. It did feel very busy, even worse than spring break. I felt okay like we were still able to keep some distance back then. I’m just wondering now if we are crammed in the entire park like sardines, or are the pictures you post in the most busy areas? We are supposed to arrive Monday morning ( Dec 20) and leave Christmas night. I just want a real perspective to help me gain insight of if I should once again cancel or if I should take a deep breath and try it out. Also, how is the wonderland (not exactly sure what it’s called) putt putt? Is that any fun and does it get really crowded? I’m also wondering how it is with driving from the airport to the resorts, as well as driving from the resorts to the parks? We are thinking about renting a car to reduce exposure on the magic express and the Disney buses. What are your thoughts on that? I know that bite I’ll all be a risk and my personal choice. I could just really use some insight as to what the “risk” level feels like or if there are ways to distance and not feel overwhelmed. Thanks so much!!