
Summer Crowds Winding Down at Disney World
August has arrived, summer season is winding down, and the official start of Halloween 2023 is on the horizon at Walt Disney World. This wait times report covers ride & daily data for last month at Magic Kingdom, EPCOT, Hollywood Studios, and Animal Kingdom, while also offering predictions for the start of the Fall 2023 off-season.
By way of recap, summer crowds have followed a mostly-familiar pattern. Wait times increased gradually the week before Memorial Day through late June, before plummeting over the Independence Day holiday weekend. Although the entire summer was below-average, July 1-4 was an outlier. (See Why Are Weekends So Slow at Walt Disney World? for more on that.)
As it turned out, Fourth of July marked the slowest stretch of the summer season. Crowds rose in the week after that, before more or less plateauing mid-month. Here’s a look at what happened in late July and the first week of August 2023 as schools in the South have started going back into session…
As always, what’s covered in these “crowd” reports is actually posted wait time data scraped from My Disney Experience and compiled into graphs covering various days, weeks, and months. A lot can be gleaned from posted wait times, but it’s not necessarily conclusive of in-park congestion or crowds. Just wait times, which is the only objective way to measure crowd levels.
Wait times offer a ton of insight into how busy Walt Disney World is, but they are an imperfect measure of crowds. That’s especially true if you’re comparing current conditions to prior years. Walt Disney World attendance has increased by several million people over the course of the last decade-plus.
As a result, the vast majority of days in 2023 will be more crowded than their counterparts in 2015 or 2017. Same goes for comparing this year to 2020-2021. Really, the only worthwhile historical comparisons right now are 2023 vs. 2022 or 2019. The good news is that’s what’s measured here: how current crowds in 2023 compare to dates in the last year.
With that out of the way, let’s dig into the data and look at Walt Disney World wait times. As always, all graphs and stats are courtesy of Thrill-Data.com:
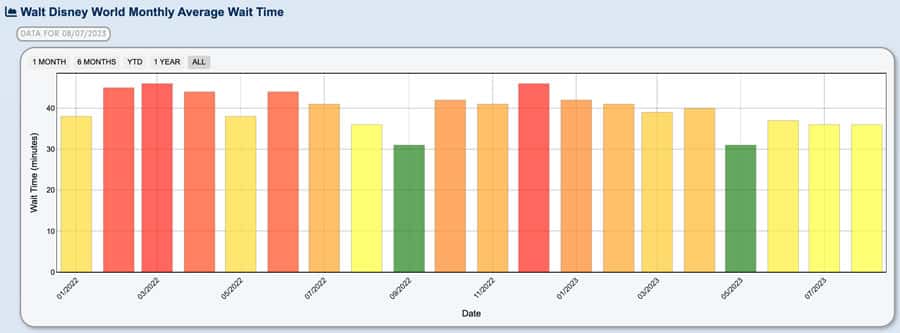
We’ll start with the monthly numbers for Walt Disney World as a whole. (The last bar is August 2023, which is only one week old at this point. This month will almost certainly end up having lower wait times than the last two, and maybe even May.)
Last month started slow, pretty close to on par with May. Wait times increased after that, but not to a significant degree. In the end, July was one minute slower than June, with an average wait time of 36 minutes. That’s as contrasted with a 41 minute average wait last July, and a 44 minute wait last June.

It may not seem like much, but this year-over-year decrease is significant for the summer months. Attraction wait times have been 5-8 minutes lower on average than the same dates last year. That adds up over the course of the day and is the basis for decreased crowd levels (6/10 and 8/10 vs. 2/10 and 3/10).
It’s not just the summer season. Every month this year since February has been slower than its counterpart in 2022. January 2023 was the last month that was busier than last year (significantly so, although at least part of that comes down to the timing of New Year’s Eve and winter breaks). The gap has grown since May, too.
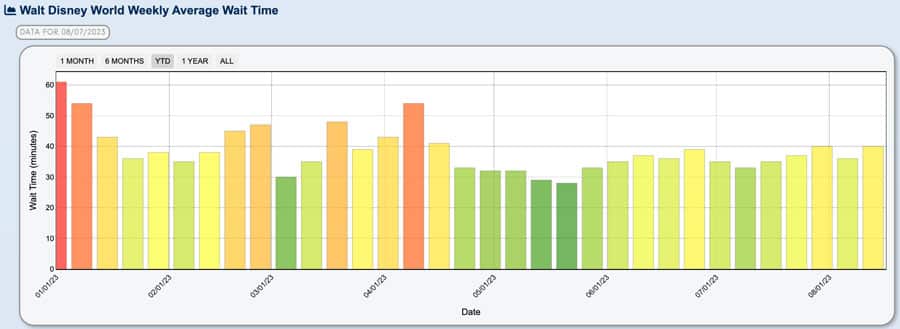
With the week by week view, we can see that wait times increased during each of the three weeks after Independence Day, to the point that the end of the month had some of the busiest days of the entire summer! This graph actually understates the difference between the beginning and end of the month, as you’ll see in the daily data.
Now that schools are starting to go back into session, it’s likely these numbers will drop even further. It’ll be interesting to see whether Walt Disney World is back to May levels by next week.
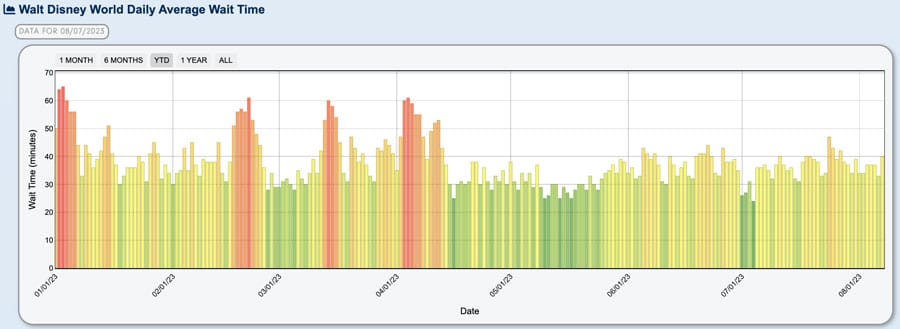
Looking at the daily data, the most interesting aspect of these wait times is the lull for July 1-4 contrasted with the spike July 24-29. Even more interesting is that the exact same thing has happened for the last two years, particularly at the end of the month.
We had thought this was an odd anomaly previously (late July 2021 was the start of the Delta wave and reinstated face mask rules), but are now thinking that it’s a “last hurrah” of the summer season. With no reason to believe that this year was abnormal, the dynamic will be incorporated into our crowd calendar updates for July 2024.
We haven’t done park by park analysis in a while, but are going to return to it for this crowd report since it’s the last update before Party Season really throws a monkey wrench into things.
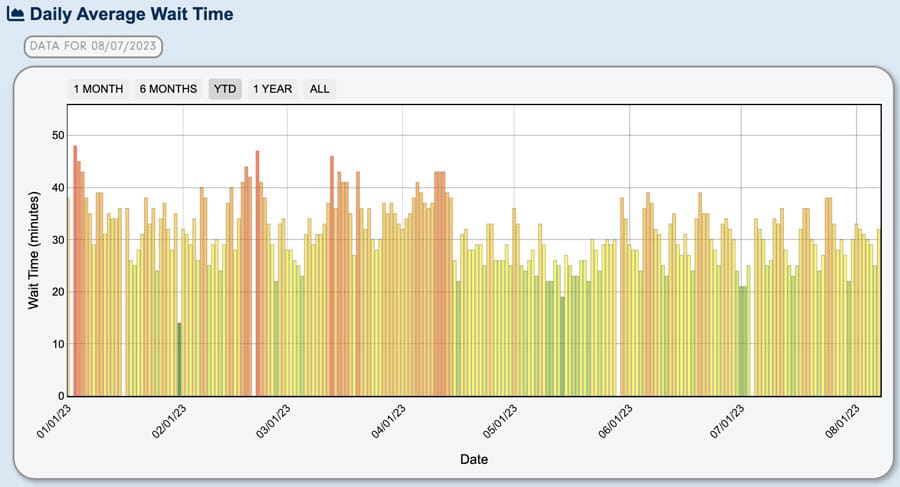
We’ll start with Magic Kingdom. The highest bars each week are almost always Mondays and Tuesdays, and sometimes Wednesday. Lowest are typically Saturdays and Sundays.
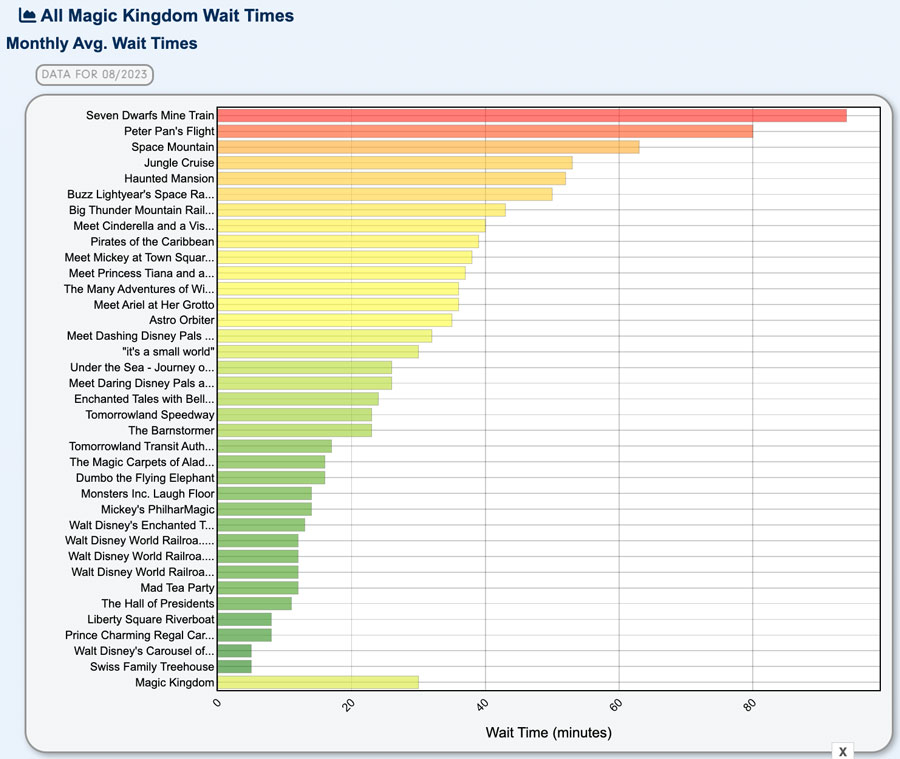
Three attractions are at or above 60 minutes, with another 5 that are at or above 40 minutes. And those are averages, meaning that the peak times are even higher.
Granted, those are also posted wait times; actual waits will almost always be two-thirds or less than that. Nevertheless, the point stands that this is what below-average crowds looks like in 2023 at Walt Disney World. Lower doesn’t mean everything is a walk-on, or even below an hour!
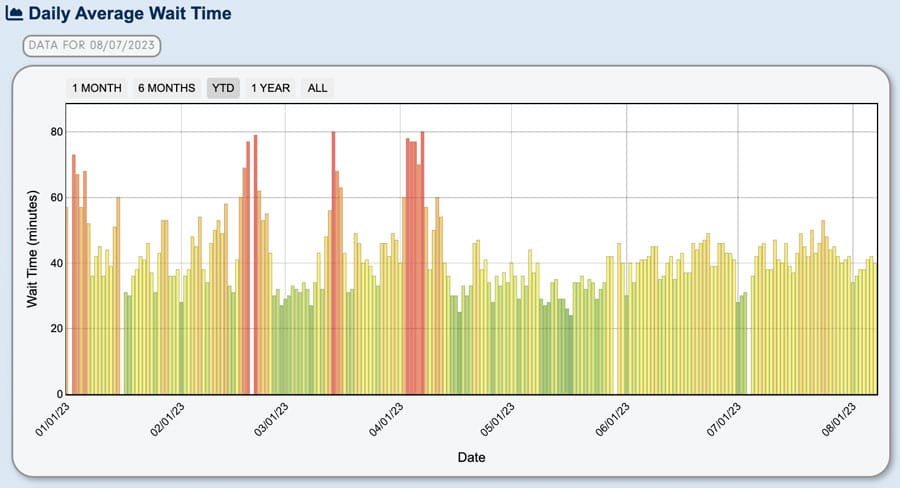
Animal Kingdom has higher wait times on average, but it also has far fewer rides than Magic Kingdom.
Except on the very worst days of the year, Animal Kingdom is far and away the park at Walt Disney World where the crowds are the most “beatable.” So long as you arrive early or late, you absolutely do not need to buy Genie+ here. In our view, it’s a waste of money. If you’re going all out and have an unlimited budget, you may disagree. To each their own, I suppose.
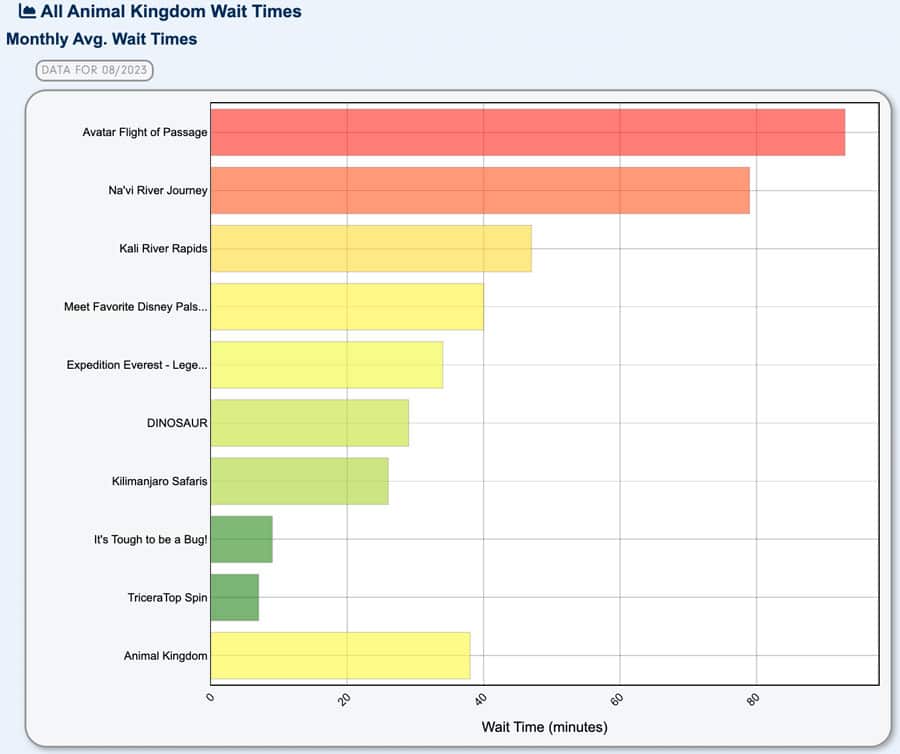
Here are the attraction averages for Animal Kingdom for the first week of August 2023:
- Avatar Flight of Passage: 93 minutes
- Na’vi River Journey: 79 minutes
- Kali River Rapids: 47 minutes
- Meet Disney Pals at Adventurers Outpost: 40 minutes
- Expedition Everest: 34 minutes
- Dinosaur: 29 minutes
- Kilimanjaro Safaris: 26 minutes
Year over year, the two Pandora attractions are actually much higher and everything else is lower. That’s especially true of Kilimanjaro Safaris, which dropped a lot.
Frankly, I don’t know how meaningful this is. I’ve queued up for Na’vi River Journey and Kilimanjaro Safaris at times in the afternoon when the posted wait time has been 60 minutes, and the rides were actually near walk-ons.
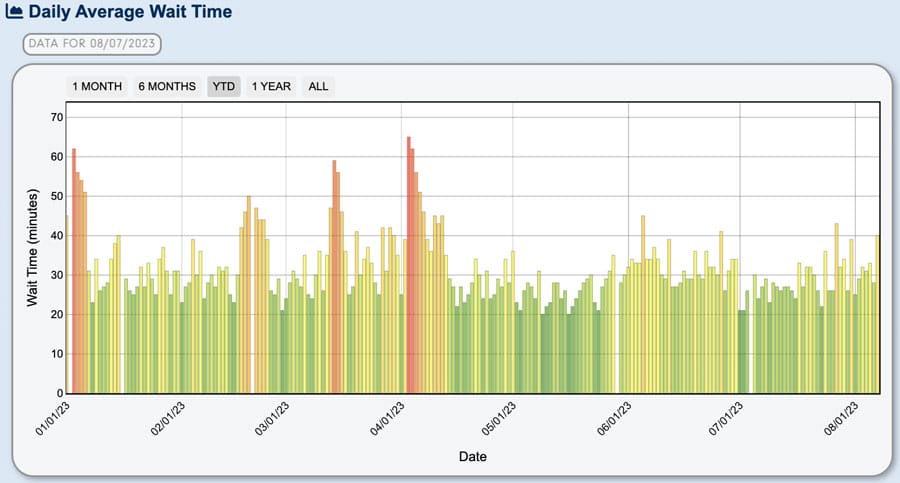
Over at EPCOT, wait times remain low.
Most of these lows are occurring Fridays through Sundays, which makes sense. EPCOT is the locals’ park, and Floridians are more likely to visit for festivals and atmosphere than rides. (If they don’t do rides, they don’t impact crowd levels–even if they do increase congestion or lines for food booths!) Locals are also more likely than tourists to cancel park plans at the last minute if the weather is bad–and it has been a hot and rainy month.
Nevertheless, crowd levels remaining low even after the start of the 2023 EPCOT Food & Wine Festival suggests that the event has not yet been a draw for non-locals (e.g. Disney Vacation Club members or other out of state regulars), as those demos would be showing up in the crowd levels.
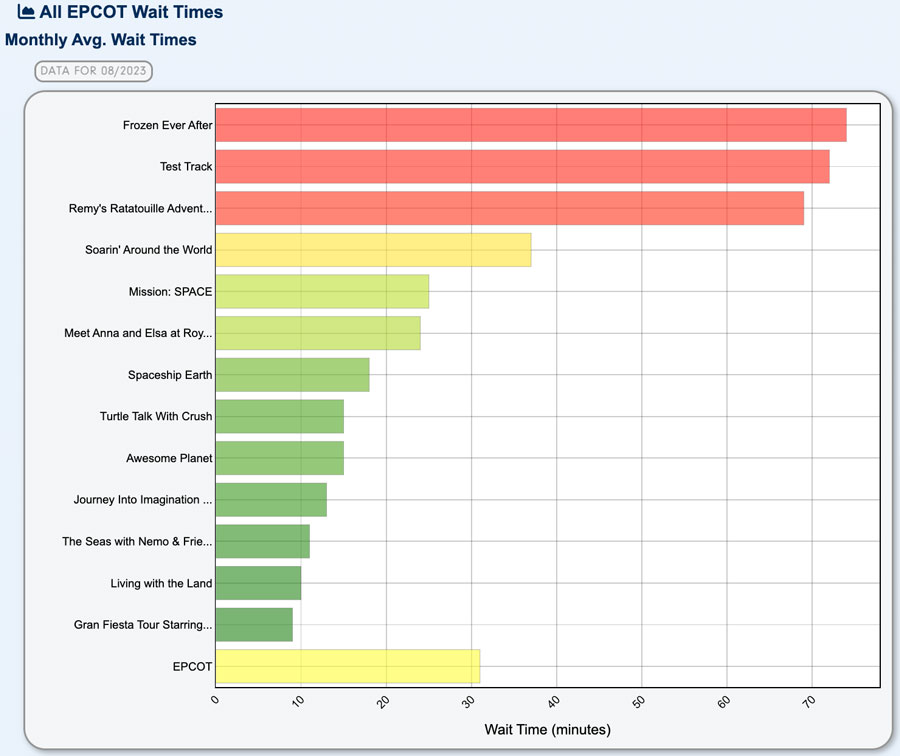
Here are individual attraction wait times at EPCOT this month:
- Remy’s Ratatouille Adventure: 74 minutes
- Test Track: 72 minutes
- Frozen Ever After: 69 minutes
- Soarin’ Around the World: 37 minutes
- Mission Space: 25 minutes
Even though the headliner trio is still high, those are all down as compared to this same time last year.
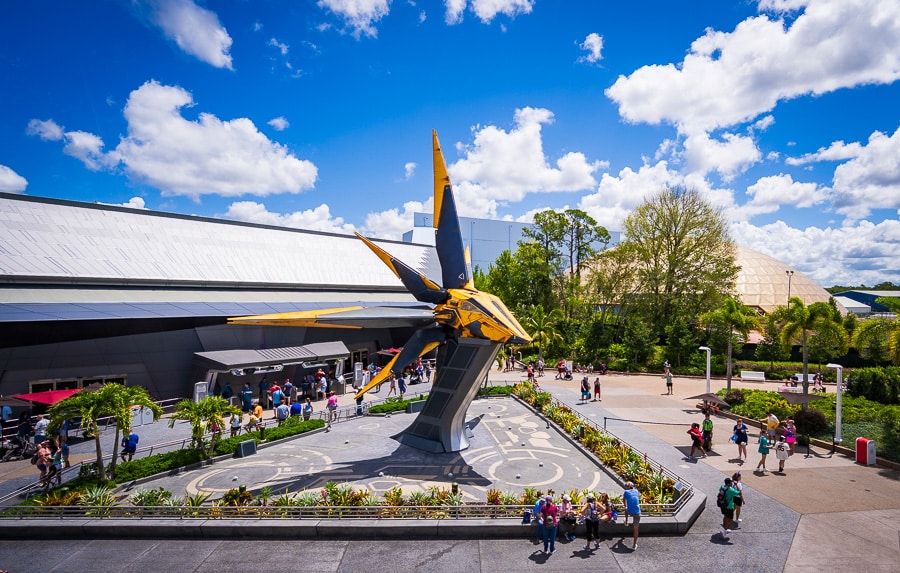
Not present in the wait time data is still, somehow Guardians of the Galaxy: Cosmic Rewind. Whenever this finally abandons the standby line and starts posting wait times, it’s going to cause an illusory spike to EPCOT crowd levels. We are expecting that to happen sometime this off-season, but we’ve been expecting it for literally over a year now. But even a broken clock is right twice a day, right?!
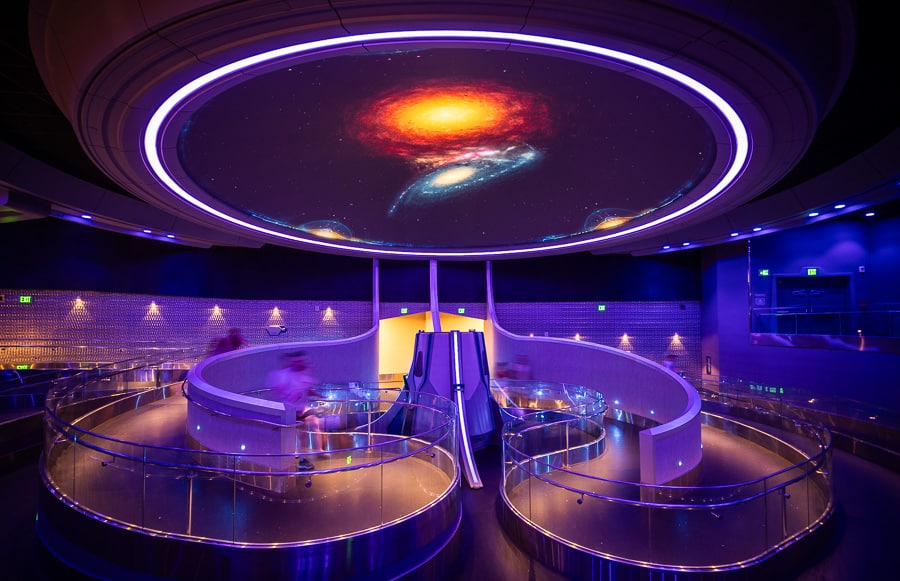
In case you missed it in our latest update on the TRON Lightcycle Run virtual queue, the return line for that (and this) is longest during the day and shortest at night. Below is a photo from my last time doing Cosmic Rewind, with an empty entrance area at 7:35 pm. A few hours earlier, the line was out the door. (My total wait was <20 minutes.)
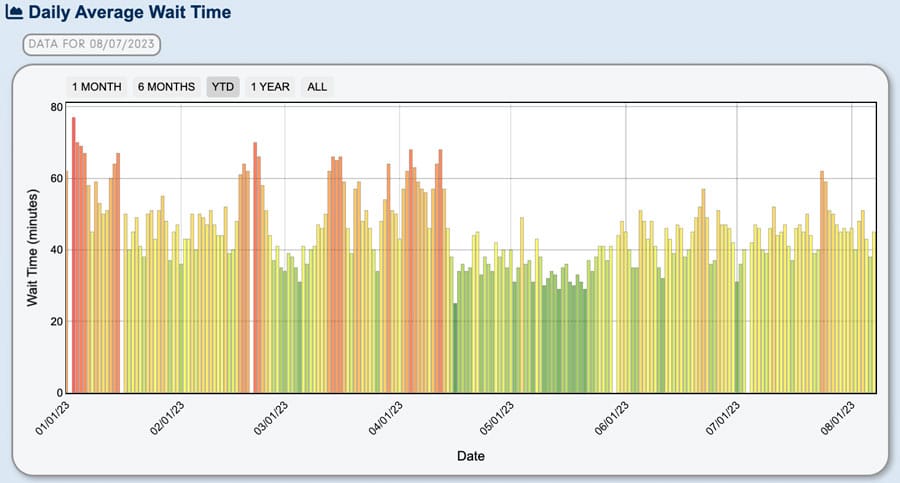
Finally, there’s Disney’s Hollywood Studios.
After a significant spike in late July, wait times have receded at DHS. As has been the case for the last several months, Disney’s Hollywood Studios is manageable if you arrive early, stay late, and avoid popular attractions during the middle of the day.
Also, hope you don’t get unlucky with multiple simultaneous rides breaking down or having the dreaded delayed opening. Even on what would otherwise be a below-average day, headliners experiencing downtime can have an outsized impact on strategy at DHS. Just check out our Tinseltown Breakdowns at Disney’s Hollywood Studios During Early Entry for glimpse at that in (in)action!
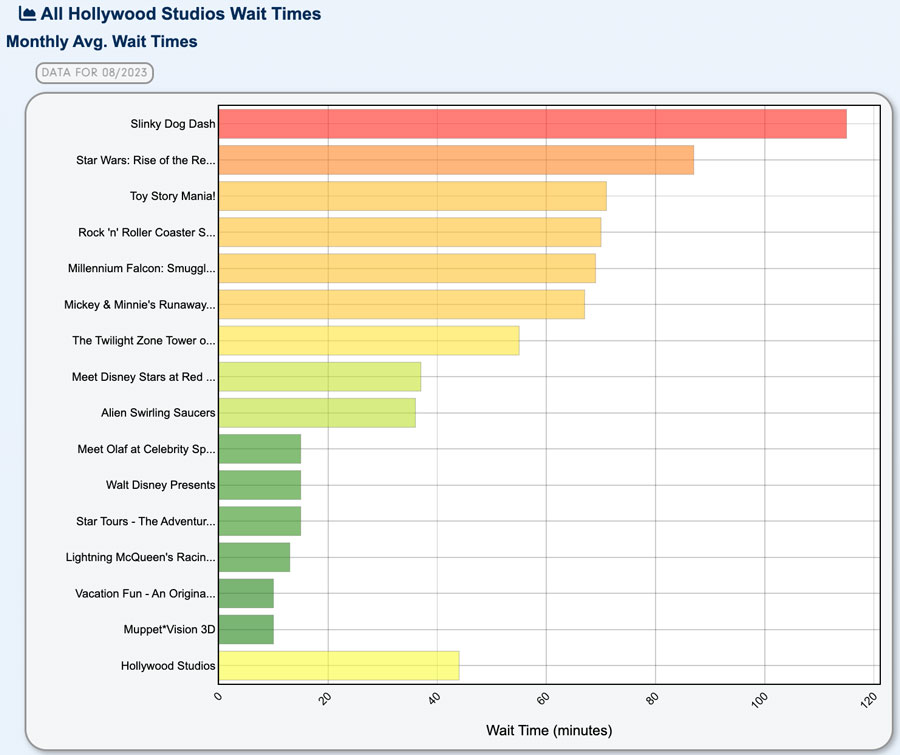
Disney’s Hollywood Studios is home to the only attraction averaging a triple-digit wait time, Slinky Dog Dash. Then there’s Rise of the Resistance, which is above 80 minutes. After that, another 4 attractions that are over an hour on average.
As with Animal Kingdom, arriving early and/or staying late is a good strategy here…unless you encounter the aforementioned breakdowns. Doing a table service meal for lunch or taking a midday break is a good way to avoid the worst of the crowds. It’s also a great candidate for purchasing the Genie+ service. Even at the higher price point, it’s much more “worth it” at DHS than DAK! (Hence the pricing.)
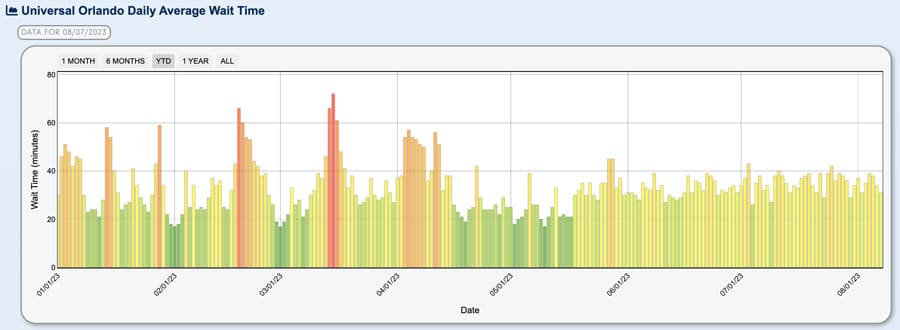
For the sake of comparison, here’s a look at the daily wait time averages for Universal Orlando thus far in 2023.
As a whole, Universal’s crowd levels have been much more consistent–and higher–this summer. Still, Universal saw a sharp drop for June and July year-over-year. Last July had 10/10 crowd levels at Universal, whereas this July was down to 6/10 with an 8 minute decrease in the average wait time.
Keep in mind that crowd levels are relative to prior periods at each park–meaning that Universal is “competing” against itself in the past, not Walt Disney World in the present. Generally speaking, Universal has posted stronger numbers in the summer the last several years, making the drop fairly consistent between the two park operators. (To the extent there are differences between the two, Disney tends to have higher numbers October through December, while Universal outperforms in the summer months.)
There have been a lot of theories for the drop in attendance, which is definitely happening. As we’ve pointed out, this does not mean that the parks are dead or ghost towns. Calling the parks any degree of “empty” is an exaggeration, to put it charitably. With that said, attendance has decreased noticeably, wait times are down, ADR availability is improving, and the company is starting to pull more of its so-called “levers” to entice locals and fans back to the parks.
As we’ve mentioned many times previously, the Walt Disney Company has conceded as much and offered explanations as to why. Dearly-departed CFO Christine McCarthy attributed it to tough comparisons when “lapping” Walt Disney World’s 50th Anniversary. Still-current Disney Parks Chairman Josh D’Amaro reiterated this, and also suggested that the exhaustion of pent-up demand was playing a role.

Last month, Bob Iger offered the best explanation of all. Since Florida reopened before most other states, it saw “revenge travel” earlier, and now it’s being exhausted sooner than elsewhere, too. Iger pointed to lower hotel occupancy tax collections in many major tourist hubs around Florida, and increased discounting at Universal and other theme parks. (For its part, Walt Disney World has offered way more–and better–deals this year than last.)
When specifically addressing the slow Independence Day holiday weekend, the former weatherman (yes, really) talked up triple-digit ‘feels like’ temperatures and 99% humidity. Summers are always varying degrees of miserable in Central Florida, so that’s unlikely to be the main explanation, but weather that’s even more miserable than normal is likely a contributing factor.

Speaking of the weather, meteorologists are forecasting this week to be the hottest of the entire year at Walt Disney World. It’s going to be a scorcher of a week in and around Orlando, as a large ridge of high pressure keeps the region under a heat dome. With plenty of humidity on top of temperatures in the mid-90s, the “feels like” reading will hit 110-115 degrees throughout this week in Central Florida. Consequently, there are already excessive heat advisories and a heat advisory for area counties.
I don’t know about you, but for me, the perfect way to usher in the start of Halloween season is…checks notes…a 95° high and 108° “feels like” temperature. That’s the forecast for August 11, which is the first Mickey’s Not So Scary Halloween Party of the year. For those wondering, my costume just became Saul Goodman in the desert during the “Bagman” episode of Better Call Saul (maybe minus the urine). Like him, I’m wondering what I’ve gotten myself into. But I digress.

Ultimately, it’ll be interesting to see what happens in the next couple of weeks with crowds at Walt Disney World. Southern school districts have already started going back into session; several major ones including Atlanta and the Gulf Coast had their first days on today. In Central Florida, both Osceola and Orange County schools go back into session on August 10, 2023.
It’s possible that this week sees a bit of a last-minute surge of Southerners, but it’s also possible that the weather keeps a lot of locals sitting on the sidelines. Regardless of how this week plays out, there should be a more pronounced drop-off over the coming weekend and next week. The following week should see an even sharper drop, heralding the unofficial start of the fall off-season at Walt Disney World.
As a general matter, it’s safe to expect crowd levels on par with this May or last August by next week. Wait times are unlikely to average the same low lows until the last week of August 2023, but average wait times should drop to the 33 to 35 minute neighborhood as of next week. That’s good enough for around 2/10 to 3/10 on the crowd calendar, which is not too shabby!
We’ll see whether the degree to which those predictions end up being accurate, or if Walt Disney World crowds and wait times throw us another curveball. We’ll continue monitoring crowds and report back in mid-August after the first couple Mickey’s Not So Scary Halloween Party nights.
Planning a Walt Disney World trip? Learn about hotels on our Walt Disney World Hotels Reviews page. For where to eat, read our Walt Disney World Restaurant Reviews. To save money on tickets or determine which type to buy, read our Tips for Saving Money on Walt Disney World Tickets post. Our What to Pack for Disney Trips post takes a unique look at clever items to take. For what to do and when to do it, our Walt Disney World Ride Guides will help. For comprehensive advice, the best place to start is our Walt Disney World Trip Planning Guide for everything you need to know!
YOUR THOUGHTS
Thoughts on late summer crowds at Walt Disney World? Predictions for the rest of August 2023 or fall off-season? If you’ve visited within the last month or so, what did you think of crowds? What about posted v. actual wait times? Any parks, days of the week, or times of day noticeably worse than others? Do you agree or disagree with anything in our report? Any questions we can help you answer? Hearing your feedback–even when you disagree with us–is both interesting to us and helpful to other readers, so please share your thoughts below in the comments!


Whilst I don’t doubt the data in wait times (apart from inaccuracies you mention) looking at published park attendance in conjunction with UK airline PAX data and that of ‘on the ground reports’ I would disagree WDW is entering it quiet period. More UK and EU travellers have and are to travel to WDW in the next few weeks (last week’s of kids school summer holiday) as total route load factors and bookings have seen a +22% increase on 2019 figures. Whilst I fully appreciate not all PAX will be attending WDW there still is a large majority who will.
I agree with several comments though about guest satisfaction as many reports of ‘wall to wall’ guests and longer than advertised wait times have negatively affected demand for 2024 UK/EU season with bookings down – could be also due to rising inflation.
The quiet before the storm perhaps?
The problem is that UK travel into Orlando is small as a percentage of total passengers. In August 2019, international travel from all countries outside the US (not just the UK) into Orlando was only about 15% of all flights. Even if *all* international travel increased 22%, a 5% decrease or more domestic travel will wipe that out and there will be a net decrease of travelers into Orlando.
Aaron hit the nail on the head. Not only that, but there’s a whole new terminal at MCO that has expanded international capacity greatly.
I’d also point to Iger’s comments on today’s earnings call, which suggest that international visitor numbers are down at WDW.
Tom, would the subtraction of Splash Mountain a typical 60+ minute wait from 2022 to 2023 scew the data? especially with Tron’s virtual queue sucking up some of those people?
hello
Leaving for WDW tomorrow. 115 degrees, rain, tornados, why wasn’t my wife born in May or even early February?
This year for MNSSHP I’m going as Bruno but I’ll be Walter White underneath my sheet.
We were in Disney recently and the wait times listed were mostly inaccurate. Only about 10 percent of the time were accurate. A 90 min wait time for Toy Story was only 30 mins. Many times it was half the amount of time listed. It was annoying because you couldn’t rely on the wait times.
Would you say that the few accurate wait times were midday? That’s what I found about a year ago (MF and Tea Party, so pretty random!), but I want to know what others are experiencing now. Like Tom, I found that most wait times were inflated, and at the end of the day most wait times were even more inflated.
Interesting reading Tom. Just back from 2 weeks (3 nights at UOR 11 at OKW – DVC rental thank you for the tips. Brilliant service from Dave’s). We were there 14-28th July. Universal was manageable. Stayed offsite 2 nights and did 1 at LRP for the beds and the Express Passes. Doddle. Disney was a totally different experience. Rammed everywhere all day. Every day. The 4 sets of Deluxe hours we had (I planned the entire vacation days around these) total washout. Wall to wall people and queues. The 2nd week Disney moved the MK one to 1am and while slightly better SDMT was 65 minutes all night even at 1259 end it only dropped to an actual wait of 35 minutes. The crowds were highest we have ever seen by a mile – 2019 was our last visit. G+/LL meant we had to rethink our days. So we are now late starters and stackers. G+ has changed how we navigate. I am not sure we’ll go back. Not so much because of the price but as you can no longer use it to re-ride your faves you are just stuck in long queues all day and I am not sure that makes it worth the cost. Yes i get the “there are other things to do” argument. But other resorts elsewhere have more and better for far less. So we have to price it, knowing what we know and see if it adds up. But i cannot see it at the moment. It was a nice trip but an extremely expensive one. Hope Sarah and Baby (please stop calling it Megatron or whatever) are doing well.
You write that “the unofficial start of the fall off-season,” coming in a couple of weeks, should result in “average wait times in the 33 to 35 minute neighborhood…about on par with the lows of this May and the highs of last August.” Do you mean the LOWS of last August? Or are you expecting crowds to be worse this August than last?
That was a clumsy way of putting it on my part, but the lows of last August didn’t happen until the very end of the month. So wait times in that range would be on par with the highs of last August (which are still pretty low) rather than the lows of the month (which were REALLY low).
I’m not expecting this August to be any busier–if anything, it’ll likely be slower earlier. But I wouldn’t bet on the lows being lower than last year, simply because those lows were REALLY LOW. I wouldn’t bet against it, either, though.
…I’ll try to reword that in the post so it’s clearer.
Thanks Tom! I appreciate the clarification.
TOTALLY DISAGREE
We have been in Disney World for the last seven days and the crowds have been wall to wall!! Very crowded!! We come every year for the last 38 years and the crowds grow every year(except Covid years)! This year is very crowded!!
From the post: “Walt Disney World attendance has increased by several million people over the course of the last decade-plus. As a result, the vast majority of days in 2023 will be more crowded than their counterparts in 2015 or 2017. Same goes for comparing this year to 2020-2021. Really, the only worthwhile historical comparisons right now are 2023 vs. 2022 or 2019. The good news is that’s what’s measured here: how current crowds in 2023 compare to dates in the last year.”
Or are you saying you disagree with the wait times data here?
Do you know if the attendance cap for Halloween is lower in August than in October? There is a debate if they add more people when they add the extra show later in the season.
I don’t know for sure, but I fall on the side of the capacity cap being higher for MNSSHP in October.
That’s been our anecdotal experience with Aug/Sept vs. Oct crowds, and also, it stands to reason that they wouldn’t just add a showtime out of generosity–it’d be to increase the theoretical capacity of the event.
I’m heading down in two weeks and looking forward to this! I haven’t done summer at Disney World since 2020, and while this won’t be nearly as good wait-time-wise, it should be a lot of fun for a water-based vacation.
Just left after a week-long trip. Anyone that says parks are empty are crazy. But the crowds were manageable. Some evidence of last hurrah, we spoke to multiple Florida families in lines that said this was a last visit before school. So that effect might be a real thing.