
Winter Crowd “Slowdown” at Disney World
Winter is no longer the sleepy off-season it once was at Walt Disney World, but wait times have dropped–in some cases, quite dramatically–from their holiday highs. This crowd report shares recent data, thoughts on what’s likely to happen next with attendance levels between now and Spring Break, and which dates will end up being the busiest.
As has been the case since 2018, winter is really a ‘tale of two seasons’ at Walt Disney World. There are peaks and valleys, with really high highs and relatively low lows. Obviously, Christmas and New Year’s Eve are peak weeks–everyone knows that. But it’s not simply slow between then and Spring Break, and hasn’t been for several years.
This year, the holiday highs continued until Central Florida school districts went back into session and the Walt Disney World Marathon ended. This was also predictable, and most fans know that week-plus has gotten bad. However, it was unprecedentedly crowded this year. So, how have crowds been since then? Let’s take a look…
As always, what’s covered in these “crowd” reports is actually posted wait time data that’s pulled from My Disney Experience and compiled into graphs for tracking and comparing various days, weeks, months, and years. A lot can be gleaned from posted wait times, but it’s not necessarily conclusive of in-park congestion or crowds.
There are several other variables that can impact “feels like” crowds, from festivals at EPCOT to weather to guest demographics to ride breakdowns to operational efficiency to time of day or day of the week. And that’s just a partial list! Beyond that, wait times can be manipulated by Walt Disney World. They’re often inflated, or otherwise inaccurate.
In short, wait times are an imperfect measure of Walt Disney World’s raw attendance or crowds–which have increased by several million people over the course of the last decade-plus. With that out of the way, let’s dig into the data and look at Walt Disney World wait times. As always, all graphs and stats are courtesy of Thrill-Data.com:
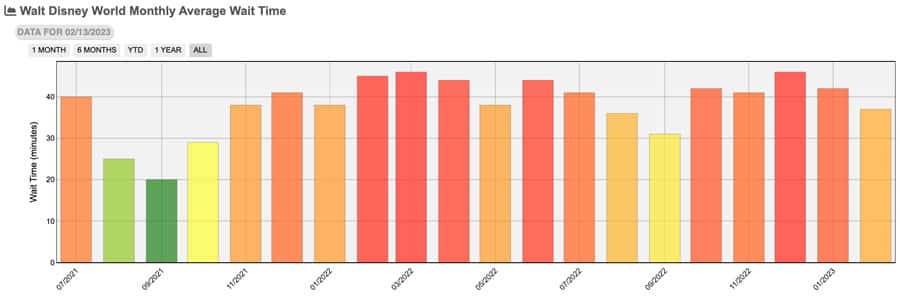
We’ll start with the monthly numbers for Walt Disney World as a whole.
This is most interesting if you compare this January and February to the same months last year. Notice January was much busier this year and February, thus far, is much less busy? Before drawing any premature conclusions, take a look at the next graph…
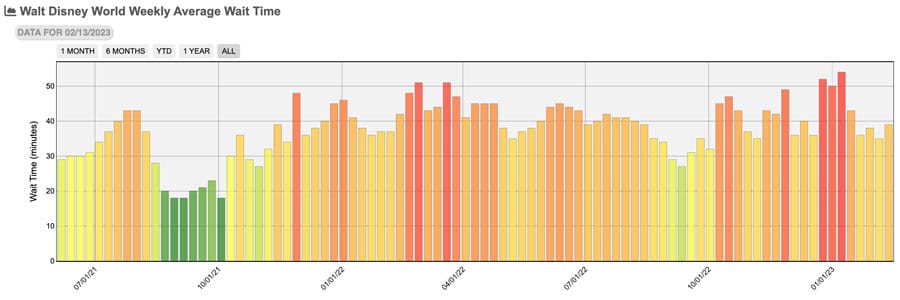
If we break this down by week, the differences should be easier to spot. When it comes to this January, the post-NYE winter break crowds were off the charts (well, not literally). By contrast, that first week of January was trending downward as compared to the holidays last year.
As for February, the key difference there is that Presidents’ Day has not yet happened this year. That was the big spike last year, and skewed crowd levels upwards for the entire month. Otherwise, it would’ve been a relatively moderate winter. Just like this year.
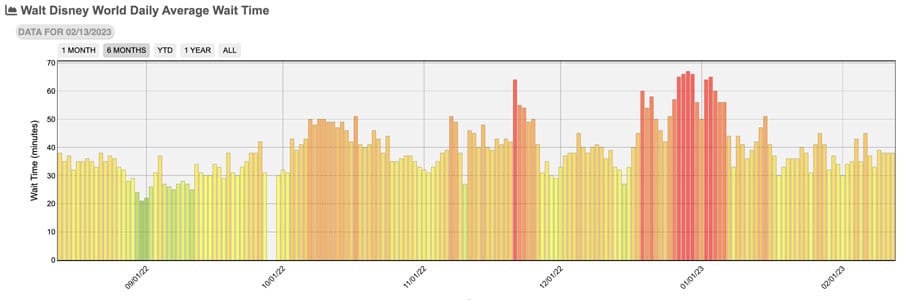
Above is a look at the daily numbers over the course of the last 6 months.
This illustrates the degree of the “slowdown,” which is on par with the early December lull. Still not nearly as good as the lows of last September, though. Slowdown receives air quotes because wait times are only slightly below average, and there’s a good chance those visiting this time of year were anticipating even lower numbers.
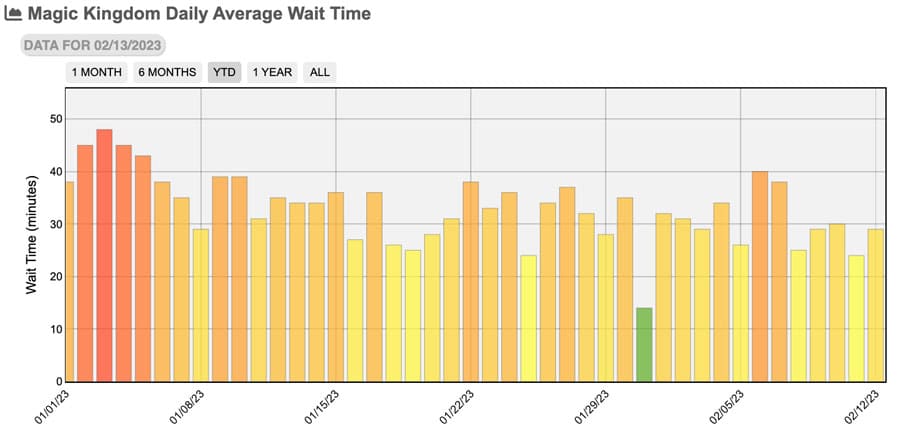
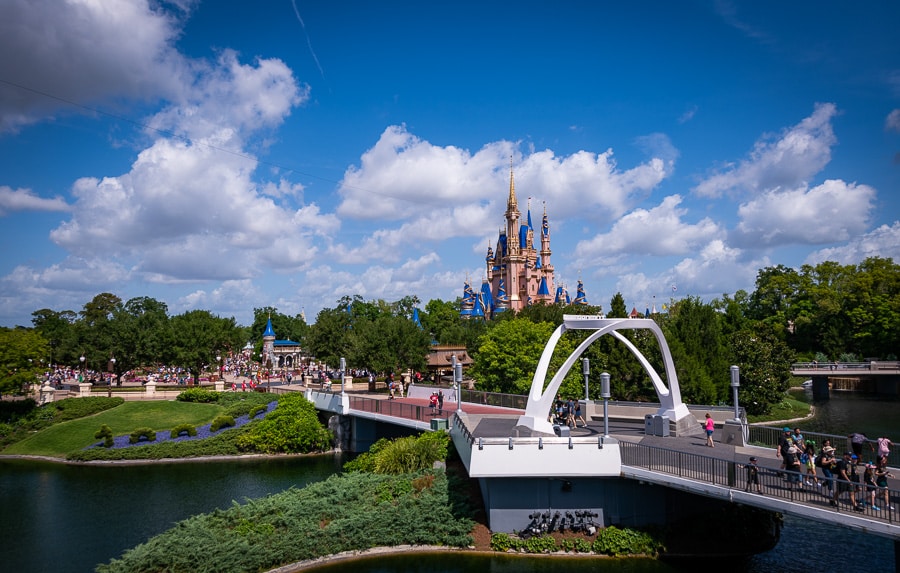
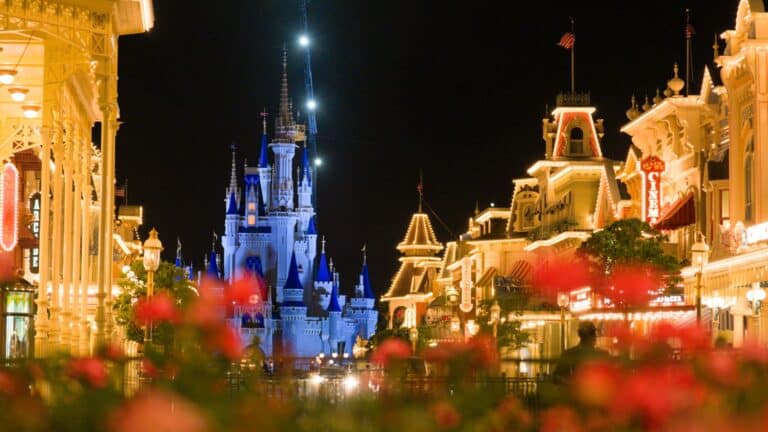
We’ll start the park-by-park data with Magic Kingdom, where crowd levels have normalized this year after several consecutive months of Mickey’s Not So Scary Halloween Party and Mickey’s Very Merry Christmas Party dates.
January 31 is the anomaly, registering a 14 minute average wait time. Whether that was due to a spontaneous grassroots boycott or the 4:30 pm park closing time that day is anyone’s guess. One thing worth pointing out here is that the days before and after had 30+ minute average waits. As we’ve said time and time again, you come out ahead with the shorter hours by virtue of the time saved (not) waiting in line. Counterintuitive as it might sound, take the shorter hours!
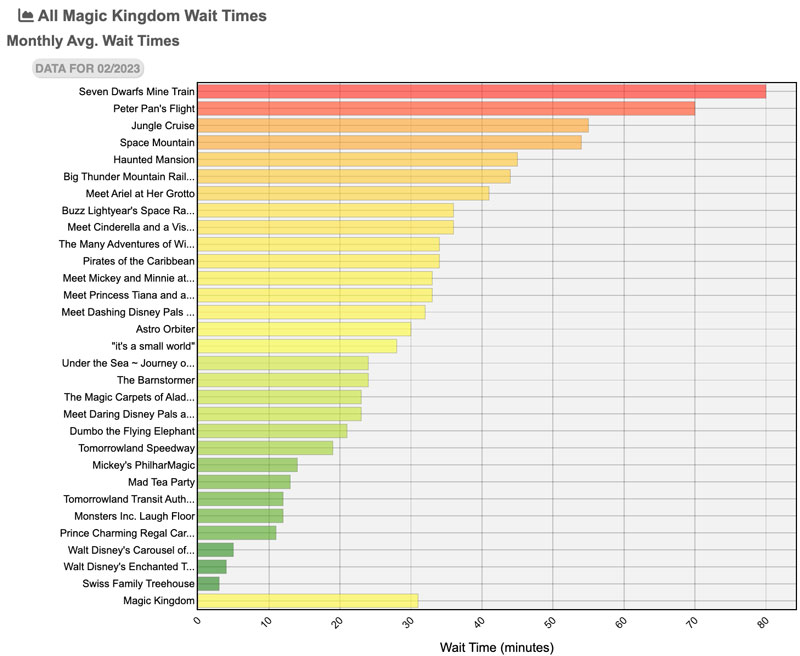
Above are attraction wait times for the month to date at Magic Kingdom.
Really not many surprises here. The one wildcard was Big Thunder Mountain Railroad, and whether it’d spike or fall with the closure of Splash Mountain. In actuality, it has not materially changed. Jungle Cruise is finally returning to reality, at least for now. Lots of meet & greets on this list again, which is nice to see. Even if you don’t do them, they add capacity and help absorb crowds–especially important when a headliner is down for almost 2 years and the next new ride has not yet officially opened.
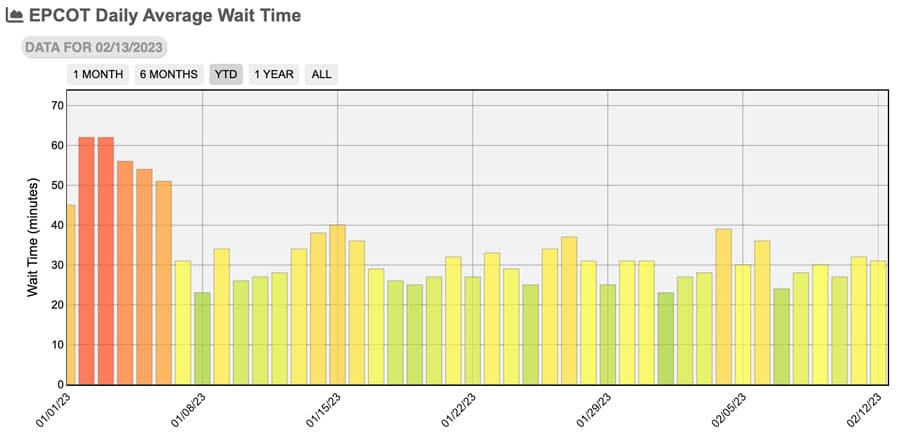
Continuing to EPCOT, where crowd levels have fallen back to earth after their stratospheric highs over the holiday season. Lots of 3/10 days, but also a scattering of 6/10 and above ones in there, too.
The big thing this illustrates is just how differently tourists and locals “do” EPCOT. Attendance is not low at EPCOT right now–far from it. In fact, the “feels like” crowds are particularly bad at times, owing to the ever-increasing popularity of the EPCOT International Festival of the Arts.
However, nothing at EPCOT’s Festival of the Arts has a posted wait time, and that’s what the above graph measures. Meaning that locals showing up, wandering around, grazing the food booths, enjoying art and entertainment, but NOT doing a single attraction contribute to crowds but not to crowd levels. Paradoxically, these people are probably worse for crowdedness, as they’re pretty much always in walkways and not in standby lines. Call it the “EPCOT Effect” or whatever, but it’s noticeable at this park more than any of the others.
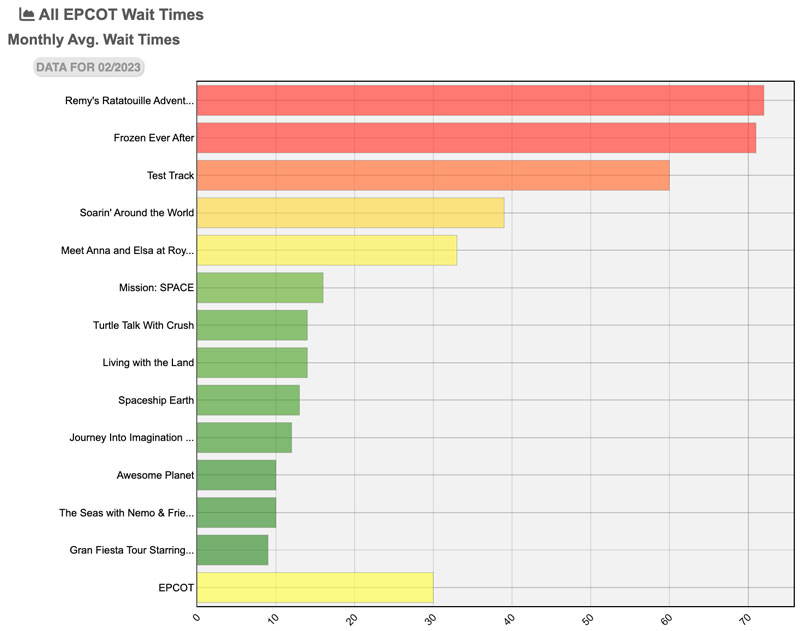
When looking at attraction wait times, there are no surprises at EPCOT, either.
The top trio of Remy’s Ratatouille Adventure, Frozen Ever After, and Test Track are all at or above an hour, but everything else has been mostly manageable. Give this a few more days and Soarin’ Around the World and Mission: Space will join the list of hour-plus average wait times.
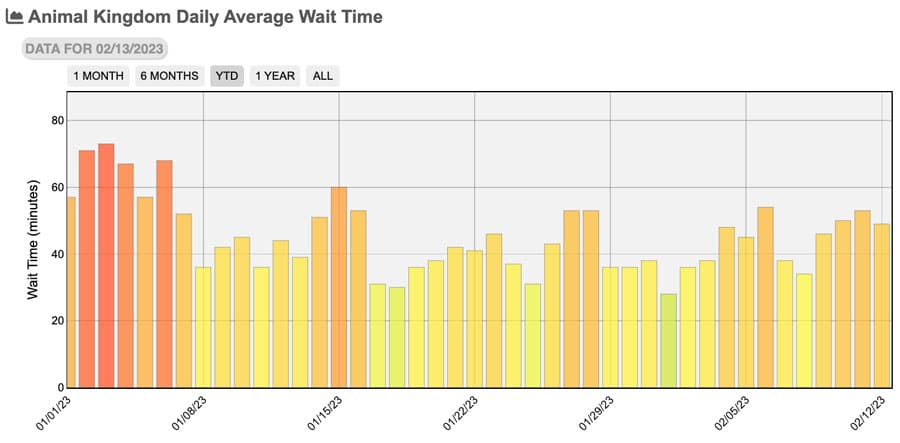
Animal Kingdom is also coming off its holiday highs, with more manageable wait times in the last month-plus. The Martin Luther King Jr. Day holiday weekend was also busy, but not nearly as bad as Christmas break.
After a quieter couple of weeks, wait times appear to be trending up again. The last several days have been in the 8/10 range, which is interesting and a bit surprising. These numbers will get worse, but that shouldn’t happen until the end of this week and the weekend.
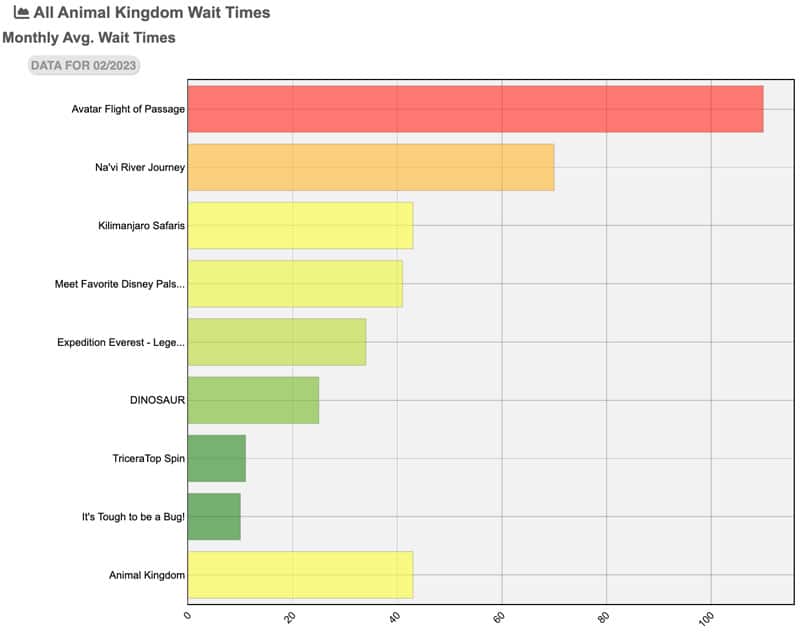
As with the other parks, individual ride wait times are almost exactly what we’d expect.
Avatar Flight of Passage is almost off the chart, followed not-so-closely by Na’vi River Journey and Kilimanjaro Safaris. As always, this is the park where it’s easiest to beat the crowds if you simply arrive early or stay late. Just don’t do what everyone else does, which is roll up late, do rides during the middle of the day when wait times are at their absolute worst, before bouncing early.
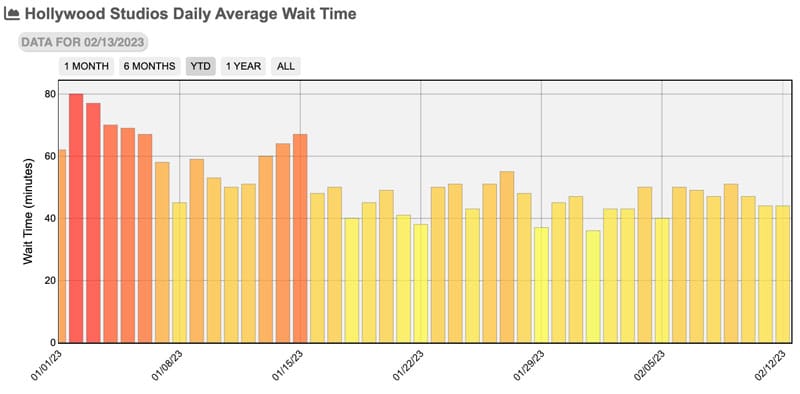
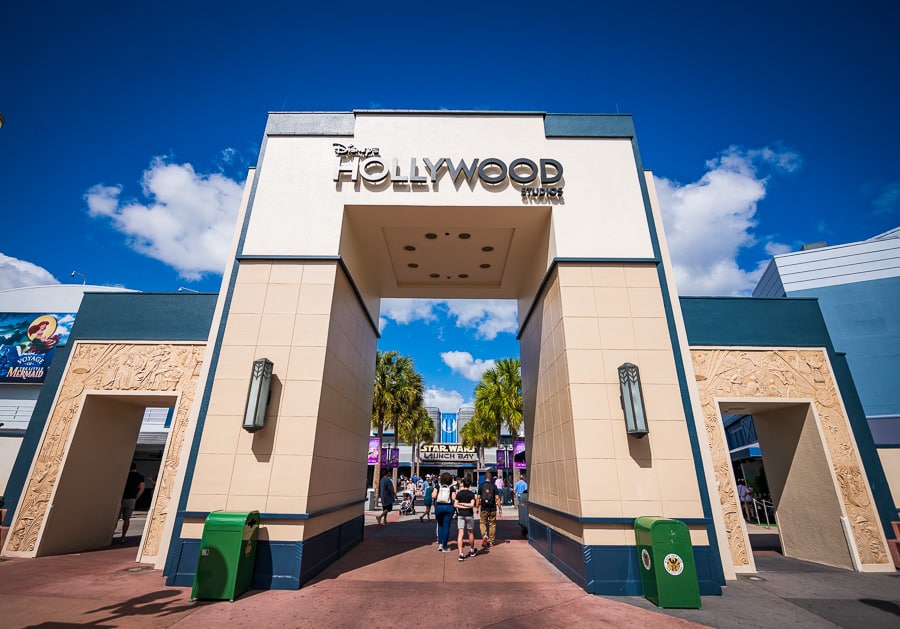
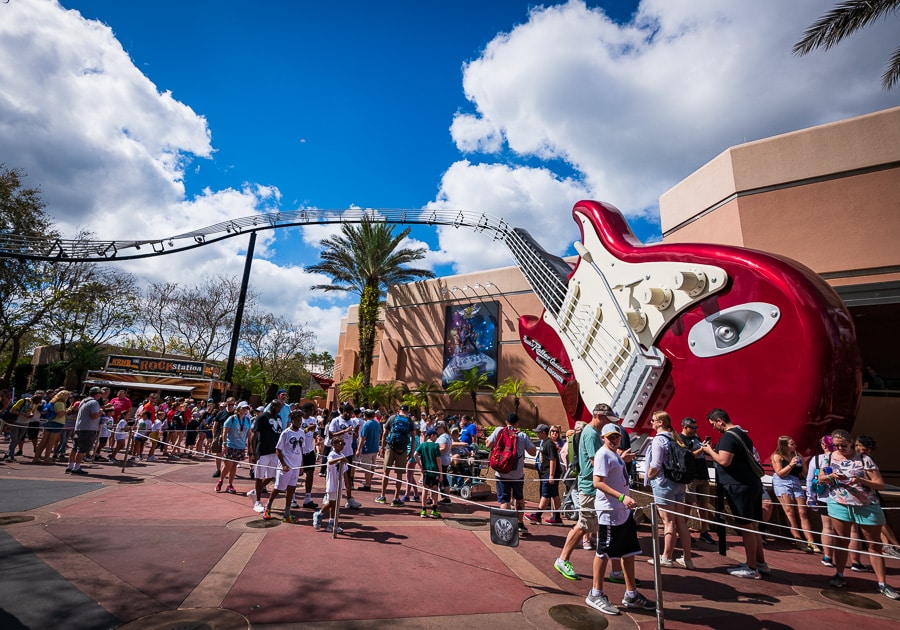
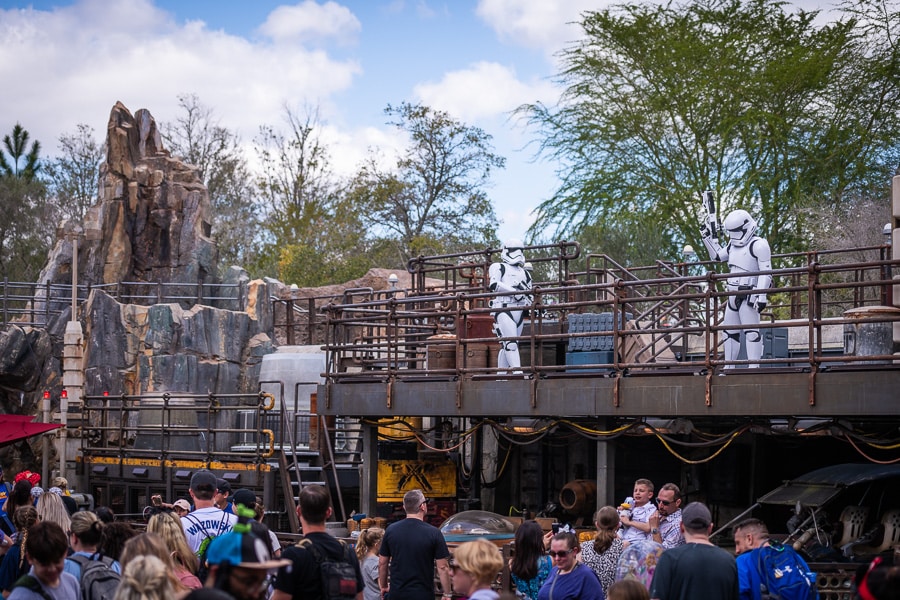
Finally, there’s Disney’s Hollywood Studios. This is a pretty similar story to Animal Kingdom, albeit with a more pronounced spike for MLK Day weekend. As with DAK, crowds also have increased and held steady for the last week at DHS.
During that time, average wait times have ranged from 44 to 50 minutes. I wouldn’t expect averages to fall back below 40 minutes until early May. In the next week, averages will likely spike to over 60 minutes again, if not worse.
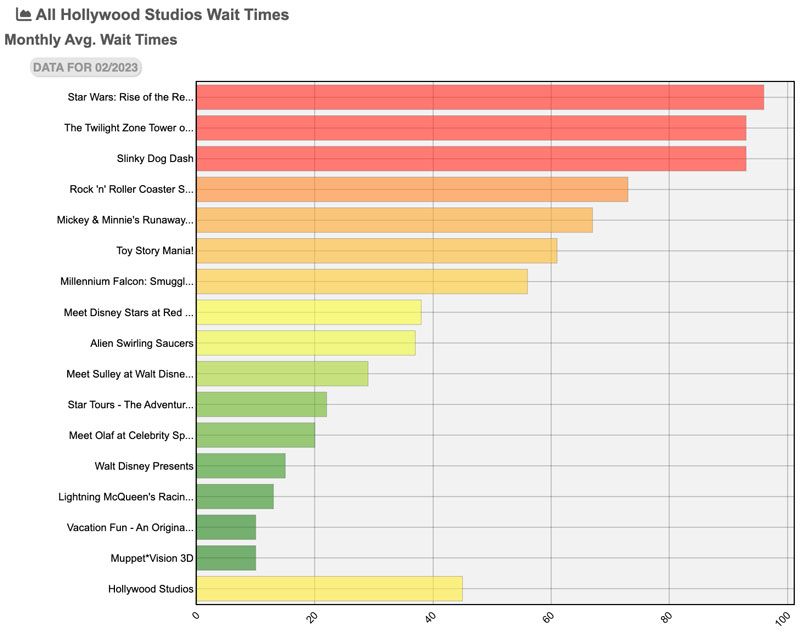
Disney’s Hollywood Studios is where the individual attraction wait times are the worst and the averages on the prior daily graph are arguably deceptive. This is because several shows skew the average down thanks to ~10 minute posted wait times. Meanwhile, there are more headliners with 60+ minute waits than any other park.
Speaking of which, Tower of Terror remains high on the list due to one of the elevator shafts being out of service (again). Expect that to change this week, as it’s back to full capacity ahead of the busy break season. Star Wars: Rise of the Resistance and Slinky Dog Dash will both surpass it, and it’s possible that a couple other attractions will, too.
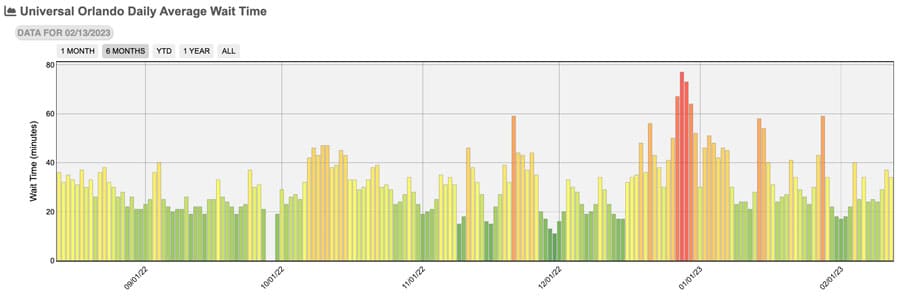
Finally, let’s take a look at how all of this compares to Universal Orlando.
The most striking thing to me about this graph is the degree to which Universal’s parks follow seasonal attendance trends and tourism data. Conventional wisdom is that Universal has gained market share among Floridians as they’ve catered to locals more aggressively and actually sell Annual Passes. This has been the dominant narrative and, frankly, one I bought and advanced in the year following the reopening.
However, the wait time data and trends starting at the beginning of last year no longer support that position. This isn’t to say Universal Orlando is underperforming or anything of the sort, but if you’re expecting Universal to overtake Disney, you might want to adjust your expectations. That is, unless you’re using a Yogi Berra-ism to explain Disney’s downfall: “Nobody goes there anymore. It’s too crowded.”
Aside from that, not a particularly interesting or illuminating wait times and crowd report. Aside from the Martin Luther King Jr. Day holiday weekend, things have been pretty uneventful since school went back into session in the second week of January. The last several weeks have mostly been in the slightly below to slightly above average range–meaning pretty moderate crowds across the board.
This has been almost exactly on par with last year. In fact, the average weekly wait times are within a few minutes of last year’s numbers. Again, that likely slightly understates the ‘feels like’ crowd levels, especially at EPCOT. Nevertheless, that is also consistent from year to year, as winter is a time that draws locals to the parks.
This is good news and a ‘nature is healing’ report from the perspective of crowd calendars. After a couple years of unpredictability (or at least less predictability) due to cancellations, reservations, pent-up demand, and other abnormalities, this winter has settled into a very predictable pattern. It’s bad news from the perspective of crowd reports, as there’s very little that’s truly interesting here. (I’ve been putting off writing one of these for the last several weeks because I figured it’d be a dull one based on the data, but figured I should do it before the craziness kicks off…)
Speaking of which, it’s pretty safe to predict that this coming week will be busier than last week. Another not-so-bold prediction is that the upcoming weekend will be busier than the weekend that just concluded…and that the week following that will be really bad, too. As a reminder, this is the confluence of Presidents’ Day, Mardi Gras, Princess Half Marathon, and a couple youth sporting events at ESPN Wide World of Sports.
We recently highlighted just how bad this will be in the Worst Week of Winter is Coming at Walt Disney World. Suffice to say, this will be the busiest week of the first quarter and could be one of the 5 worst weeks of 2023–right up there with Thanksgiving, Christmas, New Year’s, and the peak of spring break.
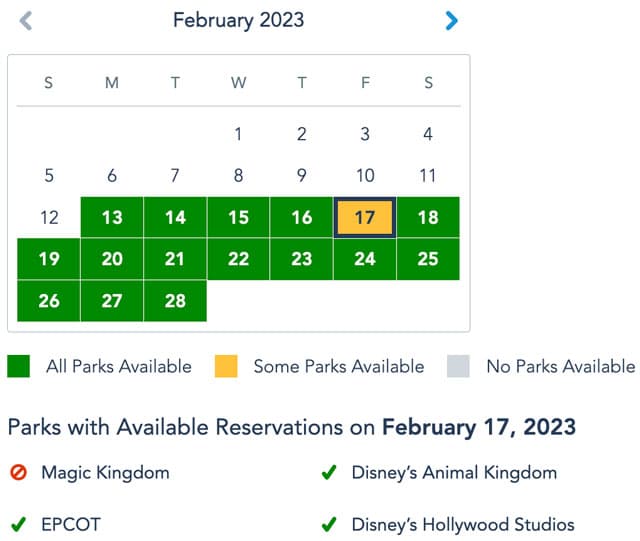
With that said, I am surprised by the Disney Park Pass situation. Currently, the only yellow day is this coming Friday, with only Magic Kingdom being unavailable. I thought for sure more of those days would fill up at MK and DHS by now, if not due to organic demand, as a result of Disney’s desire to redistribute attendance.
That’s one positive that we’ve seen over the last couple months–Walt Disney World has not been utilizing Park Pass to normalize attendance across all 4 parks. This is something we observed even last August and September, when crowd levels were at their lowest. I’m curious what prompted the change. Could be staffing, guest satisfaction, or lost business as a result of trying to “force” people to visit certain parks. Perhaps a combination of the above.
Regardless, this trend should put us one step closer to Walt Disney World retiring reservations for everyone except APs, or perhaps for all dates except peak holiday weeks. If next week stays green–or even yellow–the Park Pass system arguably has served its purpose and is no longer needed for all guests or dates.
Nevertheless, our prediction is that the average wait time exceeds 50 minutes next week, and probably ends up around 52-55 minutes. That would put the overall crowd level at 10/10, and on the higher side of that. To put that into perspective, last week average 39 minutes, which exactly average–5/10 on the crowd calendar.
A difference of +11 minutes may not seem like much, but it’s huge over the course of the entire day. (Those extra minutes also disproportionately impact popular attractions, since shows often don’t increase at all.) For the average guest, that amounts to an extra couple of hours spent standing in lines per day or, more likely, fewer high-profile attractions accomplished.
More so than normal, we highly recommend beating the crowds as best as possible by utilizing Genie+ and Lightning Lanes, Early Entry, Extended Evening Hours, rope drop, etc. We cover the best & worst approach for each park in Best Time-Saving Strategies for Walt Disney World. If you’re only going to read one planning post, make it that. There are great ways to beat the crowds–even on busy days–without buying Genie+ or Individual Lightning Lanes.
Ultimately, we are expecting this week to become increasingly busy, but still nothing as compared to the upcoming weekend and week that follows. It’s really not a matter of “if” it’s crowded, but rather, how high the wait times get. Will this surpass winter break as the busiest week of 2023 so far? Will it end up being worse than the peak of spring break? One of the 5 worst weeks of the year?
As a reminder, Presidents’ Day week last year ended up being tied, wait time-wise, with Orange County’s Spring Break. Those weeks were not dethroned as the busiest of the year until Christmas and New Year’s (even Thanksgiving wasn’t as bad). That was without Presidents’ Day coinciding with Mardi Gras, suggesting that this year could be even worse. Whether it ends up being the busiest of the year remains to be seen, but we’re guessing it ends up being in the top 5.
Planning a Walt Disney World trip? Learn about hotels on our Walt Disney World Hotels Reviews page. For where to eat, read our Walt Disney World Restaurant Reviews. To save money on tickets or determine which type to buy, read our Tips for Saving Money on Walt Disney World Tickets post. Our What to Pack for Disney Trips post takes a unique look at clever items to take. For what to do and when to do it, our Walt Disney World Ride Guides will help. For comprehensive advice, the best place to start is our Walt Disney World Trip Planning Guide for everything you need to know!
YOUR THOUGHTS
Predictions on crowds for the rest of February 2023 and Spring Break? If you’ve visited this winter season, what was your perception of “feels like” crowds? Do you think it’s been a return to the off-season of years past, or virtually indistinguishable from busier holiday timeframes? Thoughts on our predictions? Agree or disagree with anything here? If you’ve visited in prior months during the last year, how did crowds compare between then and now? What did you think of the wait times? Any parks or times of day noticeably worse than the others? Do you agree or disagree with anything in our report? Any questions we can help you answer? Hearing your feedback–even when you disagree with us–is both interesting to us and helpful to other readers, so please share your thoughts below in the comments!


Hi Tom:
I used this blog a lot to help me plan for my family’s vacation. Thank you so much!
We were there from Feb. 7-Feb. 10 and didn’t have issues with crowds but we did use Genie+ and had the DAS pass. We went to the Magic Kingdom that Wednesday and Hollywood Studios on Thursday. It was my son’s first time and everything went smoothly. He’s autistic so we got the DAS pass, which enabled us to make line reservations at two rides during our conference call to set the pass. That plus Genie+ and paying the additional cost for Ride of the Resistance enabled us to hit all the rides and shows we wanted to with what I thought was very minimal wait times (ranging from walk-on and to maybe 15 minutes). Ride of the Resistance was a 75 minute wait in the regular line at 6:30 PM. Caveat: We didn’t go on roller coasters or Tower of Terror.
Pirates was only a 5 minute posted wait time (wasn’t even that long) so we rode that a couple times. We didn’t use a Genie reservation for the noon fantasy parade viewing spot, but we sat on the brick wall around the Walt and Mickey statue and had a great view.
Plus we used mobile meal ordering to cut down on wait time even more.
Thanks again for helping to make my son’s first vacation at DisneyWorld a magical one. Although the first night back home in Michigan he said he wanted to run away to Jambo House 😉
“Although the first night back home in Michigan he said he wanted to run away to Jambo House”
If it makes you feel any better, I tell my parents the exact same thing whenever I go back home to visit them in Michigan. 😉
Seriously, though, glad to hear your trip went well and thanks for sharing your experience!
maybe the crowds sku differently as its more adults now attending – so we all head to the same rides, rather than spread over all the whole park including the more junior rides (i mean i rode Runaway mine train but wouldn’t bother with barnstomer or alien cups)
Any thoughts on first full week of March (6-10) versus the last full week (27-31)? Crowd calendars I’ve seen estimate the first week at more like 5 or 6 and the last week at 8 or 9, but I’m wondering if Easter being a little later this year could change that and make the last full week a sort of calm between the storms of Mardi Gras and Easter.
Hi Tom.
We are active seniors in Florida for a break from the northeast cold. Have been here since January 30th between Disney and Universal. Crowds at Disney were absolutely ridiculous at Epcot and Animal Kingdom. We stay on site, deluxe, and have annual passes. We managed to get on the rides we wanted without using Genie but this involved several visits to each park over several days. At universal now…. Cannot beat the express passes that come with our hotel.
Enjoying the beautiful weather for sure!
We were there last week (Sun-Wed) and it felt very crowded. People just everywhere and wait times seemed long. We used Genie plus at Magic Kingdom and Hollywood Studios and it helped some but was not as great an experience as we had in early Nov at Disneyland. We were hoping it would be quieter but I guess that doesn’t happen much anymore! We were happy to find out that now if you are staying at a resort that you can park for free in the parks so that was a nice plus. Still had a great time but it was very busy.
“Conventional wisdom is that Universal has gained market share among Floridians as they’ve catered to locals more aggressively and actually sell Annual Passes. This has been the dominant narrative and, frankly, one I bought and advanced in the year following the reopening. However, the wait time data and trends starting at the beginning of last year no longer support that position.”
Tom, you were right to note that Universal came back faster in 2021 than WDW did. Both Universal parks had higher attendance than all Disney parks other than the MK. Now that we have full 2022 data we can clearly see that it was a temporary trend and see what was wrong with our assumptions. I believe that Universal was able to market to locals more aggressively because while the Velociraptor was big for them, WDW didn’t market any major new attractions until fall 2021 when Remy’s Rat Ride opened. Since then, Disney has been able to market new openings of Cosmic Rewind in 2022 and Tron this year, which has pushed Universal back into second place (or 5th and 6th if we’re doing this by park).
In conclusion, no Umbrella Tom picture is necessary here.
We were at WDW from February 5-9th, park hopped most days, did not stay deluxe so just enjoyed the hours available. We believed the crowds were at 5-6/10 most days, with wait lines somewhat high at each attraction. Perhaps luck of the draw but beat out many via genie plus. A lot of the “crowdedness” otherwise was just people standing in groups in the middle of walkways… no self realization that they were impeding traffic to attend to kids or take water/snack breaks. WDW offers areas to sit back to do these things but… they were not being used… Our trip overall was great – we hit all of our favorites and even took time to do the paint by number at Epcot.
We went for 7th visit late January to 4th February.
It felt busy. At nearly 50 we just don’t enjoy 60 mins in a queue. We prefer 45 mins in a lounge with a cocktail /beer then short queue.
So we got genie plus for 3 days and it made it lovely. We did one day each park where we just did shows and short waits (then off to a hotel for lunch) plus rope dropped say rise or slinky or did avatar at 7.45 just before park close.
Then another day with genie plus using your priority order. At $15 both adults it was the same as an extra beer.
At this time of year it’s interesting how it’s mostly adults – no kids beyond small ones -and adults like us in their 40s- 60s and 70s. With the money to spend on nice hotels and nice meals. A market Disney should cater to more (Ie more tour spaces -none were available at all for by visit -all sold out 60 days in advance)
I even watched the bear jamboree in your honour. Though I think I preferred it in Japanese for added quirkiness!
I was nervous about crowds with pent up demand and what looked to be 5/10 6/10 days feb.2-8. I found navigating my day by setting up genie + at midnight, quickly getting up at 7 am to book what we needed and then getting to sleep in and arrive at the parks for later worked great. Our last trip with only 3 fast passes required us to get moving VERY early. With 2 teenagers in the group that’s not always a popular plan. I found spending the extra money on the genie + paired with stacking fir later in the day a game changer for relaxed and flexible park time. We did all the rides we wanted, VQ for Guardians and DID pay for ILL for RoR and SDMT but honestly- what’s an extra few hundred bucks if your already spending a small fortune, to at least make that small fortune worth the experience. The only thing that was a bit of a bummer was spending the $15 at MK on Feb 8th, when almost all rides were practical walk ons. At points, the standby lane was shorter than it would take to wait for my LL to be ready to scan. So kind of a waste of money that day. But over all, the new system completely eliminated rigid scheduling around 3 ride times like old FP did. Even at HS we managed to leverage our genie + picks to fit perfectly into our day. So much hype about using it but it was easy and worked out great. I’d imagine if used correctly- any day can be successful there regardless of crowds. The food prices on the other hand. Sticker shock. First time there without free dining. Yikes. lol
In Brevard county, Florida schools are IN session on 2/20 (the MLK holiday Monday) for hurricane makeup day. Perhaps other FL counties are doing the same. There may be less locals at the park on Monday than usual.
I’m going Feb 24 – Mar 1 and I have a question about the closed walkway from MK to the Grand Floridian. Does this mean it won’t be possible for me to walk to the Poly from MK using this walkway?
Just wanted to let you know, my wife and I just returned from Walt Disney World. We put together a game plan for our 4 day park visit based on your itineraries using Park Hoppers, Genie Plus, and Early entry and we had the most relaxing and fulfilling trip we have ever experienced. We go every other year and have since 2006, and this year by far was our best trip. The longest line we waited in was 30 minutes most everything else was just walking through the ques. We do research and plan probably more than the average person, but to us that is part of the fun and anticipation.
We also went resort and lounge hopping on our day off and had a blast!!! That is a new experience in itself that we cannot wait to expand on.
Just wanted to thank you and to let you know you and your blog are extremely helpful and very entertaining.
Sincerely,
Wish We Were Still There
Thanks for sharing–glad to hear you had a good experience, and that the resources here helped!
There no longer is a “slow” season at WDW. I have been six times during different months (March, April, September, October, December) from 2007-2021. There used to be some reliably quiet times that would be around a 3/10 or 4/10 in terms of crowds and lines, but I think that simply does not exist anymore. In the research we did prior to our most recent trip, we read that end of January tends to be one of the quietest times of year at WDW. So we booked a trip and we went to WDW for two weeks, in the last week of January and first week of February 2023. Although this period is supposedly a “slow” or “quiet” time, it was by far the busiest I have ever seen or experienced of any of my trips to WDW.
We only went to the parks on weekdays (avoided weekends, which we used as our resort days), and we felt the parks were PACKED. Lines for rides were surprisingly long. Even for rides that on past trips were frequently “walk ons” (for example, Star Tours at HS, Dinosaur at AK, Spaceship Earth at EPCOT, PeopleMover at MK), we often found these rides with posted wait times of up to 45-55 minutes or more! Some of the more popular rides had what we would consider to be massive wait times, well over 2.5 hours. We rope dropped early morning entry, but ride wait times within 5-10 minutes of that early entry would already be upwards of 60+ minutes. We were lucky if we could get through even one ride queue within about 60-75 minutes of the start of the early entry time. Long gone are the days were you could knock out 2-3 rides with the early entry (when it was called Extra Magic Hour). Now you can only get to one ride, but it it ends up taking almost as long as if you didn’t bother rode dropping or doing the 30-minute early entry.
We stayed at a deluxe Disney resort so we did the extended evening hours at MK and EPCOT, but found that wait times during these extended hours did not really lessen. The posted wait for Seven Dwarfs Mine Train at MK did not drop at all below 45 minutes during the extended evening hours for deluxe resort guests, and the line looked exceedingly long. However, we did do the After Hours event at both MK and HS – these were the ONLY times we experienced relatively short wait times for rides.
Based on our perception of the crowds, length of lines for rides & food, and posted wait times during our visit, we would estimate that it would have been around an 8/10 on a crowd calendar level (not the 4/10 that many of the more popular crowd calendars were predicting for the days of our trip). This was definitely not what we expected for going to WDW on mid-week days at the end of January and beginning of February.
We found the same situation with the Frozen ride at EPCOT. We had rented DVC points so we got the extended hours. The wait at Frozen (at least up until 10:45) was similar to the daytime wait.
“There used to be some reliably quiet times that would be around a 3/10 or 4/10 in terms of crowds and lines, but I think that simply does not exist anymore.”
Those crowd levels still exist, the scale is just different.
That’s seemingly one of the fundamental issues with crowd calendars and reports for visitors who have been visiting for years. You are comparing today to a decade (or however long ago), which is not how these resources work. I understand the desire to do that, but it would defeat the purpose of a crowd calendar if every day were a 7/10 or above because current crowds are being compared to 1971, 1986, 1999, 2006, etc.
I’m not referring to a decade ago when I say there were times that WDW had 3/10 or 4/10 crowd levels. We went in September 2021 and the crowd levels were quite manageable (even with no FP or LL at that time). That was barely even 18 months ago, and the crowds then would be what I consider around a 4/10. Comparing our recent trip less than two week ago, the crowd levels were up dramatically, to what I would consider an 8/10. If that’s still considered a “slow” time of year where we saw Star Tours had an hour-long wait and the PeopleMover was consistently above a 30-minute wait, then I would definitely hate to see what a “busy” time of year at WDW is like!
September 2021 was absurdly low at WDW; it would have registered as a 1/10 in 2019 or 2022.
We were there from 1/22-2/08. If these were low crowds. I would hate to see high crowds. There was only one day-01/29 at Hollywood Studios-when the crowds slowed down.
We had a nice time at the resorts, and went into the parks later in the day. We missed most of the big ticket rides, but we accomplished our main goal. Our 4 year old granddaughter had a magical time.
I’m surprised not to see a mention about school vacation here in the Northeast. Our February break is always the third week of the month (President’s Day week) and a HUGE vacation week for families. Especially to warmer climates and Disney in particular. Personally, I can name three families headed to Disney starting this weekend. I have to imagine there are thousands more who take advantage of this school vacation week to escape to Orlando. Just an observation of another factor that likely has an impact on the increased crowds during the third week of February.
The school breaks in the Northeast, Southeast, etc. are the primary basis for the Presidents’ Day and Mardi Gras crowds. It’s not that there’s any inherent draw in the holidays themselves that compels people to visit Walt Disney World. (Although Walt Disney World having a seasonal Mardi Gras event would be pretty cool!) That’s why the breaks aren’t listed separately–they’re one in the same. 🙂
I will be at Epcot Friday march 3 and universal studios Saturday march 4, coming from nyc. Do you expect big crowds during those 2 days? Thank you
I’d anticipate those dates being on par with the current week in terms of crowds. On the above average side, but nowhere nearly as bad as what’s going to happen for Presidents’ Day and Mardi Gras.
I was there 1/25-29 and the crowds were pretty low! It also was completely freezing though! Very annoying Florida! Hah. I probably won’t go again that week just to avoid having to wear a full on coat and hat which was annoying. I know weather can’t be predicted. I always tell everyone to avoid Presidents Day week. Georgia schools get the entire week off so from the 17th through the 26 is just going to be complete insanity with the most insanity ensuing the 18-21. I do appreciate the calendar going back to predictability though.
I guess I’m the weird one, but I LOVE the cold weather at Walt Disney World. Assuming I’ve packed appropriately, I can always add more layers to stay warm. Only so much that can be removed during the hot and humid summer months!
Totally get why those ‘escaping’ cold weather states would want 80+ degree temps and sunshine, though. 🙂
We cancelled our President’s Day week trip.
Bummer to hear that, but I can’t say I’m surprised given all of your concerns about the crowds.
We were in Magic Kingdom on 01/31 and it was like being there during covid but without the masks. Pathways were empty, rides were almost all walk on. It was 80 Degrees and sunny, Castmembers were in fantastic moods and the park was spotless. Definitely one of my favorite park days of the past few years.
Very jealous! We did many days like that during MNSSHP, but crowds picked up by the time weather was pleasant during MVMCP. Sounds like you got the best of both worlds!
My son and I were at Magic Kingdom on 1/31 also and it was glorious! I specifically planned the day there with Tom’s advice in previous posts. I was taking pictures of the empty areas and sending back to my husband in AZ that I was in utter shock at how empty it truly was. The hub area was literally empty around 2:30PM….same for the area around Jungle Cruise just a little while earlier. If I am ever there again during an early close day, I am specifically going there. Thanks Tom for the great advice always!