
Winter Crowds Heat Up at Disney World as Worst Weeks Arrive
It’s been a busy winter at Walt Disney World–a trend that’ll only worsen with the arrival of what’s likely to be the two most crowded weeks. This wait times report shares data for January and February 2024, our observations, plus surprises we’re seeing so far and how this compares with the last two years.
As covered in last month’s crowd report, Winter (Still) Is Not Off-Season at Walt Disney World, it’s been a surprisingly busy start to the year. Since around 2018, winter has had really high highs and relatively low lows. The busier dates have been driven by school breaks, runDisney races, youth sporting events at ESPN Wide World of Sports, and just a general increase of visitors fleeing to Florida to escape cold weather at home.
The slow dates have been due to more or less the opposite of that. School going back into session (and proximity to other breaks, making parents less likely to pull kids out of school), overall lower inbound traveler numbers to Florida versus milder months, lulls in the event schedule, etc. Even as Walt Disney World crowd levels had increased as a whole for winter, there were still sweet spots for visiting.
Accordingly, we expected there to be some great dates to visit in January and February 2024. So long as planners didn’t go in expecting totally ‘dead’ parks with crowd levels on par with what they used to be prior to Winter 2018 (or 2021, which was an anomaly), it’d be a good time to visit.
Between normal trends and the expectation that the exhaustion of pent-up demand would push crowds even lower year-over-year as compared to January and February 2023, there seemed like a few good to great weeks to visit this winter. It’s now safe to say that was some degree of incorrect. Crowds have been heating up over the course of the last month-plus, and that trend is only likely to worsen with what are historically two of the worst times to visit now arriving.
As always, what’s covered in these “crowd” reports is actually posted wait time data that’s pulled from My Disney Experience and compiled into graphs for tracking and comparing various days, weeks, months, and years. A lot can be gleaned from posted wait times, but it’s not necessarily conclusive of in-park congestion or crowds.
There are several other variables that can impact “feels like” crowds, from festivals at EPCOT to weather to guest demographics to ride breakdowns to operational efficiency to time of day or day of the week. (Literally everything on that list would be relevant in Winter 2024 thus far!) Yada yada yada…that’s just a partial list! Beyond that, wait times are often inflated, inaccurate, or otherwise manipulated by Walt Disney World.
In short, wait times are an imperfect measure of Walt Disney World’s raw attendance or crowds–which have increased by several million people over the course of the last decade-plus. With that out of the way, let’s dig into the data and look at Walt Disney World wait times. As always, all graphs and stats are courtesy of thrill-data.com:
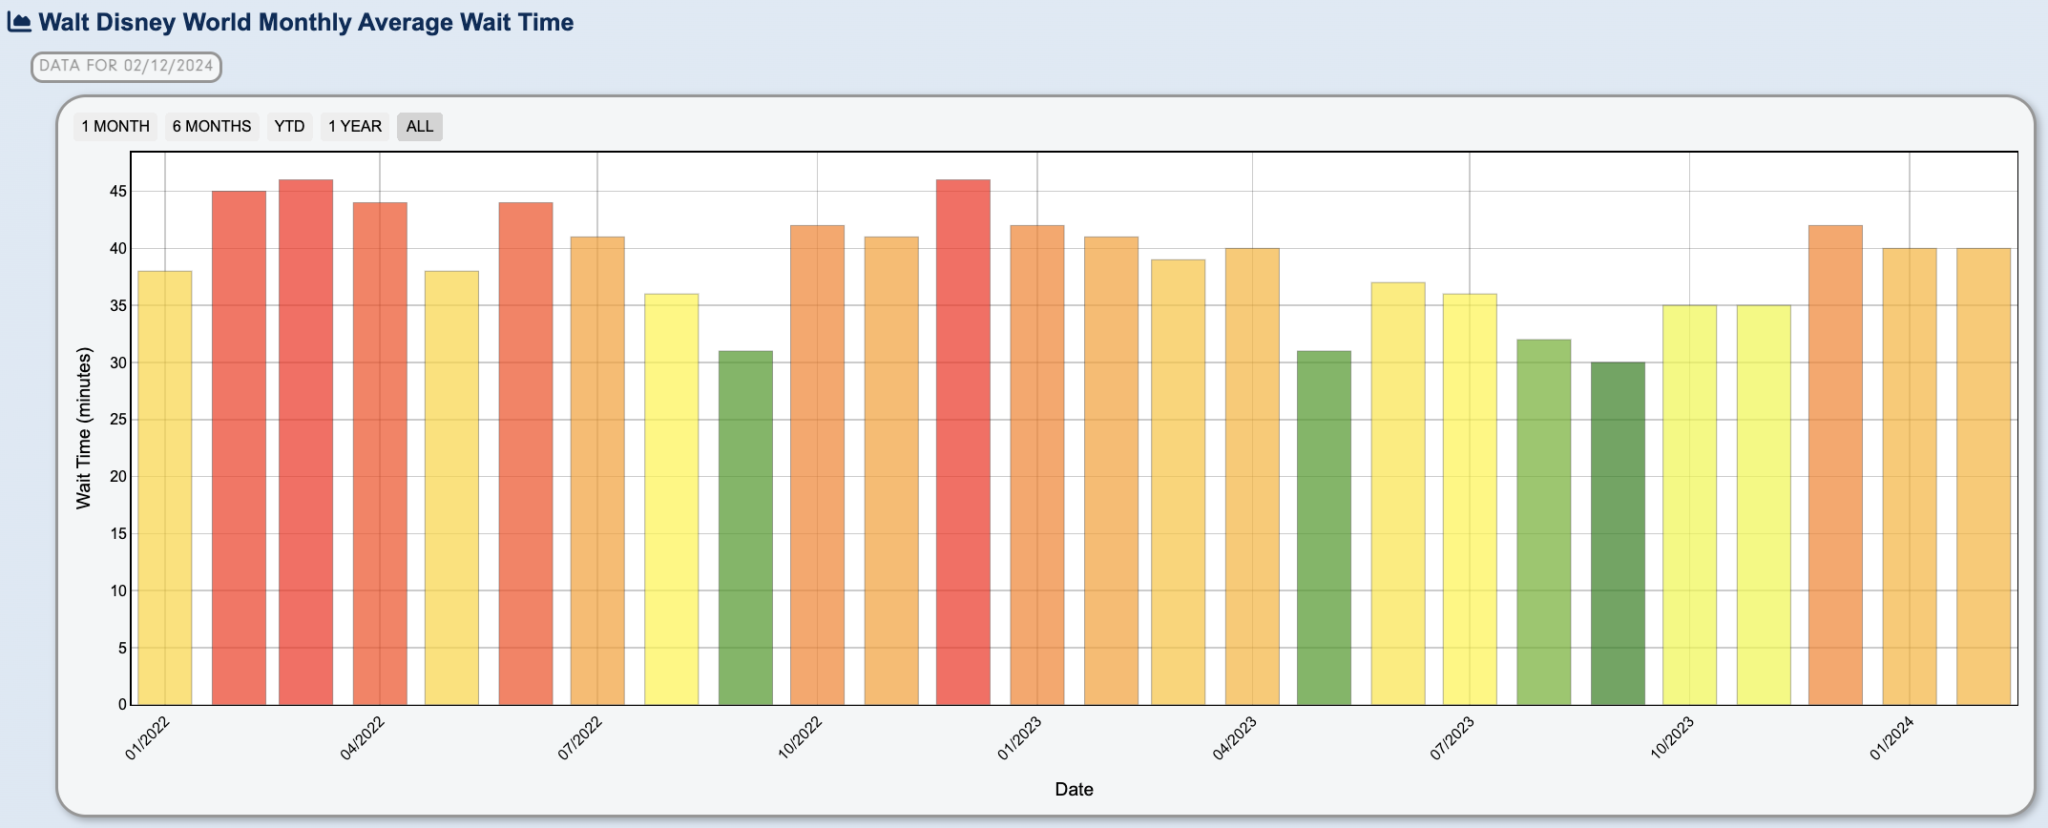
We’ll start with a high-level look at the monthly numbers for Walt Disney World as a whole.
The last three months don’t look terrible if you’re looking at the first half of the graph, which has a lot of red. These months are “only” orange. However, that first half is the heart of “revenge travel” and ended up being the worst year ever for Walt Disney World in terms of wait times.
If you look instead at now versus last May through November, you can see a sharp contrast–the parks have been much busier in the last 3 months. (Really more like 2.5 months, since December 2023 started slow but the last two weeks more than made up for that.)
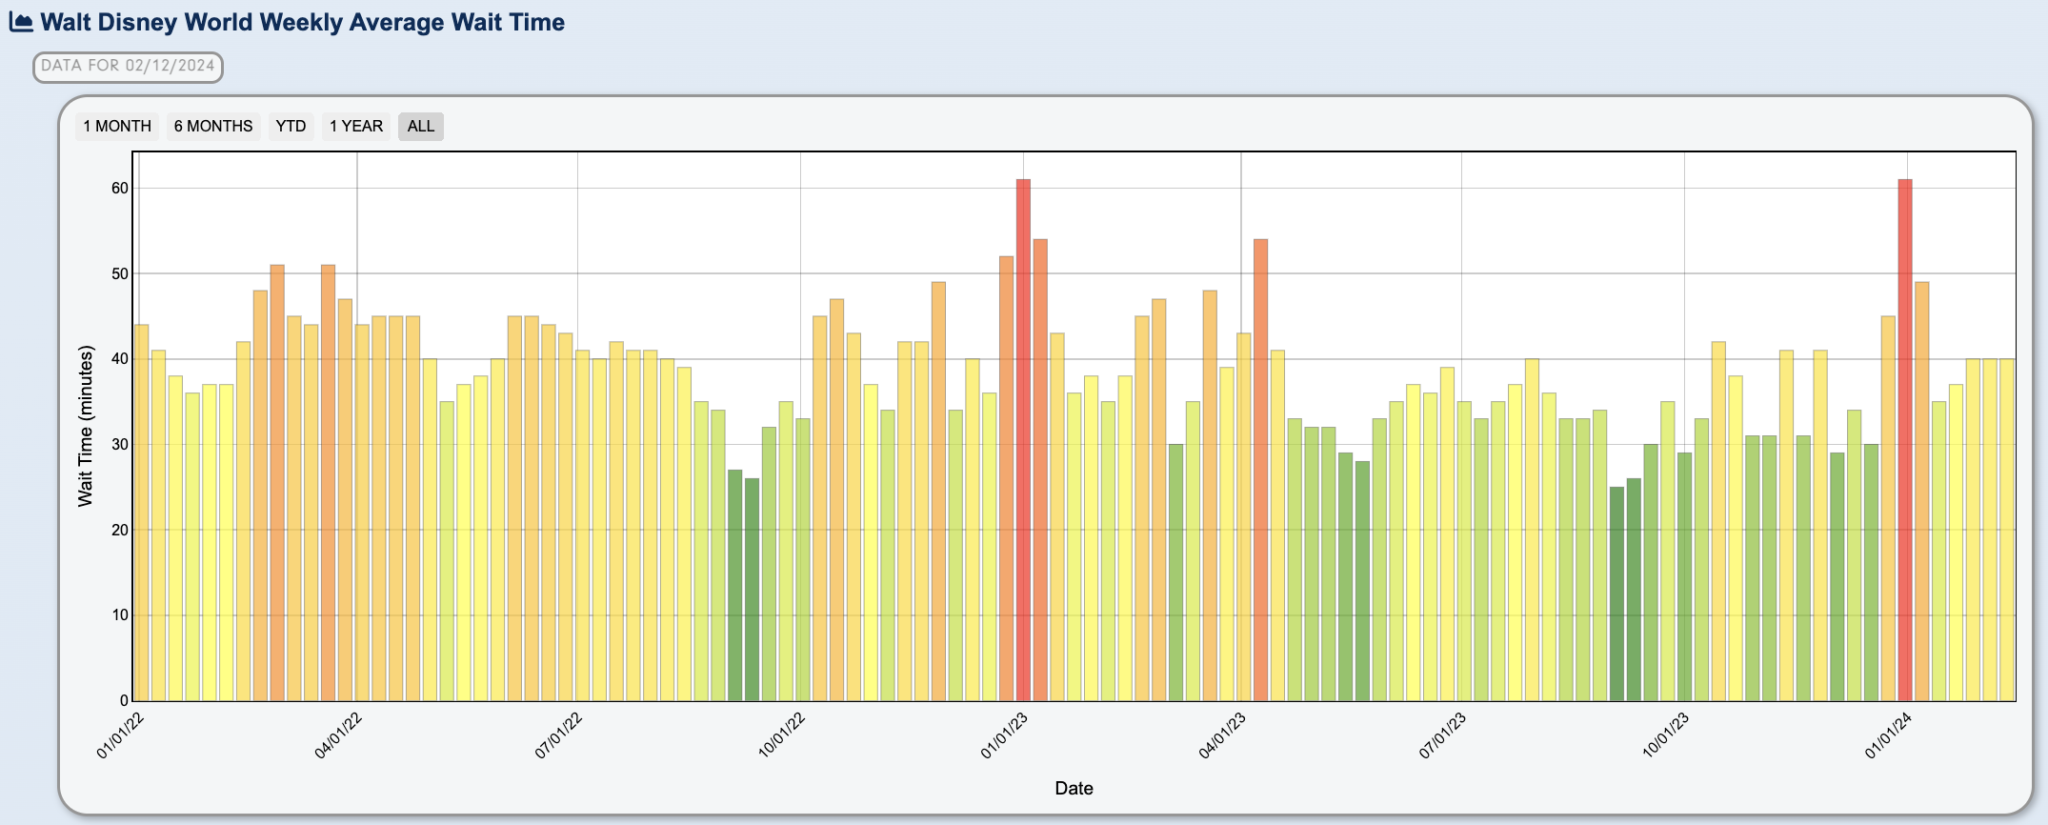
The weekly crowd level view makes the differences easier to spot. The week between Christmas Eve and New Year’s Eve was off the charts–slightly busier than the same week year-over-year. The following week that encompasses winter break was still really bad, but not quite as bad as last year. That’s partly a matter of timing, though; this year’s holiday breaks ended earlier.
If you look at the weeks since then, there was really only one slow week and one moderate week. The last three weeks have been above-average. In fact, the last 5 weeks of January and February 2024 have all been busier than the same weeks last year.
That might not seem like a big deal, but it really is. Pent-up demand was still going strong last year through Spring Break, after which point it fell off a cliff. The wait times weren’t as bad as 2022, but they were still elevated. After Spring Break, every week was slower year-over-year in 2023.
That’s why we expected slightly lower levels in early 2024–because those dates were likewise “lapping” the pent-up demand period. Instead, they’ve been busier. (We expected January 28 to February 3, 2024 to be one of the best weeks of the year. Even if you hit Magic Kingdom on January 29 and the other parks on their optimal days, that still would not have been true!)
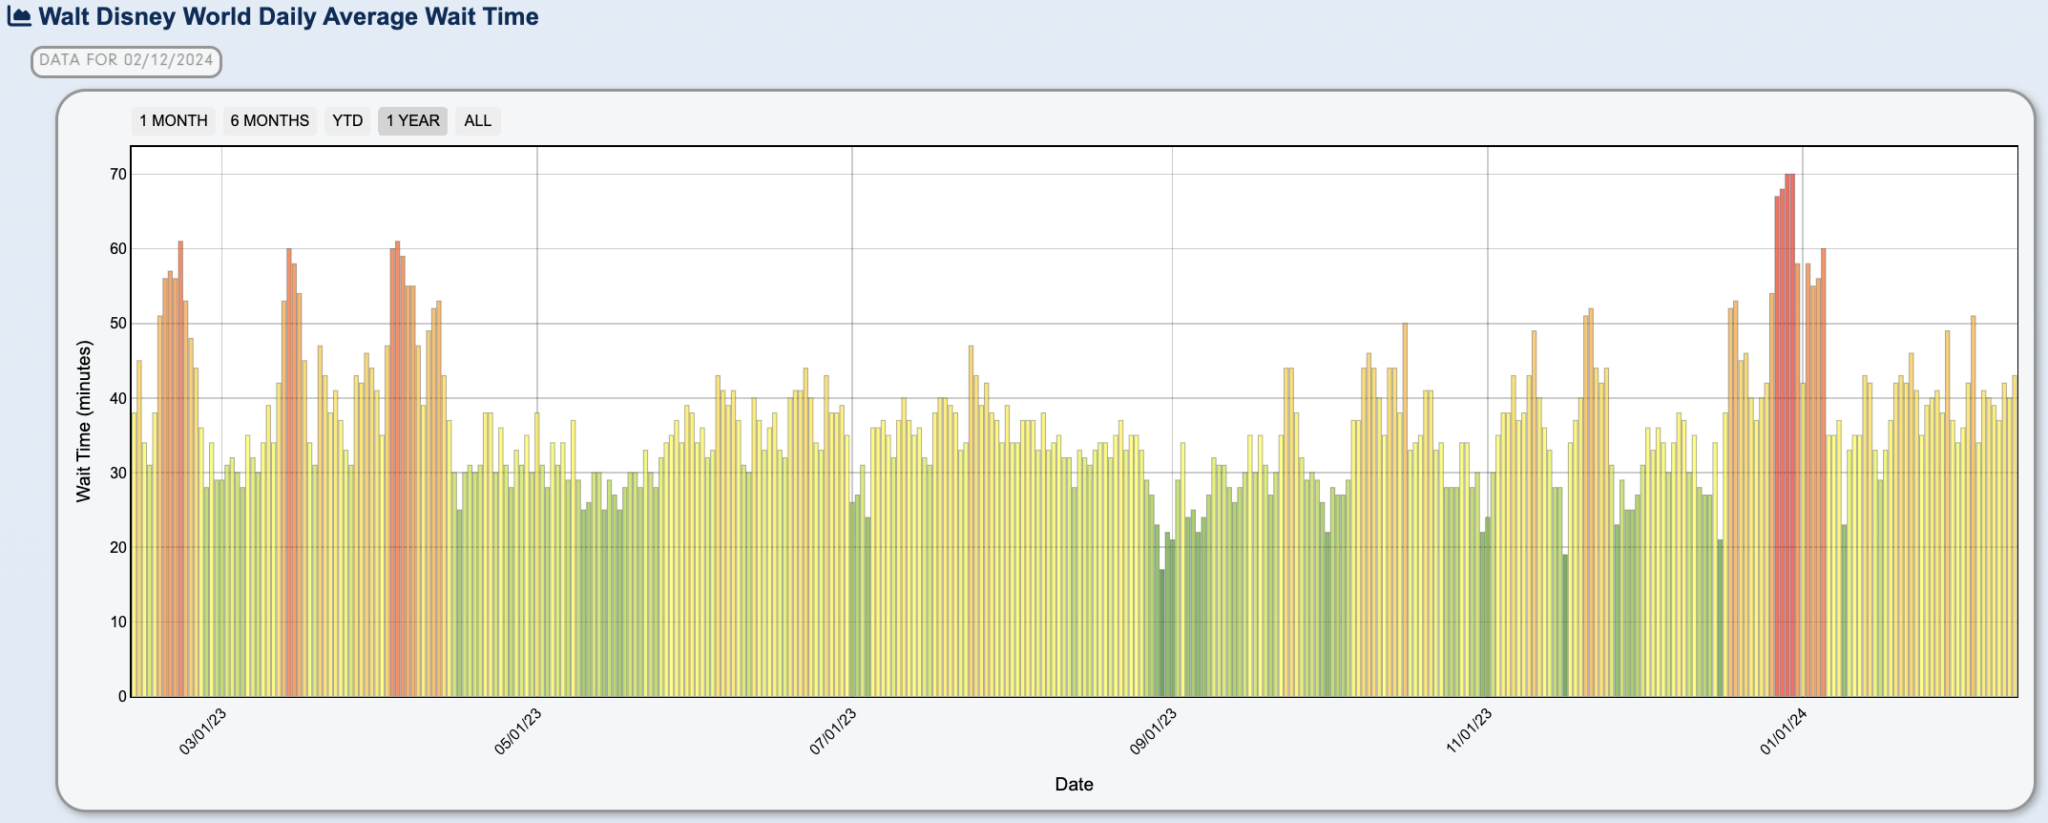
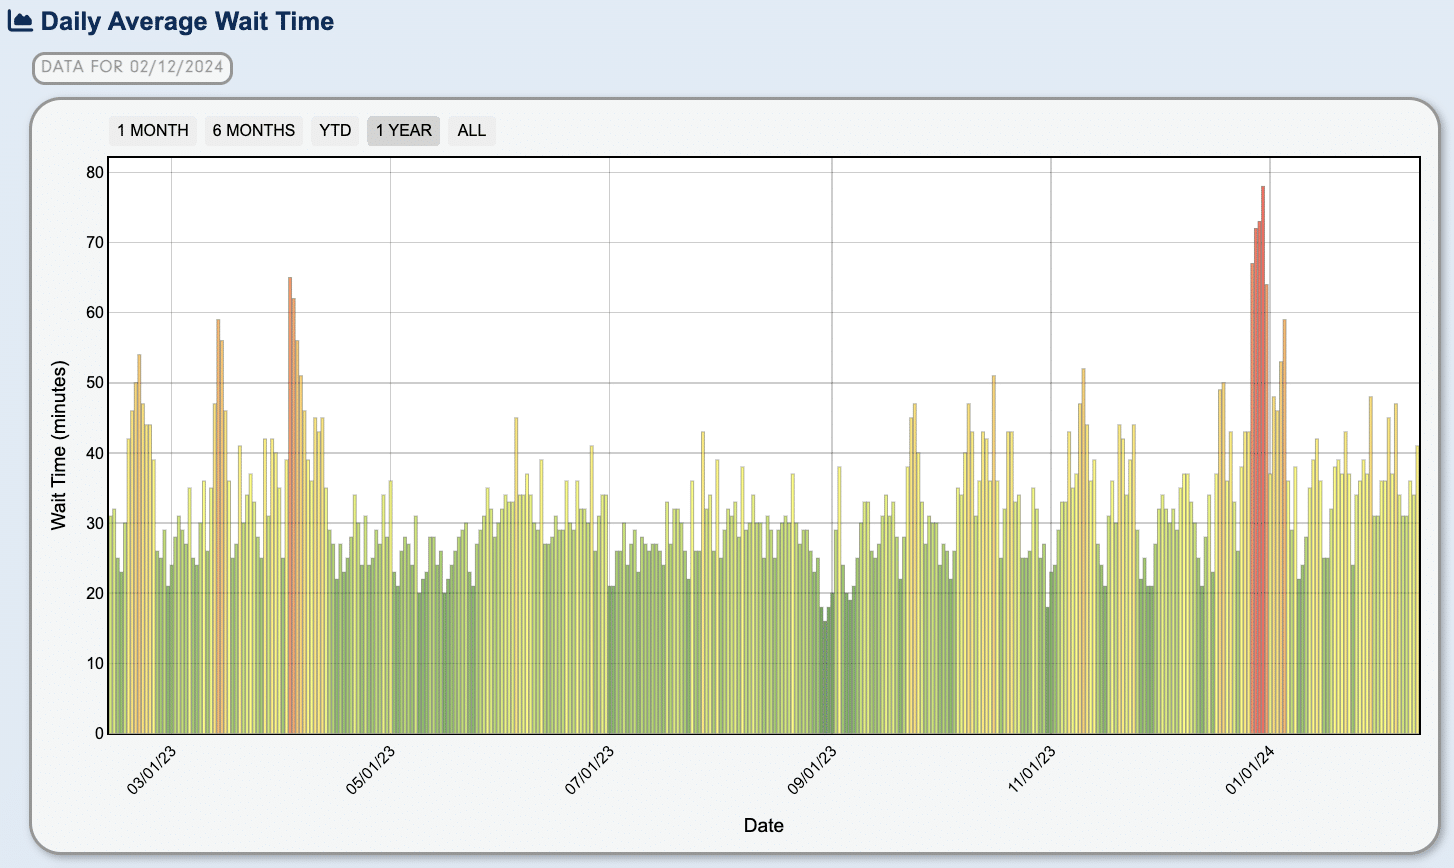
Above is a look at the daily numbers over the course of the last year.
Although no days the last few weeks have been even remotely on par with the weeks of Christmas, New Year’s, or even the final week of holiday break–but that’s never the case. Those are off-the-charts bad, to the point that they distort crowd levels for more normal times of the year.
A better comparison is to last year’s summer vacation or fall break. The last three weeks have been busier than any time during the summer tourist season, with many dates on par with the briefer but bad fall break window. Winter has also been much busier than the lulls during November or December. In short, it’s been busier than we’d expect this time of year to be–and that’s before the mid-winter break crowds really start to arrive in full force.
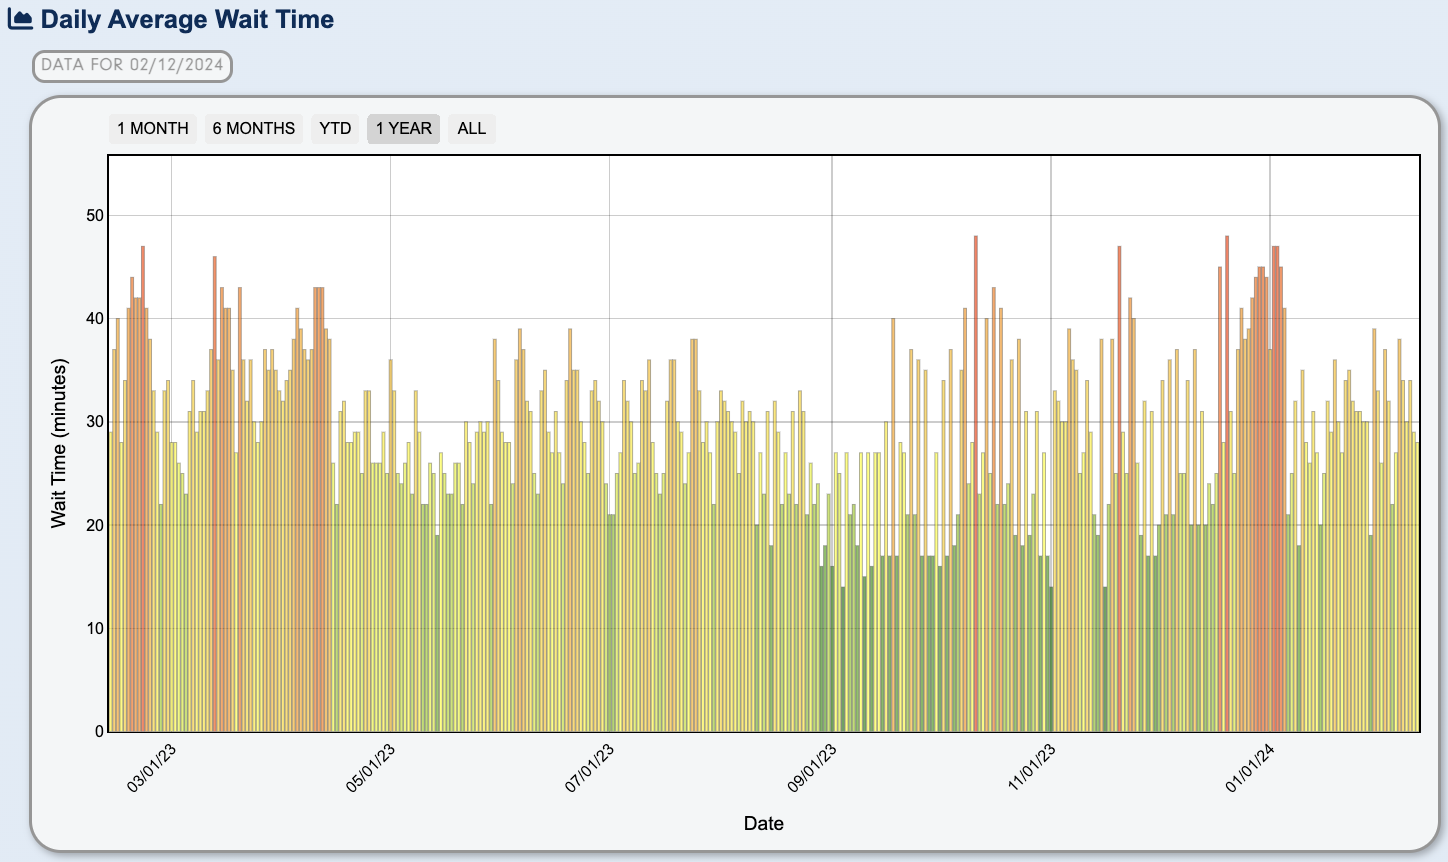
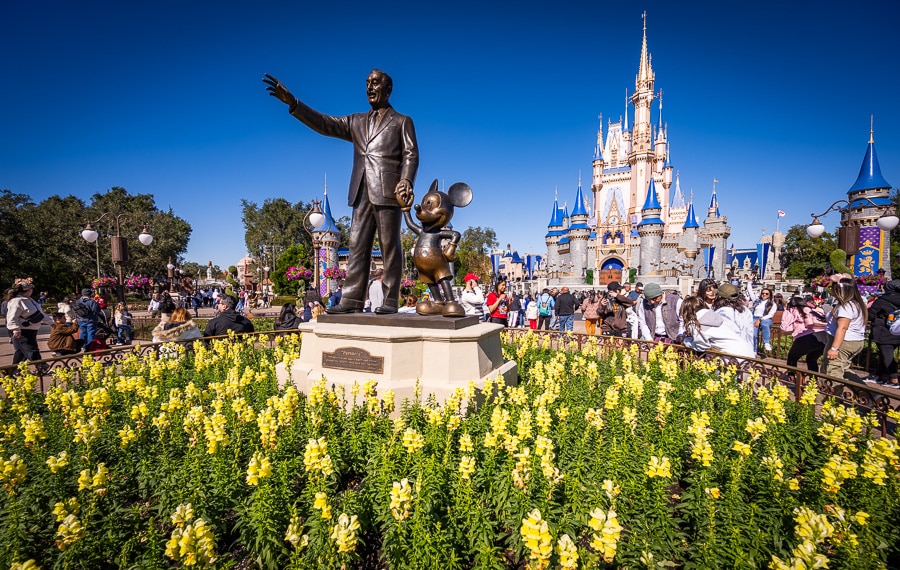
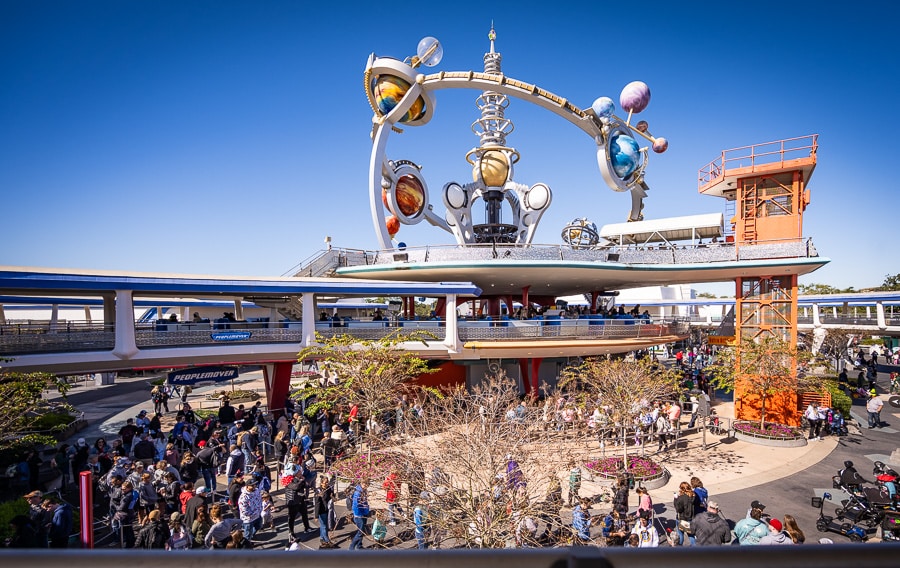
We’ll start the park-by-park data with Magic Kingdom, where crowd levels have mostly normalized after several consecutive months of Mickey’s Not So Scary Halloween Party and Mickey’s Very Merry Christmas Party dates during which there’s a “porcupine pattern” to attendance and wait times. Still, there have been about a half-dozen dates this year that have been quite quiet.
Some of these are not easy to explain–and are likely a matter of ride refurbishments & breakdowns, weather, and the changes to park reservations and hopping rules. This was my experience with Magic Kingdom last month, with lots of downtime (both planned and unplanned) plus weather causing even more unpredictability than normal.
On a positive note, at least for anyone who heeded our advice, January 29, 2024 was uncrowded. That was the day that the park closed at 4:30 p.m. for a Cast Member recognition event. This happens every January, and usually is one of the 5 least-busy days of the year as a result. And thus far, that’s accurate–but it was busier than the same date last year and there’s a decent-enough chance that Party Season dates in August and September will be even slower. So even January 29, slow as it was, actually exceeded expectations.
Predictably, it also caused a ripple effect for adjacent dates and other parks. So if you were at Walt Disney World that week and didn’t do Magic Kingdom on January 29, the degree to which the earlier closing displaced crowds negatively impacted you.
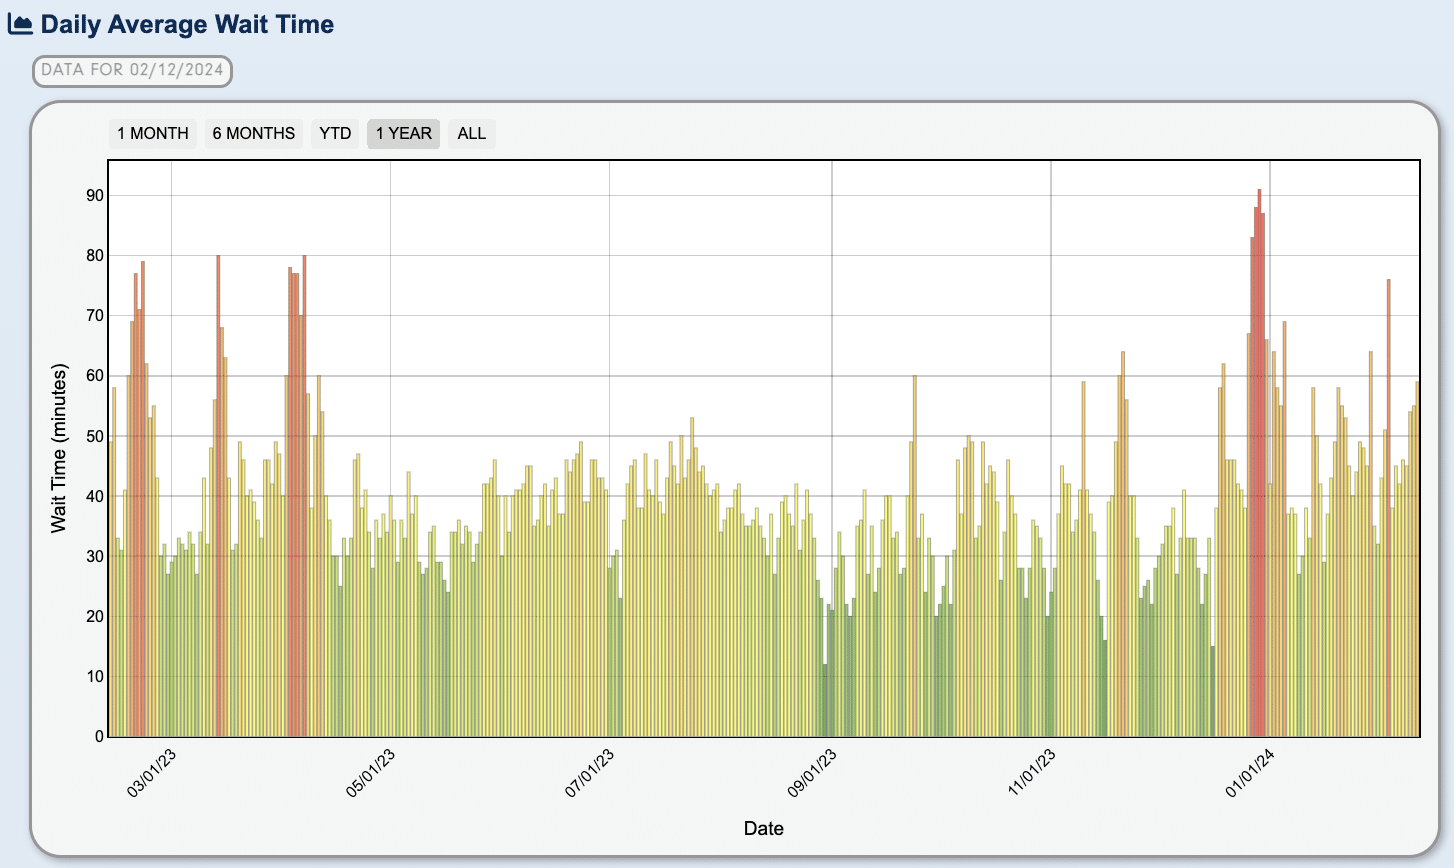
Animal Kingdom is coming off its holiday highs, when wait times were absolutely off-the-charts. If crowd levels weren’t capped at 10/10, those dates between Christmas and New Year’s Eve would’ve been like 15/10–they were that much higher than the normal 10/10 range.
Wait times were manageable post-winter break, but there was a spike for the Martin Luther King Jr. Day holiday weekend and several other dates have hit 9/10 or 10/10 crowd levels. This includes the aforementioned crowd displacement on January 29, as well as February 3, which was a truly awful day for DAK.
I was in Animal Kingdom for two of those 9/10 days last month, and they were bad. Shockingly so, to the point that I was surprised they were “only” 9/10. If my experience was representative, I’d expect 7/10 and 8/10 crowd levels there to be pretty miserable, too. This included long waits for attractions that often are easier to accomplish, such as the stage shows having actual lines and Lightning Lanes being valuable at them. Ditto Dinosaur and Kilimanjaro Safaris, which had overflow queues spilling far out their attraction entrances along with triple-digit waits. (Kilimanjaro having 90+ minute waits is not necessarily abnormal, but that being an all-day thing isn’t.)
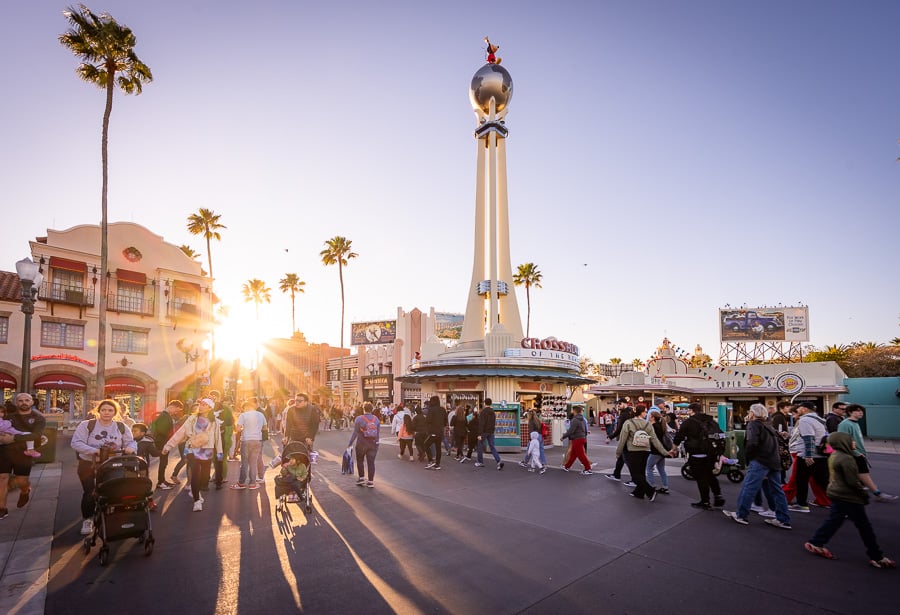
Then there’s Disney’s Hollywood Studios. After colossal crowds throughout the holiday season, it’s now averaging low-to-moderate crowd levels (in the 3/10 to 6/10 range).
It’s doubtful that any first-timers to the park would “agree” with the data. Hollywood Studios is unpleasant when wait times are “only” moderate–it’s downright miserable at 10/10. DHS simply cannot absorb elevated attendance, and “feels like” crowds can be pretty bad once the crowd level is at 6/10 or above.
Also, the baseline is higher. Disney’s Hollywood Studios is averaging 44 minutes per attraction for 4/10 crowd levels the last few weeks. That’s still much worse than Magic Kingdom’s ~31 minute range, which is due to a disproportionate number of headliners at DHS and not enough ‘small stuff’ that doesn’t draw as long of waits.
It also doesn’t help that Rock ‘n’ Roller Coaster is closed for refurbishment and it seems like multiple breakdowns occur at other attractions throughout the day. Early Entry or nighttime remain the easiest ways to “beat” DHS, followed by (or alongside) Lightning Lanes.
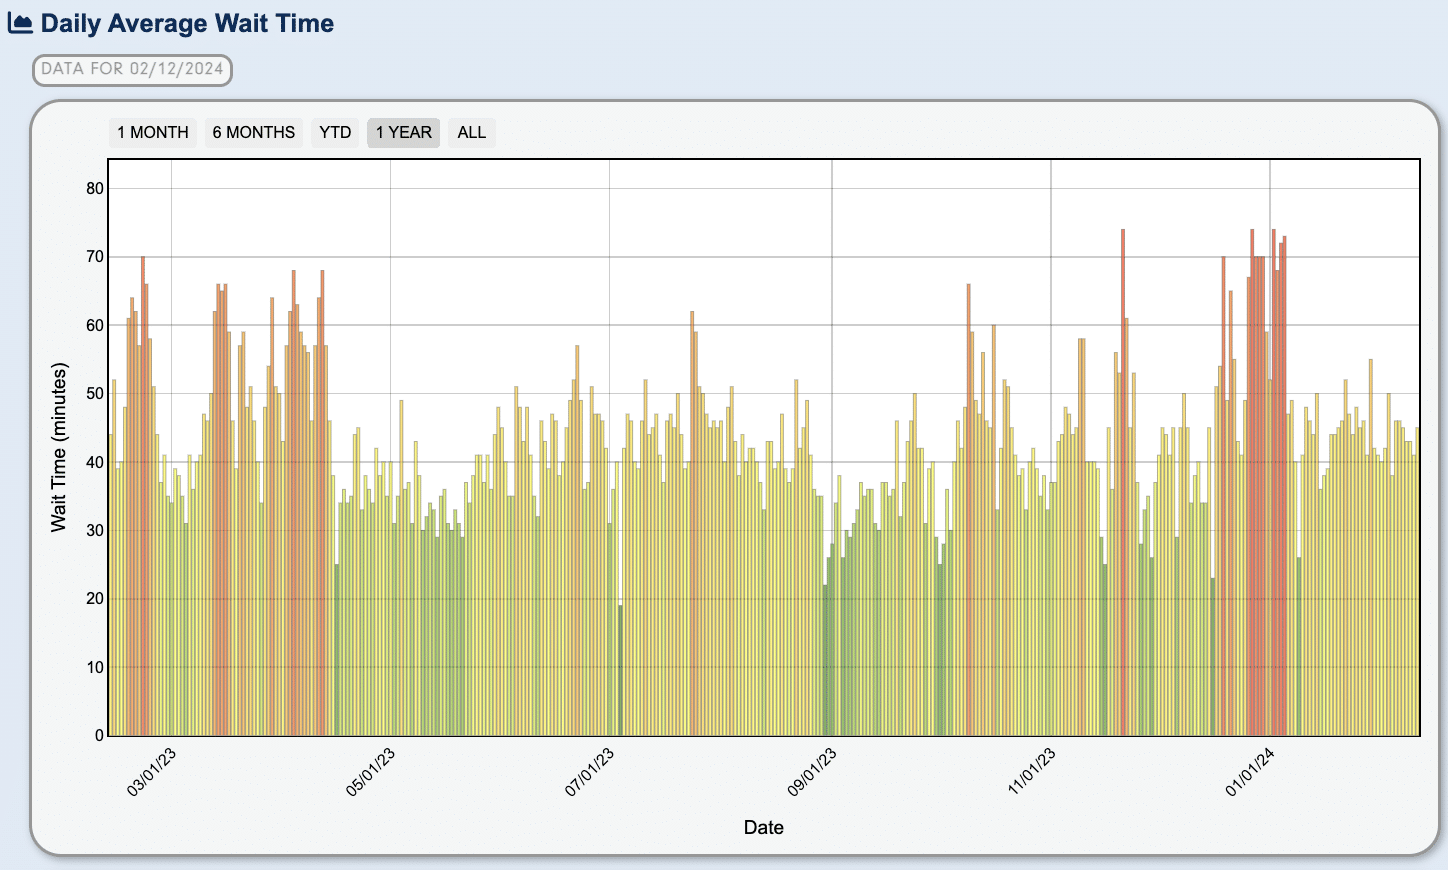
Continuing to EPCOT, where crowd levels are officially high with weekly average crowd levels of 7/10 to 8/10 for the last 3 weeks.
That may not seem awful, but outside of Christmas and New Year’s, this has been the worst 3-week stretch at EPCOT since last Spring Break season. Not only that, but it’s important to emphasize that this is festival season, and there’s a gap between crowd levels as represented by ride wait times and crowd levels as represented by congestion or, say, the average length of a line for a Food Studio at Festival of the Arts.
As a reminder, nothing at EPCOT’s festivals has a posted wait time, so this congestion is not “picked up” by crowd levels. Meaning that locals showing up, wandering around, grazing the food booths, enjoying art and entertainment, but NOT doing a single attraction contribute to congestion but not to crowd levels.
Locals and Annual Passholders at EPCOT are worse for crowdedness, as they’re pretty much always in walkways and not in standby lines. Call it the “EPCOT Effect” or whatever, but it’s noticeable at this park more than any of the others. Anyway, it was an objectively bad 3-week stretch at EPCOT, but subjectively, I’m sure it felt even worse. (There should be a secondary crowd calendar for EPCOT that simply counts cars in the parking lot–several days in the last few weeks involved grass parking, which would basically be a 10/10 on that scale.)
Ultimately, how bad this winter has been so far at Walt Disney World depends upon a few factors: whether you went immediately after Marathon Weekend in the one (1) lull, which days you did each park, and expectations–were you anticipating off-season or above-average crowds, or something in between. While there have been opportunities to beat the crowds and enjoy a near off-season (more like shoulder season) experience, those options have been limited.
On balance and as a whole, our view is that this winter has been worse than expected. Instead of continuing the trend of pent-up demand dying down further, January and February 2024 have mostly reversed course. The most noteworthy part of this crowd report is that the last 5 weeks of January and February 2024 have all been busier than the same weeks last year. When you combine that with our expectation that crowds would drop slightly this winter as compared to last, there’s a significant predictions vs. reality gap.
While it’s still too early to call this a trend that’ll continue for the rest of the year, it is worrisome. As discussed recently in Why Are Walt Disney World Resorts Sold Out in 2024?, Visit Orlando has reported that hotel bookings for 2024 are already outpacing last year by over 5%, and advance airline ticket sales into Orlando are also up in the first quarter of 2024 by roughly 10%.
Those numbers are not conclusive of higher attendance at Walt Disney World, but they certainly aren’t positive signals for anyone hoping for lower crowd levels. (However, it is noteworthy that Disney itself did not discuss forward-looking occupancy or attendance for Walt Disney World on last week’s earnings call; silence usually means it’s not positive–if it were, they’d brag about it.)
In any case, what we might be seeing is a normalization or slight ‘reverberation’ after the pent-up demand of 2022. That 2023 was the ‘off’ year for families that visit semi-frequently, and they’re returning in 2024. Fears of a recession are diminishing, consumer confidence is improving, discounts are getting better, and policies are returning closer to pre-closure norms.
All of this could result in a bounce-back year for Walt Disney World. Or that the company is doing what’s necessary to incentivize fans to return, pulling the correct “levers,” etc. That could all mean that Walt Disney World’s numbers are not “boast-worthy” on the company’s earnings calls, but are trending back upwards after a slow ~8 months from mid-April through mid-December of last year.
Whatever happens in the medium term over the course of 2024, we’re pretty confident that, in the near term, February 2024 only gets worse from here. As we’ve warned before, all bets are off once Mardi Gras, Presidents’ Day, and Princess Half Marathon Weekend roll around. (See Mardi Gras Crowds at Disney World and Avoid Ski Week Crowds at Disney for more.)
Mardi Gras is here now, and there isn’t much of a reprieve until around February 26, 2024 after all of those other breaks and events end. Genie+ prices have already shot up, with the Magic Kingdom and Park Hopper options both priced at $29 since Friday, which is the highest they’ve been since January 4. We expect those prices to increase further next week, along with crowd levels.
That amounts to over 2 weeks of elevated attendance, which could be enough to push average wait times for February 2024 as a whole high enough that this ends up being the worst month since 2022. (It’s only 2 minutes away right now.) Suffice to say, we aren’t predicting the second half of February to be the off-season at Walt Disney World…but then again, we never were. The next two weeks were always expected to be bad–the only real question was and is: how bad?!
Planning a Walt Disney World trip? Learn about hotels on our Walt Disney World Hotels Reviews page. For where to eat, read our Walt Disney World Restaurant Reviews. To save money on tickets or determine which type to buy, read our Tips for Saving Money on Walt Disney World Tickets post. Our What to Pack for Disney Trips post takes a unique look at clever items to take. For what to do and when to do it, our Walt Disney World Ride Guides will help. For comprehensive advice, the best place to start is our Walt Disney World Trip Planning Guide for everything you need to know!
YOUR THOUGHTS
What has your experience been with crowds at Walt Disney World thus far in Winter 2024? Have you been surprised by the wait times or congestion in January or February? Have you encountered ‘dead’ days during this time? Do you agree or disagree with our take on the crowds? If you visited WDW during January or February 2018-2020, what was your experience with wait times then (versus now)? Any questions we can help you answer? Hearing feedback about your experiences is both interesting to us and helpful to other readers, so please share your thoughts below in the comments!


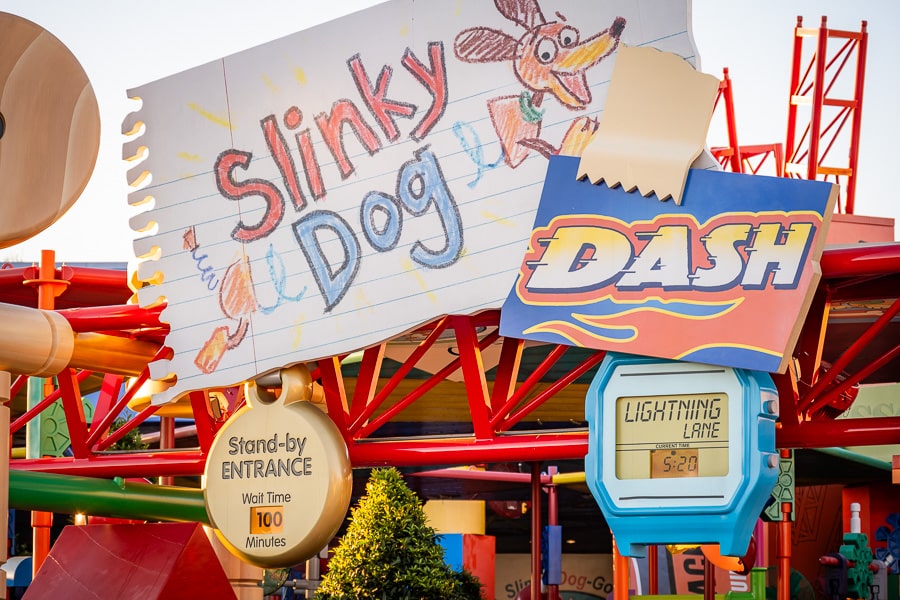
I was at WDW February 13-16, chaperoning a group of 120 8th grade students. While the wait times were brutal, the feels-like crowds were not bad at all! Pinch points like Toy Story Land and Peter Pan/Small World were slightly congested, but easy enough to pass through. My chaperone partner wasn’t into rides, do we did a lot of walking around. It was pleasant, along with the weather. The timing of Mardi Gras and Presidents Day seems to have diluted the (feels like) crowds.
I am going down to Disney at the end of February. Should I expect wait times and crowd levels to still be really high?
This really makes me nervous for our late Jan/early Feb trip next year! Was hoping to see the numbers drop off slightly before heating up again in the second half of Feb. Hopefully it’s an anomaly and returns to normal winter crowd levels next year (one can only hope lol!). I’m very glad I insisted on 2 weeks at WDW though… as someone with social anxiety who doesn’t cope well with crowds, I will be heavily reliant on the downtime that I’ve factored in.
My husband and I have been locals since Sept. ’22, so we’re starting to cycle through what we’d thought of as slow periods for a second time as passholders. Maybe it’s recency bias, but it feels like the lulls we enjoyed in our first year have not been as reliably slow the second time around. His parents came down to do a couple parks with us this past week, and we changed our plans to do AK on Sunday instead of Saturday because as of Friday night, Saturday reservations for all four parks were unavailable for both tickets and passes. We’re not sure if their ticket type required a reservation or not (it seems so confusing for tourists!), but they had made one for our MK day. Regardless, we figured if the parks were that booked, it was going to be miserable anyway. We had seen more cheerleaders than usual around MK and Disney Springs so I looked up events – turns out the national high school championships were in town. Granted we’re Pirate passholders but that’s the first time we’ve seen all the parks booked up – we’re not sure if it really was that busy or if the system glitched.
The good thing is that AK opened at 8 and we were able to get on Navi and Safari standby before the waits shot up, and we got a LL for FOP (we’d forgotten how stressful that can be to book while literally scanning into the park!). The park was open until 7 but we didn’t stay to see Pandora at night because FIL wanted to watch the Super Bowl. I wish AK would stay open past sunset more often than it does – perhaps that’s hard in the summer, but the 6pm close most days in the winter is so early!
We marvel at how many people must do Disney without any planning or research and wonder how they enjoy it enough to create these crowds that don’t seem to let up despite the prices (see the 135 minute midday wait for Everest). Even with a lot of knowledge from your blog and personal experience under our belts it can be frustrating!
This makes me nervous for DHS this Friday! The group priority is everything Star Wars and Galaxy Edge, especially RotR, and we don’t have Early Entry. I am trying to manage group expectations that we will be spending very long times in line. Hopefully we will be able to get an ILL when the park opens. Unfortunately both ILLs and Genie+ are out of our budget for this one day side trip to DHS.
After our last experience this past week, we decided that moving forward we are going to budget genie plus into our plans. We’ve avoided it because we just didn’t want to spend another dollar, but if we want to ride and not wait 60 plus minutes, then we decided we would need to consider budgeting for Genie Plus.
I think one variable that must be accounted for is the weather. The increasing intolerability of summer in Florida is driving individuals to find some time off work and school in winter to make the trip to Disney. Because summer is getting longer and hotter there is now 5-6 months out of the year when walking around a theme park is asking for heat stroke! I visited Disney in the first week of may 2023 and the last week of September 2023. I found both of these trips to be overwhelmingly hot. The kind of heat that saps you of your strength and will to continue. And neither of those weeks were peak summer. I would rather 9/10 crowd in January than the heat of Summer. I think the Disney Dining Promotion during the hottest months of the year proves that Disney is having to find ways to convince people to travel to Florida in the Summer.
Meghan, I totally agree about the heat. It’s been brutal in August and September. While the crowds were good, we’ve decided we just cannot return, even with the deals and discounts during those super hot months. It’s makes our experience unbearable. That being said, I just returned from a February 2024 trip, while the weather was good, the crowds were horrible. I don’t know which is worse, for me, I guess the heat.
I’m a native Floridian, and I can tell you, it’s not getting hotter, it’s always been hot from about mid April until October. Even in winter it can be rather warm. We had temperatures in the low 80’s this past week in North Florida so orlando was even warmer. We visited the parks in mid September last year and went in early, took a break in the mid afternoon and then we headed back in at night. September crowds aren’t to bad. You may have to deal with the rain though. November has been nice the last couple of years, just a little rainy at times. I hope your next visit isn’t
to bad. 🙂
Ang
We were in MK 2/5 and 2/7, and DHS 2/6. Genie+ was critical, rope drop let us repeat SDD for the kids, and the longest wait all trip was 30 min for Winnie the Pooh. Monday was just what we expected, and Tuesday and Wednesday were more crowded but still fun. I believe that the real problem is that the parks are still a quality product, but that the company takes profits from the parks and shifts them into shareholder dividends or the streaming business instead of investing enough in needed capacity improvements for the parks. I also think that when the parks do get improvements, they often miss the A- and B- ticket attractions that help spread out crowds.