
Attendance Increases As Disney World Loses Market Share to Universal Orlando
Last year’s attendance report that covers Walt Disney World and Universal Orlando has been released by the Themed Entertainment Association. This post takes a look at the winners and losers in the first almost entirely normal year post-reopening, with commentary about changes and trends for both Central Florida theme park heavyweights.
For starters, the Global Attractions Attendance Report is a collaboration of the Themed Entertainment Association (TEA) and the economics practice at AECOM. This calendar-year study of worldwide attendance is a resource for park operators, developers, and the travel industry. Top worldwide theme parks, amusement parks, water parks, museums, and theme park operators are named, ranked by attendance, and industry trends are identified. The Global Attractions Attendance Report is considered the gold standard within the theme park industry, and TEA is highly credible.
With that said, this report does have some asterisks. Namely, that Universal Orlando and Walt Disney World do not release attendance statistics as part of their earnings or annual reporting. There’s a whole ‘methodology’ section starting on page 80 of the report, which states that numbers are obtained “through a variety of sources, including statistics furnished directly by the operators, historical numbers, financial reports, the investment banking community, local tourism organizations, and professional estimates where necessary.”
The report goes on to explain why most theme park operators voluntarily provide statistics to TEA, and addresses skepticism about inflating or otherwise manipulating statistics. Although there has been some skepticism about Walt Disney World doing precisely this over the years–much like they do with wait times–we doubt that’s happening here for numerous reasons (all explained starting on page 81).
It’s our belief that numbers for both Walt Disney World and Universal Orlando are accurate. Again, the Themed Entertainment Association is the gold standard. Both Disney and Universal are top-tier sponsors of TEA and publicly celebrate annual accolades they receive from the organization. We strongly suspect that both Disney and Universal provide TEA with accurate annual attendance statistics. If you disagree, perhaps this post isn’t for you!
With that preface out of the way, here’s a look at the Top 25 Theme Parks Worldwide:
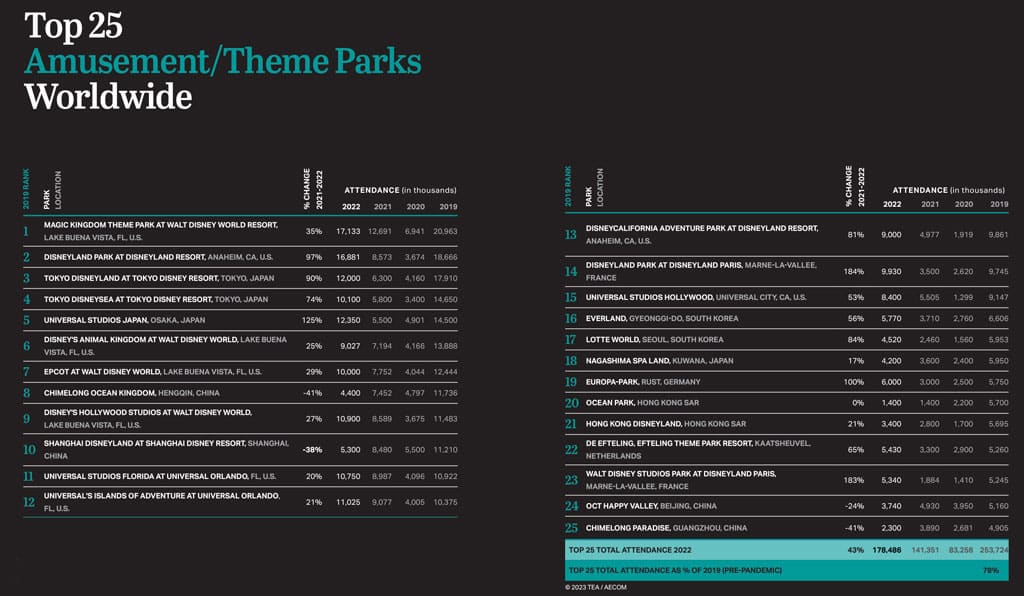
This shows huge rebounds for Disneyland in California, Tokyo Disneyland and DisneySea, and Universal Studios Japan. Conversely, theme parks in China did worse than in 2021. Almost all of this can be entirely explained by COVID closures and subsequent recoveries, which “differed” from Florida. This is already going to be a long post, so we’re not going to fixate on that, though.
Narrowing those numbers to North America, here’s the Top 20:
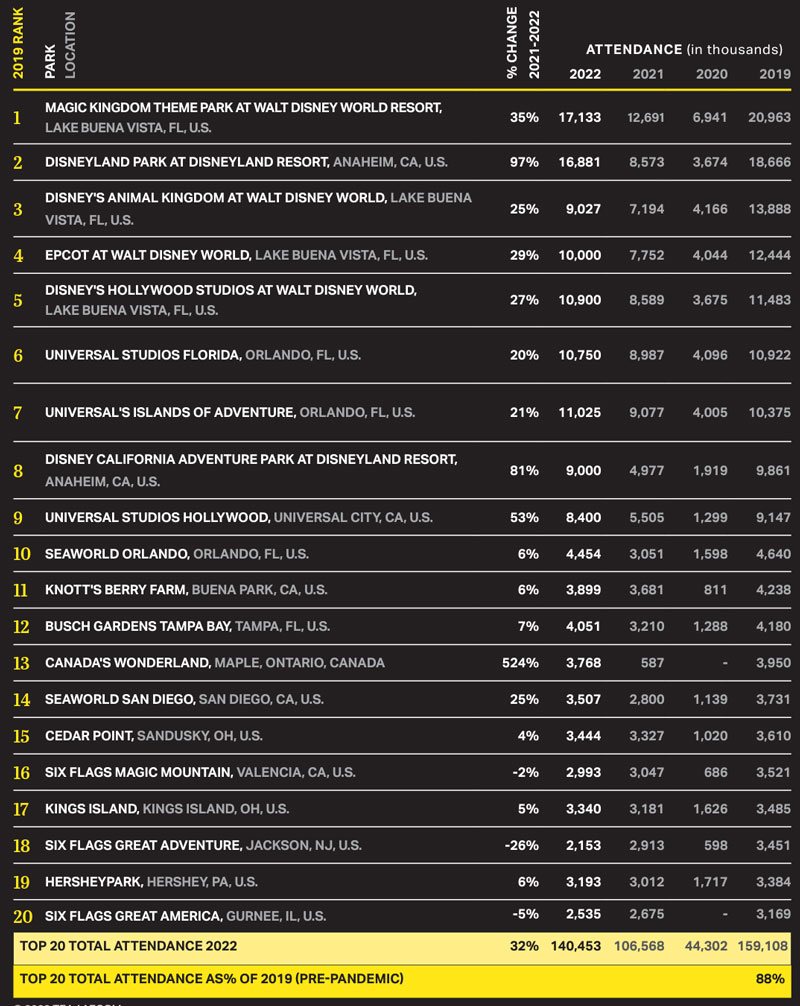
(Note that the rankings above are still ordered by 2019 attendance–look to the right to see 2022 numbers.)
For those strictly interested in Central Florida, here are the attendance numbers and rankings, re-ordered for 2022:
- Magic Kingdom: 17.1 million
- Islands of Adventure: 11 million
- Hollywood Studios: 10.9 million
- Universal Studios Florida: 10.75 million
- EPCOT: 10 million
- Animal Kingdom: 9 million
- SeaWorld Orlando: 4.4 million
- Busch Gardens Tampa: 4.1 million
Every single one of the Disney and Universal parks saw double-digit attendance growth as compared to 2020 or 2021. However, we’re not really concerned with the numbers from those two years. As anyone who follows this stuff knows, 2020-2021 were obvious anomalies with park closures and capacity constraints.
The report itself acknowledges that by retaining the 2019 numbers, and also pointing out that pent-up demand and a return (mostly) to normalcy last year makes the 2019 to 2022 comparison the more relevant one. So that will be our focus, too.
When comparing last year to 2022, attendance growth at Universal Orlando has outpaced Walt Disney World. This actually is not a huge surprise, and is a continuation of a trend first observed immediately after reopening. Universal Studios Florida and Islands of Adventure resumed operations earlier, scaled up faster, and restored normalcy sooner. Perhaps most crucially, Universal aggressively courted Floridians, whereas Disney very much did not.
We’ll circle back to those topics in the commentary, but the bottom line is that Universal’s attendance last year was more on par with 2019 than was the case with Walt Disney World. While Magic Kingdom remains the flagship theme park in the entire world, both Universal Orlando parks are narrowing the gap. In fact, Islands of Adventure saw explosive growth, jumping to the #2 spot (from #7 in 2019), while Universal Studios Florida gained from #6 to #4.

Meanwhile, only Disney’s Hollywood Studios outperformed the industry average with its 2022 attendance numbers as compared to 2019. Even as Magic Kingdom retained its crown, its drop as compared to 2019 was pronounced.
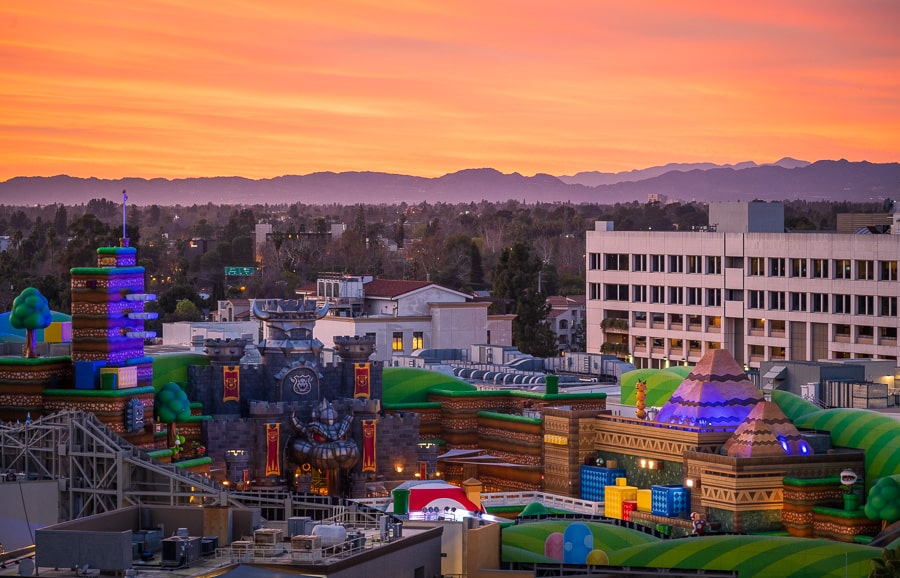
Animal Kingdom was even worse, barely maintaining an edge on Disney California Adventure and Universal Studios Hollywood (the latter will almost certainly surpass it this year thanks to Super Nintendo World). EPCOT remained surprisingly resilient despite the Giant Dirt Pit, but it did add Remy’s Ratatouille Adventure and Guardians of the Galaxy: Cosmic Rewind…and Harmonious, I guess.
Cutting to the chase, Walt Disney World’s overall attendance was down approximately 20% as compared to 2019. This is a below-average recovery for the industry as a whole in North America, which saw attendance at 88% of 2019 levels. By contrast, Universal Orlando’s two parks were up 2%, driven by tremendous gains at Islands of Adventure.
Consequently, Disney has lost market share in Central Florida. Once adding SeaWorld and Busch Gardens to the mix, Walt Disney World holds roughly 59% of the market–still a dominating number for its 4 parks, but down from 66%. Meanwhile, Universal Orlando is up from 24% to 29%.

Turning to commentary, we’ll attempt to answer the obvious question: what do these numbers mean?
“There are three kinds of lies: lies, damned lies, and statistics.” That is very much apt here, and underscores the point that you could draw a variety of conclusions from these numbers depending upon where your theme park allegiances lie. Some Disney diehards meet push the narrative that this was on purpose, whereas Universal acolytes might claim this means Disney is doomed. Two extremes, neither of which is grounded in reality.
More straightforward interpretation is easy for Universal fans, who can do a victory lap with a face value reading of the higher attendance stats. Islands of Adventure being the lone Central Florida park to surpass its 2019 visitor numbers is a very big deal, and Jurassic World VelociCoaster is the obvious explanation for that.
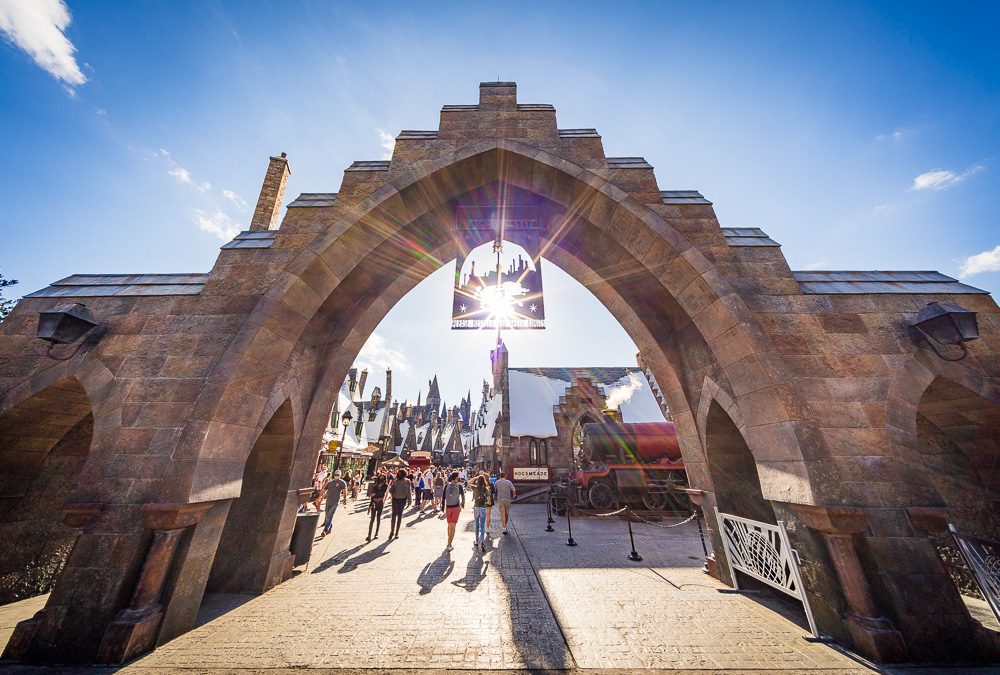
But it’s not the only one. There’s also Hagrid’s Magical Creatures Motorbike Adventure in the Wizarding World of Harry Potter. That may seem like old news now, but it opened halfway through 2019–meaning that last year was the first full normal year that its impact would’ve been felt.

In short, Islands of Adventure’s success is pretty simple: if you build it, they will come. Time and time again, the TEA numbers have borne this out. Animal Kingdom saw a similar explosion post-Pandora and Toy Story Land was big for Disney’s Hollywood Studios. Even last year’s numbers for EPCOT and DHS hint at how Star Wars: Rise of the Resistance and the EPCOT overhaul fueled growth that could’ve been more impressive in a normal environment.
Universal’s impressive post-reopening run is also reinforced by Comcast’s quarterly earnings reports. We don’t cover those here in granular detail, but the parks division there is doing blockbuster numbers in Central Florida and beyond. The success of those parks is a big deal and shouldn’t be minimized. There is literally no way to spin the TEA stats to make Universal look “bad” or like it’s underperforming. So, no lies detected there.
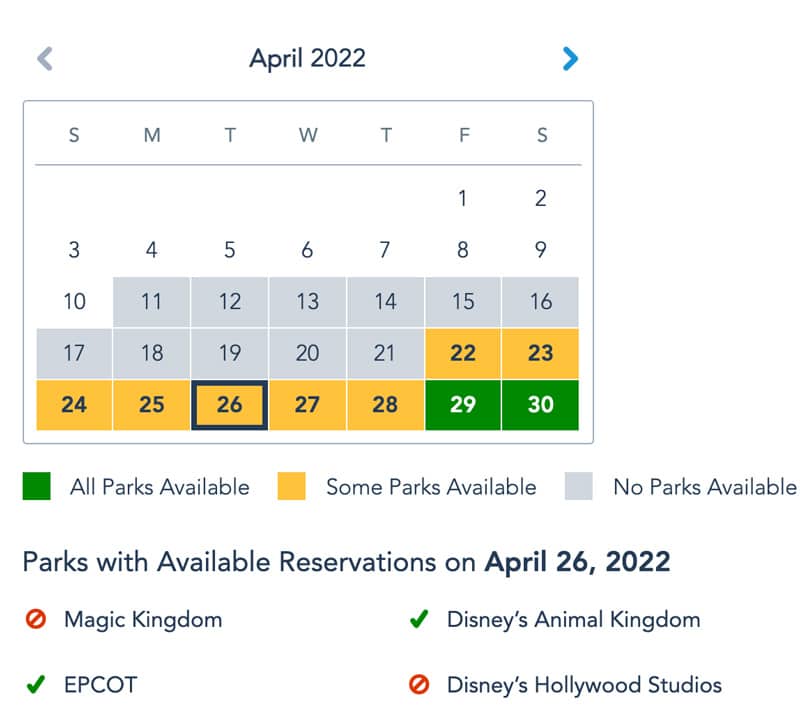
However, there are ways to interpret the results for Walt Disney World to make them look better or worse. Let’s start with the big one, which is that Walt Disney World was still operating with meaningful capacity constraints for a portion of last year. “Meaningful” is the operative word here, which is to say that there were dates where no park reservations were available at all; there were many more when only EPCOT or Animal Kingdom were options.
As discussed previously, the reason for this was mostly attributable to unintentional staffing shortages. (Although mask rules applied for the first couple months of the year, all attendance restrictions for the purposes of health safety were dropped by mid-2021.) For a portion of the year, Walt Disney World also attempted to manipulate attendance, pushing people to Animal Kingdom and EPCOT even when Magic Kingdom and DHS were not at or near capacity.

If you drink the Kool-Aid, you might also be inclined to believe that Walt Disney World reduced attendance on purpose. After all, executives routinely boosted about per guest spending being up 40% and touted their yield management strategy.
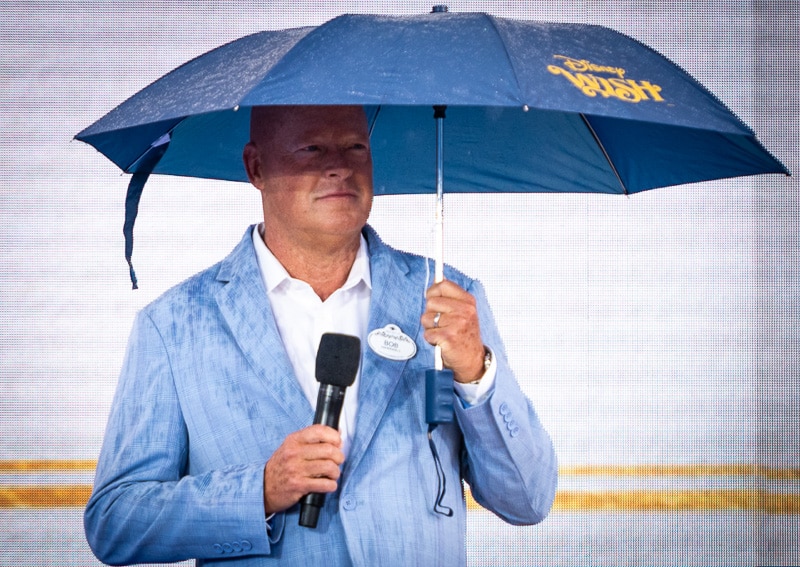
There are also a bunch of interviews with Josh D’Amaro and the dearly departed Bob Chapek where a narrative is advanced. During one infamous interview last fall, Chapek claimed that Disney “wants to guarantee a great guest experience no matter when people come…[so that] guests have a magical experience and memories that last a lifetime.”
Chapek routinely invoked fictional families from Seattle or Denver to defend the reservation system, claiming: “In a world where we don’t control demand, we’re left with one of two situations. You either let way too many people into the park, where they don’t have a great experience, or you manage it by turning people away at the gate.”
This all sounds well and good if you take it entirely at face value and don’t do any critical thinking. In Disney Doesn’t Want Lower Crowds, we do the opposite and scrutinize those assertions. The title of the post should give away our conclusion. If you visited Walt Disney World last year, there’s a strong chance your anecdotal experience with congestion and feels like crowds likely refutes those claims about “guaranteeing a great guest experience.” Disney largely retiring the reservation system in 2024 should be the final nail in the coffin on these claims.

Regardless of the reason, the bottom line is that Walt Disney World was not operating at 100% capacity for at least a portion of last year. There were dates when organic demand exceeded available reservations, and guests were turned away as a result. Consequently, attendance absolutely would have been higher at Walt Disney World if the parks were operated in the same manner as 2019 (or as Universal Orlando).
The degree to which that impacted Walt Disney World and artificially depressed attendance is beyond the scope of the TEA report and is debatable as a result. Our guess is that it had a notable impact on both Magic Kingdom and Disney’s Hollywood Studios, but not EPCOT or Animal Kingdom. Probably not enough to totally eliminate Universal’s market share gain, but to erode it to some degree.
Another undeniably significant factor is Annual Passes. Universal Orlando has gotten aggressive in courting locals over the last few years, an approach that’s evident via promotions, special events, and its Annual Pass program. Although beyond the scope of the TEA numbers, it’s safe to say that Universal outpaced Disney when it came to Annual Pass numbers.
This is an easy conclusion to draw since Walt Disney World suspended sales of most AP tiers for the entirety of last year. This not only would’ve impacted visitation numbers among locals, but likely would’ve pushed a non-trivial number of Floridians to Universal. Obviously, to those only concerned with raw attendance, this is meaningless. The numbers are the numbers.

However, there is more to it than that. As Walt Disney World’s also now dearly departed CFO Christine McCarthy let slip on an earnings call, a higher percentage of Annual Passholders is an “undesirable” guest mix. This is because, on average, APs spend less per visit than tourists. (Without a doubt, this is true–don’t take it as a personal affront and don’t use your personal spending in an attempt to refute this.)
Beyond that, as we’ve pointed out time and time again, Walt Disney World has become a hotel and timeshare business that also operates theme parks. This is to say that resort occupancy is of paramount importance, and Walt Disney World performed incredibly well in that regard. Not only was occupancy high, but it reached those levels with limited discounting. There were also numerous dates when hotels and/or room categories were entirely sold out, suggesting that there was unsatisfied demand and numbers would’ve been higher than there been supply.
The bottom line is that the TEA numbers from last year are undeniably good for Universal Orlando. With its own increased supply of hotel inventory, this is a positive–and important with Epic Universe opening in a couple years.
For Walt Disney World, the stats are much more inconclusive. While we think there has been a lot of spin by Disney about its goals and justifications for the parks, only some of that is bogus. What’s undeniable is that attendance would have been higher with better staffing, Annual Passes, and fewer constraints. It’s also clear that Disney did really well with metrics that matter to the company–per caps and occupancy.
Looking forward, it’ll be incredibly interesting to see how these numbers change for 2023. Thus far this year, wait time data is trending downward for both theme park complexes. It’s becoming increasingly clear that pent-up demand among domestic visitors has been exhausted. Disney executives have proactively warned of a slowdown, attributing this to lapping Walt Disney World’s 50th Anniversary celebration.
The wildcard for Walt Disney World is capacity constraints. Even with wait times down for much of this year thus far, there are a lot of ways that the parks have improved efficiency, which could be contributing to that. Personally, I’m highly skeptical that all of that’s enough to offset the decreases in ‘feels like’ crowds that we’ve observed and wait time data.
My take is that the lack of pent-up demand is the difference-maker, but who knows. As a result, I’d expect 2023 attendance to be down slightly. That’s just my personal perception, and could be wrong–2023 numbers might still see incremental increases for Walt Disney World. It’s really difficult to assess the impact of capacity constraints on crowds and wait times, so attendance growth is not beyond the realms of possibility.
I don’t recall hearing Comcast leadership speak to reduced revenge travel, but the same is also apparent there. An added wrinkle for Universal is the potential that, after a few years with APs there, some locals could be ‘rotating’ back to Walt Disney World now that APs are available there. So we could see a scenario where Walt Disney World claws back attendance market share even while remaining below its own 2019 high water marks. (I’d bet on this.)
That’s a lot of inconclusive analysis…so are there any definitive conclusions that we can draw? The most interesting aspect of these numbers for me is the ‘downfall’ of Animal Kingdom. This is not a park that had any meaningful capacity constraints at any point last year. Its numbers might’ve suffered a tad due to all of the aforementioned factors, but nothing major.
The stats don’t speak to this, but the situation at Animal Kingdom is likely worse than it appears. Animal Kingdom no longer has a nighttime spectacular, and if observed crowd levels and wait times are any indication, it is doing a far worse job at keeping people in the park late than was the case in 2019. This in turn contributed to increased crowding at Magic Kingdom and EPCOT in the evenings (this probably is not reflected in the numbers, which should use a “first click” methodology to account for attendance).
![]()
We’ve mentioned this repeatedly in posts about expansion, but this reinforces the reality that Animal Kingdom is the park with the most urgent need for additions. The post-Pandora bump is officially over, and there’s a good chance that Disney’s Hollywood Studios and EPCOT are going to start cannibalizing Animal Kingdom attendance this year and in 2024. (Our guess: Animal Kingdom is the biggest underperformer of Walt Disney World’s parks in 2023 and 2024.)
After seeing the dismal growth for DAK last year, I’m honestly surprised that Disney isn’t acting with a greater sense of urgency. Keep in mind that these numbers are not “news” to Walt Disney World–they would’ve seen these trends emerge over 12 months ago. That Moana and Zootopia tease at the D23 Expo should’ve been an official announcement, and construction should’ve started by now. (Absent the company’s debt and streaming woes, I’m guessing it would’ve.) Failing that, Walt Disney World management should be adding entertainment or doing something.

Looking forward, what’ll be most interesting to watch is what happens with Disney’s Hollywood Studios and EPCOT. These are the two parks with the biggest additions in the last few years. Keep in mind that both Star Wars: Galaxy’s Edge and Mickey & Minnie’s Runaway Railway would’ve been non-factors for 2019 attendance. (Even though Galaxy’s Edge debuted at the end of that summer, Rise of the Resistance didn’t debut until December–that’s when attendance really started to grow.)
Over at EPCOT, we already mentioned Remy’s Ratatouille Adventure, Guardians of the Galaxy: Cosmic Rewind, and Harmonious. Interestingly, none of these things for either EPCOT or DHS really had the kind of appreciable impact on attendance that would’ve been expected in normal times. But these were not normal times. Disney’s Hollywood Studios had the most restrictive capacity constraints, and EPCOT had the Giant Dirt Pit. Accordingly, our expectation is that DHS sees the biggest outperformance in 2023, with EPCOT seeing growth in 2024.
Beyond that, there are the other non-attendance metrics that matter to Walt Disney World. Per guest spending will absolutely start showing drops due to more Annual Passes and increased discounting on resorts, merchandise, and dining. Genie+ and other price increases could partially offset that, but there’s also the elimination of parking fees and other little things. In short, Walt Disney World is “losing” in the metrics that matter most to it even if attendance or market share does improve.

Ultimately, it’ll be an interesting few years to watch attendance (and other) numbers in Central Florida. Although it hasn’t been apparent during this period of pent-up demand, consumers benefit from increased competition. That should start to become more obvious next year and beyond, especially with more hotel inventory throughout the Orlando area (and at Universal, in particular). Obviously, the biggest thing on the “increased competition” horizon is Epic Universe. That new Universal park could amplify emerging trends, and is definitely a positive for guests.
More than anything else, though, the key takeaway from the TEA attendance numbers–and this is something dating back to around 2010–is that building new lands and adding attractions is the surest path to success. Islands of Adventure once again vindicated this approach, and as the park most removed from big expansion, so too did Animal Kingdom. Between all of this and increased bullishness on theme parks by Wall Street, it should be fairly obvious why Bob Iger plans to invest $17 billion in Walt Disney World over the next decade. Suffice to say, 2025 to 2035 should be a great time to be a fan of Orlando theme parks!
Planning a Walt Disney World trip? Learn about hotels on our Walt Disney World Hotels Reviews page. For where to eat, read our Walt Disney World Restaurant Reviews. To save money on tickets or determine which type to buy, read our Tips for Saving Money on Walt Disney World Tickets post. Our What to Pack for Disney Trips post takes a unique look at clever items to take. For what to do and when to do it, our Walt Disney World Ride Guides will help. For comprehensive advice, the best place to start is our Walt Disney World Trip Planning Guide for everything you need to know!
Your Thoughts
What do you think of the TEA Global Attractions Attendance Report? Thoughts on the results for Universal Orlando or Walt Disney World? Any color commentary of your own to add? Do you agree or disagree with our assessments and forward-looking predictions? Any questions we can help you answer? Hearing your feedback—even when you disagree with us—is both interesting to us and helpful to other readers, so please share your thoughts below in the comments!


Our 2019 Disney trip we had 6 days of park tickets and never once went to Animal Kingdom. Just not enough interesting things there for our family.
We just got back from our first post-Covid Orlando trip. Spent three days at Riviera Resort, no parks. Loved Riviera. Then we spent three days at Universal as we had never been. If it wasn’t for Harry Potter, there is very little there for our family. Minions and Jurassic are nice, but doubtful we would have gone just for them. However, we wanted to experience the Wizarding World and all of Universal before visiting Disney parks again.
Who knows when we’ll go back for parks. I don’t like all the Disney park changes with pricing. With Epic Universe coming, our next trip back to Orlando possibly could be Universal again. Doubtful we’ll have a long term shift from Disney to Universal though.
The Disney resort experience for us was definitely superior to Universal. We stayed at Royal Pacific. Nice, but it is no Polynesian that is for sure. I would be happy to continue vacationing at Disney without going to the parks. The resorts are great, DVC villas are family friendly, and there are so many dining choices on Disney property that you can’t possibly do it all in one trip.
You sound like us. While we visit all of the parks each trip, there are no “must do” attractions. We’ve done them all, many times. We kick back and relax, seldom staying in the parks past early afternoon. There are great restaurants on property where we know many of the long term staff and that makes it even better. We refuse to be forced to schedule attractions or to plan our days in detail before we even get to the parks. That, to us, is not a vacation. If we have to run around like maniacs trying to maximize every minute of waking time it’s more like being a hamster on an exercise wheel. We have never paid for Genie anything and aren’t about to start now!
I’ve been going to Disney at least once a year since 2015 (except during the COVID shutdown) and was just there in May ‘23…. On the third day, my kiddo, who’s 9, said, “Mom, why can’t we just go to Universal next time?”
Not because he’s leaving the “kid years” but because of the experience:
1) Broken rides: 5 rides broke down while we were on them; had to be evacuated from 1; after standing in line for over an hour, you’d think a free lightening lane might help? Nope. Not offered except for the one we were evacuated from.
2) Trash: The line for Toy Story (example) was filthy- floor covered in sticky mess, cups everywhere, and a discarded chicken bone- yes, chicken. It was like that ALL day. Honestly gross.
3) Genie: Where do I begin? Getting up at 7, paying huge amounts per ride like a fair? Just charge me what you need to charge me in the ticket price- why all the a la carte? It’s more than frustrating.
I love Disney. Avid fan. But this past trip honestly felt like I was being nickel and dimed, with no care for the experience. Makes me sad, but I can see why Universal is gaining market share. We have had a much better time every time we have gone in the last few years. For the price, we could visit Universal multiple times per year for every one trip to Disney.
There’s one number there that really stands out even though it isn’t Disney/Orlando related. How about the number for Six Flags Great Adventure? The story of the mismanagement going on there is pretty remarkable.
If your reasoning for universal islands growing past 2019 levels is it opened one ride (at 90million) ,then why is epcot substantially down compared to 2019 after opening 2 rides well over 500m ?
Because the front half of EPCOT is a veritable construction zone, and one of the park’s biggest demos (Annual Passholders) couldn’t buy new APs for the entire year.
The most shocking thing to me about this is that crowds are down from 2019–it certainly didn’t feel that way last time I was there! I wonder if the various things they have gotten rid of (street performers, etc.) made a bigger dent in the lines than I realized.
Closed venues, missing entertainment, and restaurants not filling every table are the big ones. Another factor that’s underappreciated is shorter hours most days–that means more guests concentrated into less time, instead of spread out more.
Good points Tom!
There are simple fixes for the low DAK attendance. First, add concerts similar to the various EPCOT music festivals. Tie into the American Idol show on ABC and have the fan favorites perform. Disney could either convert the lagoon arena area or use the Finding Nemo building. Create a drone based nighttime music/light show. Add coasters, and thrill rides. There are so many animal centric movies that Disney could connect to rides at DAK. Jungle Book, Zootopia, The Rescuers, Tarzan, etc.
Great idea! A drone show would look awesome in AK! They could work up something organic-looking and suitable for the AK vibe. They’re already doing a drone show in Disneyland Paris, so that’s not much of a stretch.
My 13 year old son has gotten really into thrill rides the last few years, so I’ve been to more amusement parks in the last few years than the rest of my life combined (outside of WDW). And what I’ve noticed is this: Nobody else has dark rides. Roller coasters are cheap and easy. Dark rides are hard. Disney stays a step ahead by adding rides that the whole family can do together, which means sometimes well-off grandma plans the trip for the whole family. I’m not opposed to another coaster in AK, but I don’t think they would be wise to focus on coasters, unless they want to set aside that one park and market it to teenagers. Although that would still be a problem because my wife and daughter wouldn’t want to go.
We recently went to Universal Hollywood (never been to Universal Orlando) and the Secret Life of Pets ride was an outstanding dark ride! It was Disney quality. I’m sure it cost more than a coaster, and I bet it keeps long lines for years. That’s how a park catches up to Disney. I think Dollywood and Sea World should start adding dark rides instead of more coasters.
On another note–the AK die hards simply do not understand why a lot of people dislike AK. I have just as much trouble understanding why they love it. Sure, when I go to my local zoo or even Busch Gardens Tampa, I think “AK is better” but when I compare it with any of the other 3 parks, it’s about half as interesting. Too much walking, not enough air conditioning, and not enough to do. And back in the days when we were pushing a stroller, with a full coke with no lid or straw in the cup holder, we hated those textured walkways. The whole “wander around a look at the animals at a leisurely pace” aspect only works if you have no regard for all of the people around you who are waiting for you to get out of the way. It’s a park that seems to be designed to be enjoyed only when it’s mostly empty.
Tom, when your kid is about 2, I bet you’ll find yourself avoiding AK. The stroller is awesome everywhere else. It’s awful in AK.
Hmmm, I’d not noticed that AK had any more walking than the other parks. Checking my Apple Watch from a visit to all of the parks earlier this month, I logged 7 miles at MK accompanying 3 80+ year-olds, 9.8 miles at EPCOT/AK, and 9 miles at HS, so not really that much of a difference. My family likes walking around and enjoying the atmosphere in general, and a day at a park isn’t any more strenuous than the weekend hiking we usually do. In fact, I’d prefer pushing a stroller to pushing around a tired and cranky 80+ year old, as the latter weighs 5x as much 🙂
I agree, Disney’s dark rides are something unique to be cherished, which is why Pandora opened with both a thrill ride and a dark ride. In fact, this dynamic has been present since the beginning. At Disneyland in the 1950s, Walt originally fought to keep all of the attractions family-friendly, as in his opinion thrill rides were more associated with low-quality carnivals. But the problem was, the same ride that thrilled a 6 year old was not something a 13-year-old wanted to go on for the 10th time. Eventually, Walt gave in, adding rides like the Matterhorn that would appeal to the now-teenage guests who were getting bored with the family rides, while still maintaining the excellent theming more consistent with a high-quality park.
As for AK, to each his own. We almost always spend a full day there and never can do everything. The one change I’d make to AK is to leave it open late so that guests could enjoy Pandora’s sights and sounds at night, which could be paired with a big show in the lagoon. Otherwise, we love how the park fully immerses its guests into a new environment, which includes the walkways. The self-guided animals tours for us are the highlight of the park, and it’s capable of handling a large number of guests, some walking through everything quickly and some taking their time.
Michael, thanks for your thoughts. When I say I don’t understand why people love AK–I’d really like to. I want to enjoy AK as much as the other parks, so I’m always glad to hear its praises sung by others.
Over the years we’ve usually gone in Oct or Nov, and AK somehow always seems 10 degrees hotter than whatever park we were at the day before, and the general consensus is it is because of all of the plants and narrow walkways that block the breeze. I like the animal trails but I do struggle to slow down and enjoy them when I think of how I could be spending my time in another park. As far as my “more walking” comment, I guess I’m mostly thinking it’s very hard to do anything but a loop in AK. Going back to pandora when it’s time for your fastpass (I will call them this forever) is painful if you’re on the other side of the park and jumping from ride to ride isn’t really practical. I feel like there is just so much more space between each attraction than at the other parks, and even getting to them through the hub is difficult. And then a lot of them are either outdoor shows, or indoor shows with outdoor lines. Even Nemo makes you wait outside until 15min prior. In the MK, even when it’s raining we find it’s not too hard to stay inside most of the day, skipping from one indoor line to the next. In AK that just isn’t the case. Even their most popular quick service restaurant makes you eat outside.
Overall I think they would fix it best by making it a little less authentic and a little more like the other parks–wide, flat walkways and lots more rides with indoor lines. It doesn’t necessarily need more headliners–it needs more C and D ticket rides. Although I’d say that about all of the parks.
As for your comments on dark rides, you are spot on. No arguments here.
Next to a certain part of Saratoga Springs, our favorite time in AK is waking up to coffee and a Savanah view from a high balcony in Jambo. The serenity, peace and quiet is a welcome contrast to the themed chaos of other resorts and the daily mayhem of some places in the parks!
Ah, yes I can understand how AK Lodge would raise your appreciation for the park. I’ve never been willing to pony up the money for it. We go hard core rope-drop to close, so we barely have time to enjoy our hotel. We’ve never even gotten into the pool–we have a YMCA nearby our home so we can swim there.
However, I do understand that I am a bit of an outlier when it comes to crowds. In my day to day life, we have a few acres and plenty of peace and quiet. My cubicle job could be in a library and I WFH often. So when I’m on vacation I’m happy to have lot of hustle and bustle. That said, we just went to DL for the first time and I found it too crowded because of the narrow walkways.
We’re older, have rural acreage for home base and love it and our own animals, which is probably why AK is our second favorite park. Our idea of going “fast and hard” at Disney is getting another cup of coffee while watching the grazing Savanah animals early in the morning. Sannaa is a favorite as well. Not only for the food, but there’s nothing like having a crested crane watching you eat! We studiously avoid rope drop, (Unless we’re with the kids and / or grandchildren and get dragged into it!) and do maybe do two or three attractions a day. Mostly we wander and seecwhatvwe can find. All time favorite tours are the backstage AK offerings. Having done every ride in Disney since it was a one gate free admission wonder, we’re now more into the dining scene. Inside AK our favorite is Yak and Yeti. BTW Tom, some years ago on your recommendation we tried STK in Springs, and the whole family loves the food. One of the best steaks in all the parks, and that includes Shula’s! Gotta wear earplugs tho. Can’t understand why such good food has to be accompanied by music that makes it impossible to have a conversation across the table!
Your statement about Disney being a hotel and timeshare business is correct. We say Universal is an amusement park while Disney feels like a resort.
It is the reason I like to do Universal first then Disney DVC as I find it more of a relaxing resort feel where we do some amusement parks Vs Universal it is all about the rides where we do a quick swim in the afternoon to cool off.
That said 1/2 the family would rather do Universal second due to Express pass. They say when you have jumped to the front of the line all day it’s hard to go to Disney and have 1 pass at a time, no repeat rides.
We go to Universal and hit it hard. We rope drop Disney then go, let’s just got back and hang at the pool, wait times are getting too long. And by pool, we like the quiet pool without the loud music, games, etc. that is the one thing I don’t like about so many of the resorts Disney built after BC and BW. Why not always have a quiet pool for those who want to relax. Would raise AK up so much to us if they had that.
I LOVE Disney World too, but it’s exhausting watching people try to ‘analyze’ how the situation there (along with the rest of the company) might not be a disaster. The truest (and most troubling) statement from your analysis is that that Disney World is now a time-share property that happens to operate theme parks. If you understand at all how the motivations change over time for developers of time-share properties you will understand what an un-manageable mess Disney has created for their flag-ship company asset.(I swear Disney World has to be worth more than half their market cap by itself…)
If there was an immediate buyer ready then Disney (the company itself) would have already been bought. The activist investors will return to this dumpster fire to extract some more cash/flesh and it will get worse. In all likelihood at some point in the next few years the theme parks are spun off or sold outright. My prayer is that at a minimum the North America theme parks and animation studio are kept together so some semblance of the original Disney can remain.
Disney World remains the most unique family entertainment resort ever imagined. Let’s hope whoever ends up owning it loves it again like it deserves…
Tom, I totally agree with everything … but I was wondering when you were going to make the connection to how Iger responded to these numbers when he saw (at least part of) them before the public did!
Ah, 2019, when Animal Kingdom was #2!
The “If you build it they will come” (love Field of Dreams!) argument is Disney’s only defence here. Very conservatively, Genie+ (and ILL) will be generating well over $120m per year which is why we have the “promised” spend from Iger. We need to see massive expansion at both Magic Kingdom and Animal Kingdom. MK is full of dated traditional attractions and Animal Kingdom needs more to keep visitors there longer. Universal recognise this so not only do they build, they build fast! The hotels already put so much pressure on crowds, the parks need updating and expanding. It’s no good replacing attractions (short term bump sure) but they have to build capacity. Animal Kingdom for example, just bang up a couple of Crush’s Coasters. It’s a cheap as chips off the shelf coaster in a show building. Plonk it on the awful Dinoland concrete slab and Bob’s your uncle! They’d need to 2 coz of its woeful capacity but it could be up and running in 6 months. Oh sorry, that’s if Universal built it. By 2030 for Disney. Point being, they now have the money from Genie+ so they need to spend it and quickly. Otherwise in 10 yrs they’ll be wondering why they are having to discount their massive hotel inventory just to sell tickets.
“It’s becoming increasingly clear that pent-up demand among domestic visitors has been exhausted.”
I believe this to be the most important fact. In my opinion, Disney has been lulled into a false sense of security by the tremendous numbers produced by pent up demand. As that fades, some of their bad decisions (elimination of: Magical Express, free magic bands, fast pass plus), as well as the added stress from Genie+ and having to be on your cell phone all day, are going to have a two fold effect.
First, they are going to lose a certain percentage of long time loyal fans who make repeated visits. These folks remember how good the Disney bubble used to be and some of them will be done with Disney. Especially those who fly in and stay onsite.
Second, a certain percentage of first time guests will be appalled at how complex and stressful Disney World has become, in addition to the nickle-and-diming you for everything. These folks will not become loyal, repeat guests.
Also, it appears Universal is catching up – and the addition of Epic Universe will accelerate this.
These fan losses likely won’t be very noticeable for several years, until the get large enough that Disney awakes to the fact that the Disney magic is gone for some of their most loyal (or potentially loyal) fans. They can’t survive forever on first time guests.
I hope I’m wrong, as my family has traveled to Disney World (from Seattle) 9 times over the years and have been big fans. But given their fan-unfriendly changes this past 18 months, we won’t be returning. Universal Orlando is our new family destination.
The big advantage Disney has is its vast catalog of franchises, movies, and characters. Even there, you could argue that Universal has closed the gap considerably with Harry Potter, Minions, and Nintendo. But there’s still a sizable lead.
I think many Walt Disney World fans take this for granted, as we are predominantly theme park fans and often appreciate good parks without regard for the underlying IP. That stuff really matters to a lot of average visitors, though.
We visited Universal last year. Party of 6. Enjoyed Harry Potter but, in general, to me it felt a lot like I was at a state or county fair. Crowded walkways flanked by attractions with few open, relaxing areas. Not overly impressed.
Appreciate this detailed comparison commentary. Notwithstanding the name of this blog & the fact that you do already sometimes blog about Universal, I wish you’d write more about Universal, especially all things Universal Epic Universe. We are out of state APs @ both parks. For years just WDW, then, when our twin boys hit about 9 nine years old (9) years ago, both. As the years passed, we noticed we were spending more & more time @ Universal. The IP for HP really mattered to them for years (and me!), and then just really innovative rides like Hagrid’s, Velocicoaster & Bourne Supremacy. Incredible Universal AP values like literally parking your own car free at Universal Citywalk valet 5 min from entrance to IOA, & free unlimited skip the lines after 4. We still love WDW, esp Epcot & DHS, but DAK has gotten to the point where we have totally skipped the park at 4 sep visits in the last year. Love K Safaris ALWAYS!! & FOP & Nomad Lounge, but every time I walk through Dinoland, I have an internal dialogue not conducive to a lovely vacation day. We still love Epcot festivals & Guardians is an awesome ride!! but TRON was a long coming, not creative, old IP disappointment. I just think Universal is more aggressive, creative, competitive, and faster to market. Again, asking you to consider more space in this blog for Universal!
The great thing about Universal is that it’s so much easier to visit than Walt Disney World. Great for visiting, but bad for blogging.
In that regard, it’s a lot like Disneyland, which we also cover far less despite being in the parks at least once per week. There just isn’t a lot of fresh ground to cover and not as many updates are needed.
When Epic Universe opens, we’ll have comprehensive coverage–and also full updates on everything else. Between now and then, probably not a whole lot on the Universal front. I need to do some updates now that Minion Land is open, but I probably won’t have a chance to check that out until HHN.
Another thought is that your “if you guild it they will come” does seem true to me personally. Having just gotten back from Japan, we enjoyed the Disney parks a lot. But looking at the Fantasy Springs attractions moves that up from “we should visit again some day” to “we have to go back after that expansion is open”.
Oh, my goodness: the Chapek umbrella photo never gets old and your use of “dearly departed” for Chapek and McCarthy must forevermore be a permanent description. Bravo. (And I feel like there’s a Haunted Mansion meme in there somewhere.)
As for the park attendance issue, I think Animal Kingdom suffers not only from a lack of commitment to expansion but also from closing so early. It’s a bit chicken and egg (there’s not as many guests so you reduce the hours, but reducing the hours means guests don’t feel like they’re getting their money’s worth so they don’t spend the day there or park hop), but Pandora is gorgeous at night and guests can’t really experience that for very long (or nearly at all in the summer). I get that animal activity/visibility is impacted during the evening but why not shift other entertainment (Nemo, Lion King, etc.) more toward evening and promote the incredibly deep dining bench while a few new attractions come online? It’s an amazing park that just seems to be under-utilized and a little mismanaged.
“It’s a bit chicken and egg (there’s not as many guests so you reduce the hours, but reducing the hours means guests don’t feel like they’re getting their money’s worth so they don’t spend the day there or park hop)…”
This is 100% correct.
With that said, the argument could be made that Walt Disney World already recognizes this, and it’s why Animal Kingdom closes at 7 pm or 8 pm most days, instead of 5 pm. As it stands, Animal Kingdom is really only “busy” between 10 am and 4 pm most days.
If Disney further reduced Animal Kingdom’s operating hours, that would reignite the “half-day park” perception and further reduce attendance as the hours would signal to guests that the park isn’t worth full priced admission. The current hours kind of do that, but not nearly to the extent they could if hours were fully shaped by crowd patterns.
This!!! I say that all the time. I love AK and would love to spend hours there after dark. It’s breathtaking when it’s all lit up at night. I wish Disney would do an after-hours event there on occasion. I would sign up for that in a heartbeat!
“A hotel and timeshare business that also operates theme parks!” What an amazingly succinct way of describing what is, IMO, Disney’s main downfall! Interestingly enough, I just got done with a dive into the history of a huge abandoned old Hyatt resort just on the other side of I-4. Apparently Disney’s initial foray into hotel expansion helped kill it along with other properties along 192. Maybe, just maybe, given the state of DVC at this point, Disney should have stuck with emphasizing the parks.
Keep in mind that this is your perception of Disney’s “downfall” as a consumer and longtime visitor. As a business, this approach has been incredibly lucrative.
So lucrative, in fact, that Universal is using precisely this playbook in its expansion plans. They even built out the hotel capacity first!
At least from the history books I’ve read, the synergy between profitability and creativity is what enabled the parks to keep growing. In a way, its a reflection of the way Walt & Roy collaborated. Walt didn’t care about money per se, but he did care about having enough money to build whatever cool thing he was interested in at the moment.
As far as hotels specifically, my understanding is Disney wanted to build a hotel right when Disneyland was opened but they didn’t have the cash and so brought in outside investors.
I’ll be interested to see if a drop in Florida will correlate with an increase in California. As a TA, I can’t tell you how many of my clients refuse to go to Florida. Many have altered plans to visit CA instead. Unless people live in the Southeast and have easy access to FL, people are opting to go west. They can experience both Disney and Universal there (and Universal Hollywood already has Epic). If you live in NY, for example, what makes you choose FL over CA? Flights, rental cars, hotels are still an expense for either destination. Yes, there are more parks, but the politics of Florida are a huge turn off for those wanting to spend money but are more socially aware.
Travel to Florida, on the whole, is still booming–airport stats bear this out. I don’t doubt that some people are rethinking trips due to politics, but I’d be surprised if it’s statistically significant. Aside from geopolitical conflict, I can’t think of any examples of politics playing an outsized role in travel trends. People just don’t behave that way, on the whole.
With that said, California theme parks are definitely outperforming in 2023 as compared to Florida parks. Probably attributable to the following, among other things:
-Slower reopening
-Asia reopening (more inbound international tourists)
-Super Nintendo World
Yep. Who would want to go to sunny Florida and enter and exit places freely sans masks for the longest time, when you can go to California, get a car that reeks of MJ, have to step across homeless people and hypodermic needles on the sidewalk, and show a vax passport? (Are they still doing vax passports?)
I totally get where you are coming from. Why would ANYONE choose a place that values personal freedom over government inspired homelessness and covid authoritarianism.
I guess THATS why there are droves of Floridians and Texans moving to places like California, Chicago, and New York…. oh wait.
@Knuckle Dragger, The whole “California is a cesspit” sensationalism is so tired and stale.
Acting like an entire state is just homeless people and hypodermic needles when that’s really just a few struggling urban areas is laughable.
I split my time between NYC and Florida since 2021. I’m sure you’d characterize NYC the same way as you do California, but you’d be just as wrong.
Every state has its pros and cons. It’s absurd to act like California isn’t still an attractive place to live and vacation when the data shows you’re just incorrect.
Also, many places in CA never had a vaccine pass, and the few places that did removed them in March 2022. Not sure why you’d possibly think that’s still happening anywhere in the country.
This is very rare. I work in the industry as well. People rarely stand by their “I’m never going to [xx location] because of [xx politics]!” It’s similar to those who threaten to leave the country if the “other” party wins a major election. There are a few outliers that may stand by their words, but it’s very few, and in general just doesn’t happen. Probably because in reality, opposing views are EVERYWHERE, including in their own neighborhood and city.
To write off an entire state due to politics only deprives the party doing so of seeing and experiencing new places. There’s just too many amazing sights in this world to take that approach.
Ah, there always has to be one of these comments, doesnt there.
While probably not statistically significant to the whole total of attendance, Jill’s reports as a TA have mirrored my own recent experiences. With Florida now marked on several threat-watch lists as unsafe for travel, I had three coworkers I knew personally turn down an all-expenses paid trip to a conference in Orlando. If that does end up becoming a trend though(which I hope it doesn’t and I hope the situation there improves), it’ll be reflected on all the theme parks.
However, all that aside, after just doing a near back-to-back between Florida and California…I’d pick CA just for the weather alone. Florida is just so *brutal.*
I am curious if people are actually changing their trips from Florida to California because of politics or because, like Tom said, California is now fully open plus Universal Hollywood has Super Nintendo World? That’s why we are going to DL instead of WDW this year. My husband has never been to DL and is also a big Nintendo fan. Politics did not play into our vacation plans…if they had, we’d be headed back to WDW this year!
As a TA, yes, they are literally changing their trips. I’ve had some families fully cancel their WDW vacation. When packages opened up in May for 2024, a number of my waitlisted clients opted to hold off until DL releases their 2024 dates. ALL who changed or held off have advised me that they don’t want to travel to Florida. As stated, I haven’t seen this issue with clients who live in the southeast (Georgia, SC, NC), you know, ones that can drive easily to FL and have APs to WDW.
I sell travel for both Disney and Universal…I overwhelmingly sell more clients on Disney. Some will throw in a day at Universal or just do Disney. I have never once sold a whole trip to Universal without Disney but I have sold all Disney trips without even a mention of Universal. The initial draw is Disney…at least for my clientele. Of the families that have postponed or cancelled, Universal is only an optional add on for one family. So, what I am saying is that yes, there are absolutely lots of people refusing Florida and CHOOSING California and it has nothing to do with Universal Hollywood having Super Mario World. It is absolutely a political decision for more people than you know.
Tom, what do you think about a Skyliner expansion to AK and/or Coronado Springs/All Stars/Blizzard Beach areas to drum up attendance and increase efficiency and attendance to the AK area? We so love the AK — and Skyliner — but the way it’s in no-man’s land is tough. We LOVE AK at night, but it chops up our day to arrive at AK late afternoon just to try to do the safari and the Lion King show before they end for the day, plus grab a bite, and then try to soak up the atmosphere and do Everest and FOP before the end of the night. We’re not fans of rope dropping anymore, especially with the heat. If we could zip over on the Skyliner from Riviera, we’d be MUCH more likely to do a full/early day at AK.
I hope Zootopia/Moana/Pandora updates are announced soon and are huge themed areas with multiple attractions and meet and greets and interaction.
[We LOVE AK at night, but it chops up our day to arrive at AK late afternoon just to try to do the safari and the Lion King show before they end for the day, plus grab a bite, and then try to soak up the atmosphere and do Everest and FOP before the end of the night.]
This is off topic, but it’s a shame AK doesn’t stay open long enough to enjoy the bioluminensence in Pandora. I’ve seen pictures, but it would be great to experience it in person.
“Tom, what do you think about a Skyliner expansion to AK and/or Coronado Springs/All Stars/Blizzard Beach areas to drum up attendance and increase efficiency and attendance to the AK area?”
I’d love to know where these “rumors” originated, as they come up often, but I have never heard anything that suggests this is on the table.
I think it’s one of those things that makes sense in theory, but probably doesn’t pencil out quite as well, as it’d “require” raising rates on the All Stars and Coronado. As it stands, there’s a market for lower priced accommodations within each tier. (With that said, Coronado to AK probably does make sense as a Skyliner route…but not the rest of that.)
Michael you must find a way to experience it in person as it’s not just the sights but the nighttime sounds as well. It’s one of my favorite spots at Disney in the evening. I’m not even a huge fan of the movie but I’m blown away by Pandora.
My favorite park is DAK and love the skyliner idea
Thanks for doing your best to make sense of numbers where COVID has thrown a wrench into things. As a Disney fan, it’s hard not to wish for lower attendance so that our visits are more fun, but long-term higher attendance means more investments in the park.
Thankfully park attendance is not a zero-sum game. More people going to Universal does not mean fewer people going to WDW.
“Thankfully park attendance is not a zero-sum game. More people going to Universal does not mean fewer people going to WDW.”
Definitely true…up to a point. New parks, lands and attractions have to grow the overall pool of guests by a certain amount in order to be viable. They can’t just keep the number flat and shuffling around the winners and losers, or achieve minimal growth.
Thus far, big additions from WWoHP to Pandora to Toy Story Land have absolutely achieved growth targets. I suspect that’ll continue to be the case with SWGE, EPCOT’s overhaul, and Epic Universe. But I also would not expect to see the same level of growth in 2023-2033 that occurred in 2010-2020.
I’m a numbers guy, so I always find these reports interesting. It is always fascinating to me how much higher MK’s attendance figure is compared to the other 3 WDW parks, and even more so how much higher Disneyland is than DCA.
Animal Kingdom is only slightly edged out by MK as my favorite park (a daytime parade and nighttime spectacular give MK the win!). It always makes me sad to see it trail in the attendance numbers.
Same. As Disney fans, I think we tend to assume other people experience the parks the same way that we do. In reality, that is not the case. Last I knew, single-day tickets were (by far) the best-selling type; the “average” visitor is coming from off-site and spending a day at Magic Kingdom (or some other park) as part of a bigger picture visit to Florida.
Safe to say that’s not how most of us are doing Walt Disney World.
“The “average” visitor is coming from off-site and spending a day at Magic Kingdom (or some other park) as part of a bigger picture visit to Florida. Safe to say that’s not how most of us are doing Walt Disney World.”
We recently went to the Orlando area for a softball tournament. Our family decided to skip WDW/UOR, but many on kid’s team had never been and planned to go during an off-day. I was all “Did you get your dining reservation? Your park reservation? Have you figured out your touring plan?” I was greeted with blank stares. They planned to arrive around 10:30am, buy a ticket there, and then leave when they got tired. They didn’t even know the name of the park; I had to tell them to follow signs for Magic Kingdom, as they all thought they were going to the Disneyland Park. So, I think it’s fair to say that the DTB faithful are the minority of attendees.