
Calm Crowds Before Holiday Season Storm at Disney World
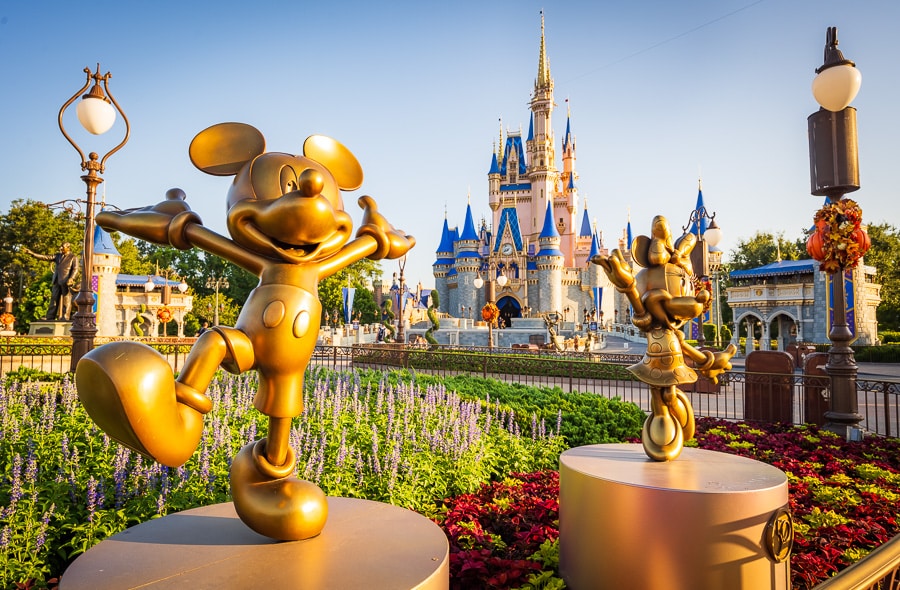
Halloween is over and Christmas season starts next week at Walt Disney World. The worst crowds of the year will soon arrive, but right now is the calm before the storm–the lull between holidays. This wait times report covers data for October and November 2023 (so far) at Magic Kingdom, EPCOT, Hollywood Studios, and Animal Kingdom, plus predictions for what to expect looking forward.
To quickly recap the last few months, August and September (minus the last week) largely marked a return to off-season crowd levels. Some fans who visit annually during this time of year reported “feels like” crowds that were higher than they expected. Nevertheless, it was still the best stretch of the year from the perspective of wait times, which were about 30-32 minutes across all of Walt Disney World, on average.
The beginning and end of October were relatively slow, but in between–Columbus Day and fall breaks–had Walt Disney World’s busiest week since Easter. The rest of the middle couple weeks of the month were likewise busy, but that’s to be expected. The bigger and more interesting story was those slower weeks, which were no worse than the August or September averages. This has now happened for a couple of consecutive years and are starting to seem like a return to how October used to be over a decade ago.
Before we get going, one thing we want to emphasize is that crowd levels are going to change over the course of the holiday season. It almost feels stupid to write that because of course crowd levels change. That’s the whole point! If wait times and attendance were static, there would be no need for posts like this.
In several regards, crowd reporting is a lot like weather forecasting. Do you all yell at the television when your local meteorologist says that it’s going to be hotter in the extended forecast than it was last week? (“What do you mean the temperature is going up?! It was just nice and cool. MAKE UP YOUR MIND, WEATHERMAN!”) Actually, don’t answer that. Maybe I don’t want to know.
Suffice to say, there have been more than a few Facebook comments in response to recent crowd reports that have been, essentially, “make up your mind–are crowds low or high?!” There’s a subtext to this sentiment suggesting we have some sort of agenda in wanting Walt Disney World attendance to be high or low. I don’t totally blame people for wondering this, as Disney crowds have (sadly) become a component of the culture wars. It’s very stupid, but true.
With the exception of wanting lower crowds when we are in the parks (for purely selfish reasons!), there’s no agenda here. Our view is that Walt Disney World attendance is what it is. No amount of us discussing the topic–which we think is an interesting one for a number of reasons (especially in a post-pent-up demand environment)–is going to change anything. Obviously, we’re not the arbiters of attendance statistics. Well, except in the sense that we all are given that we collectively choose when to visit (or not).

With that out of the way, let’s turn to the wait times data–starting with the usual asterisks. As always, this data is not conclusive of attendance or in-park congestion. Additionally, frame of reference is a major issue.
Walt Disney World attendance has increased by several million people over the course of the last decade-plus through 2019. Then attendance plummeted for a year-plus, spiked as a result of pent-up demand for 2 years, and is now coming back to reality. So your individual perception of crowds may vary considerably based on when you last visited.
There are also several other variables that can impact “feels like” crowds, including but not limited to festivals at EPCOT, weather, guest demographics, ride breakdowns, operational efficiency, wait times manipulation, and park operating hours. This is just a partial list, and all of those are significant variables right now.
In short, wait times are an imperfect measure of Walt Disney World’s raw attendance or crowds. Imperfect as they might be, wait times are still the best measure of crowds–and the only objective one. The alternative is relying on anecdotal observations, which are much more flawed and incomplete.
It’s impossible for anyone to be everywhere at once, and hard to know whether you’re in a pocket of crowds, what efficiency issues exist, and whether guests are disproportionately doing attractions or loitering about. Yada yada yada. See our 2023-2024 Walt Disney World Crowd Calendars for more disclaimers about the limitations, strengths, weaknesses, etc. of this type of post.
With that out of the way, let’s dig into the data and look at Walt Disney World wait times. As always, all graphs and stats are courtesy of Thrill-Data.com:

We’ll start with the monthly numbers for Walt Disney World as a whole. November is only slightly busier than the fall offseason…so far. Obviously, that will change.
As for October, it was busier than May, August or September–but that was to be expected. To our surprise, October ended up having slightly lower wait times than both June and July. If you were making predictions based on last year, that actually shouldn’t be a surprise, as October was the least-busy of that trio of months. But October being slower than summer is a relatively new trend…or the reemergence of an old trend, depending on how you look at it.

Here’s the weekly wait times data for Walt Disney World.
The highest yellow line there is Columbus Day and fall break, which was the busiest week since Easter. Wait times are down pretty significantly year-over-year as pent-up demand exhausts itself, but that week was still busy. In fact, don’t let the (light) green bars fool you. Those are mostly a result of tough comparisons, rather than low crowds in more absolute terms.
Nevertheless, wait times have dropped in the last couple of weeks.

We’re big on accountability here, so it is worth admitting that we missed the mark with crowd predictions. Our list of the 10 Best and 10 Worst Weeks to Visit Walt Disney World in 2023 to 2025 includes October 28 to November 11, 2023 on the ‘worst’ list. As you can see, Halloween week was not bad at all–it definitely did not deserve to be included on that list.
For our part, the commentary does say this: “Breaking it down a bit, the Halloween side of this usually is not as bad as people expect; by contrast, the Veterans Day end is typically much worse than expected. It’s advisable to avoid it all, if at all possible. We’ve been warning about Veterans Day crowds for years, as it has been almost on par with Thanksgiving some years.”
Halloween is never a truly busy holiday at Walt Disney World, but it was slower than normal this year. At least, as measured by wait times. In the next update to that best/worst list, I’m going to remove Halloween, but I’m still hesitant to actively endorse it, regardless of what the crowd levels might suggest. It’s often a popular holiday with locals (meaning congestion not reflected in wait times), especially when the weather is nice.

Above is a look at the daily numbers. Walt Disney World had been experiencing lower attendance following the Columbus Day/Indigenous Peoples’ Day holiday weekend and fall break. However, that’s past tense because crowd levels have been increasing from their lows for the last several days.
The parks still aren’t busy, but this is interesting (I think) because wait times have increased over the course of this weekend, which is not something we’ve been seeing this year outside of holiday weeks. In a normal year, this would easily be explained by the Wine & Dine Half Marathon, but even runDisney events haven’t been moving the needle as much on crowd levels this year.
It’s too early to say whether this is the start of a trend, but we’ve been expecting the slower Saturday and Sundays phenomenon to stop (or pause) during the holiday season. This is such a popular time of year with locals and diehard Walt Disney World fans that it seems improbable for weekends to continue being slower. Maybe that’s happening. Maybe it’s runDisney. Maybe it’s early-arriving crowds for the Veterans Day and Jersey Week holiday breaks. I guess we shall see!

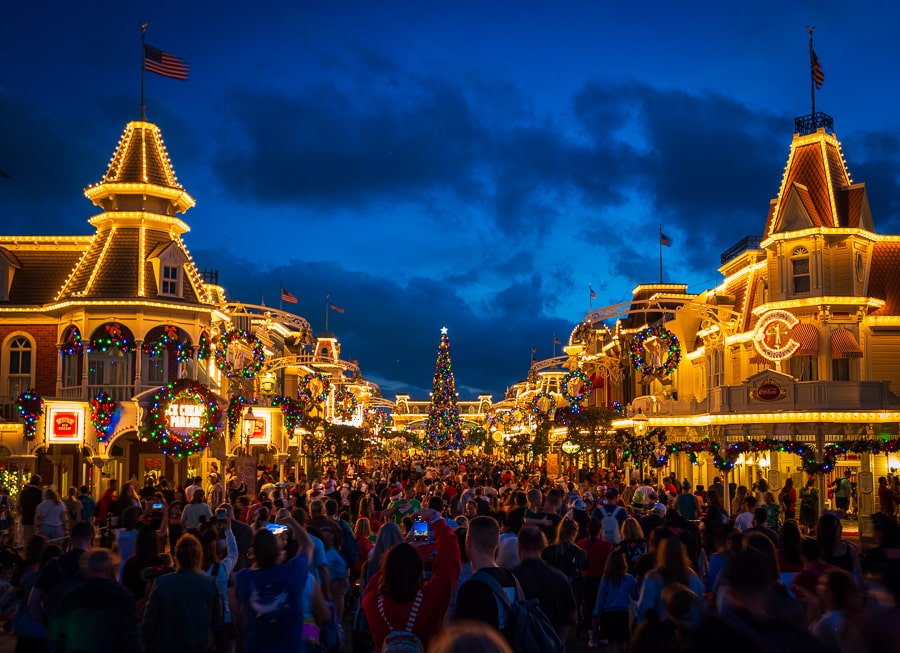
For park by park analysis, we’ll start with Magic Kingdom. Note a pause in the prickly porcupine impression for Party Season in the last few days, which is (very obviously) attributable to there being no events. Mickey’s Not So Scary Halloween Party ended and Mickey’s Very Merry Christmas Party doesn’t start for another few days. The way the earlier park closing time impacts crowd levels is something we’ve covered at length, again and again. (See Least Crowded Late 2023 Days at Magic Kingdom for dates that we recommend doing MK.)
November 1 was the slowest day at Magic Kingdom in a long, long time. The above perfectly explains why. It was a MNSSHP day with a 6pm closing and the next several days all had much later closing times. So many visitors made the very obvious and intuitive decision of skipping Magic Kingdom on that day in favor of one with a 10pm or later closing time.
Very soon, we’re going to see the “opposite” (kind of) of this happen. Party-shortened days that have crowd levels of 3/10 or 4/10 instead of 1/10. This is due to rising crowd levels across the board and fewer options to avoid MVMCP since it’ll occur on more days of the week. The “good” news is that the non-party days will get even worse, making the party days comparatively more attractive despite those higher crowd levels.

Above are the specific ride averages for Magic Kingdom for November 2023 month-to-date.
Only a few attractions with average wait times over an hour. That might seem bad, but a lot of waits on the lower end of the spectrum drag the average down pretty significantly. On days like this, Magic Kingdom is very manageable even without Lightning Lanes. Knock out Tomorrowland or Fantasyland during Early Entry, Adventureland and Frontierland at rope drop, and Seven Dwarfs Mine Train (etc.) right before park closing. Very doable!

Next up is Animal Kingdom.
Not much insight to offer here. Animal Kingdom wait times pretty much mirror Walt Disney World as a whole. It’s always worth pointing out that the park’s limited ride roster buckles whenever crowds are heavy, meaning that those wait times can spiral out of control if attendance keeps creeping up. It’s the park with the biggest range between lows and highs.

Here are Animal Kingdom ride averages for the month. Both Pandora attractions are eclipsing an hour, but that’s it. Still not terrible once you get past the top four attractions.
Kilimanjaro Safaris falls to #4, behind the Mickey & Minnie meet and greet. Again, this is an incredibly easy park with even a modicum of strategy beyond arriving late and leaving early. You might get tired of hearing us state (and restate!) this, but the vast majority of time, Genie+ is a complete waste of money at Animal Kingdom. (Sorry not sorry, but I won’t shut up about that–we’re a consumer resource, first and foremost!)
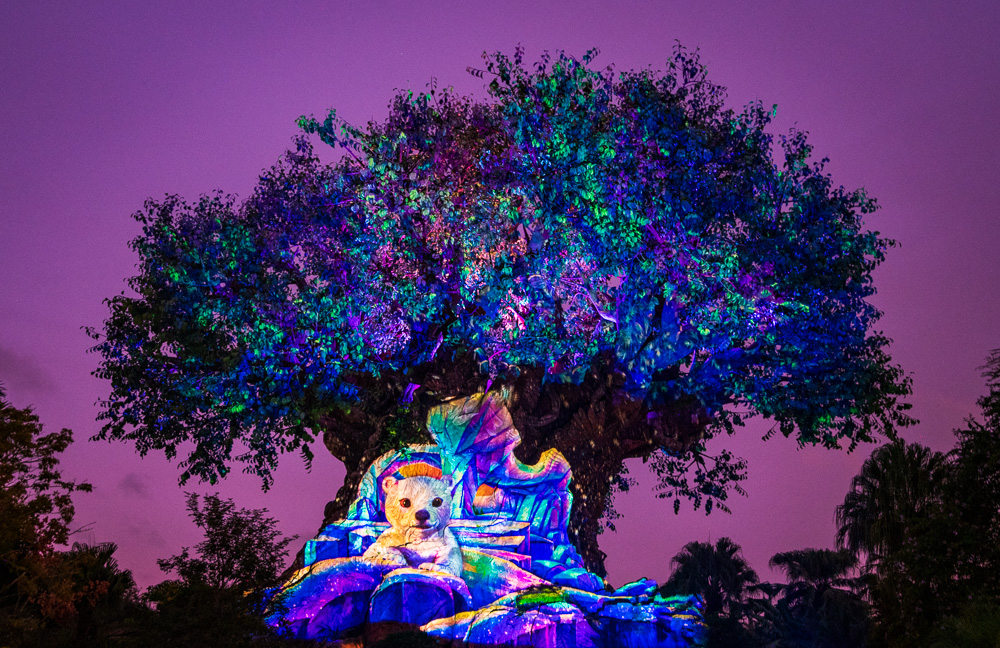
Another thing about which I won’t shut up: Animal Kingdom is underrated at night and now through the rest of the year, it’s officially open in evenings! (Daylight haters, it’s our time!) We highly recommend staying for evenings in DAK to enjoy the Tree of Life Awakenings, plus Pandora and the rest of the park after dark.
Our Animal Kingdom Afternoon Arrival Strategy is once again the ideal approach for this park. Alternatively, Early Entry or rope drop are great. Or, might we recommend Early Entry and rope drop followed by a refreshing midday break followed by evening in Animal Kingdom? Even skipping several hours, you can do the entire park–some rides more than once!

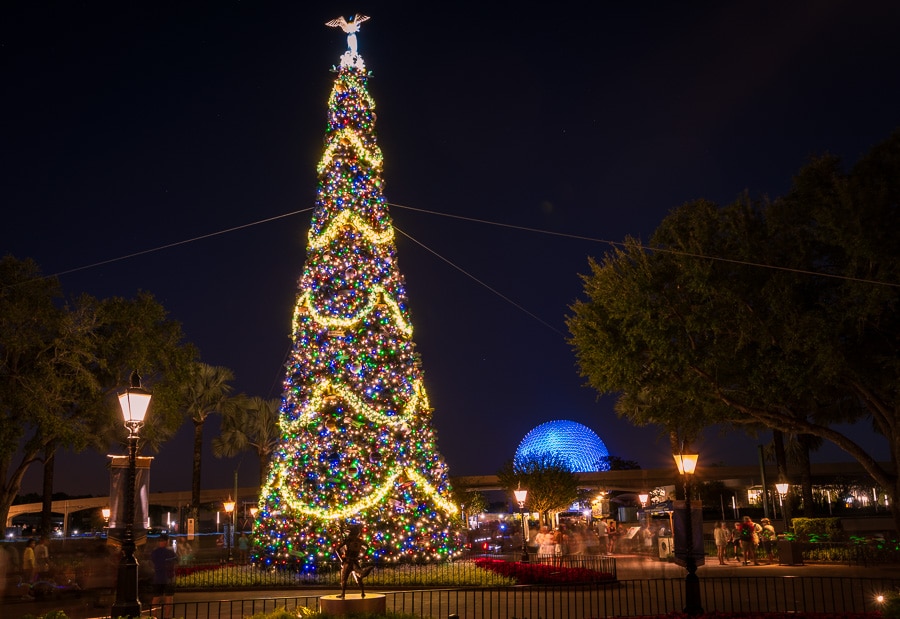
Honestly, I don’t even know why I include EPCOT in this anymore. EPCOT had some green lines; it had some yellow lines. How did those lines correspond with congestion levels? Your guess is as good as mine!
EPCOT is notorious for a divergence between “feels like” crowds/congestion and wait times, and this is only going to get worse next month with the end (?) of the Giant EPCOT Dirt Pit, debut of Luminous: Symphony of Us, and opening (?) of CommuniCore Hall. (Yes, we have question marks around two of those things, but all it’ll really take is Luminous for EPCOT to see larger crowds.)
World Showcase is also worse on weekends due to day drinking, while evenings are busier for people Park Hopping over to watch the fireworks. In short, people show up for things other than attractions, so that elevated attendance isn’t picked up by wait time data. We try to avoid EPCOT on weekends during this time of year, and that’s precisely why.

Average wait times for Frozen Ever After, Remy’s Ratatouille Adventure, and Test Track are all elevated. The new ride smell has already worn off Soarin’ Over California. (Guess people hate oranges?)
Actually, I’d expect demand for Soarin’ to bounce back in the next couple of months. Given the holiday season is a popular travel time for repeat Walt Disney World visitors, we wouldn’t be surprised if OG Soarin’ surpasses Test Track.

Finally, there’s Disney’s Hollywood Studios.
Not much to say about this–just like Animal Kingdom, the wait times at DHS more or less mirror Walt Disney World as a whole.

Above are ride-by-ride wait times for Disney’s Hollywood Studios this month.
These are the worst of any park, with 5 rides above 60 minutes. Note that this is not nearly as bad as last month, which had even more attractions that were at or above 80 minutes. Notably, not even Slinky Dog Dash or Star Wars: Rise of the Resistance are in triple-digit territory.

Turning to commentary, we don’t have a lot to add. Wait times data never tells the full story, and that’s undoubtedly true here, too. Unfortunately, this was the first month in a long time when we didn’t spend any time at Walt Disney World (for obvious reasons). As such, I don’t have any anecdotal or on-the-ground observations to share.
Really, there are only two reasons why I even opted to do a crowd report. First, because even I was surprised at the very low wait times data for October 28 to November 2, 2023. Even though Halloween is never a busy holiday, it’s not usually this slow. That’s newsworthy and also (potentially) justifies adjusting 2024 crowd calendars for those dates.
Second, because this is already starting to change and it’s happening over a weekend. Whether it’s due to runDisney or the early arrival of Jersey Week and Veterans’ Day holiday crowds (or a combination of the two) is impossible to say–but we should have a pretty good answer based on whether crowds increase or decrease on Monday and Tuesday. (If they go up, it’s due to the holiday; if they go down, the busy weekend was due to runDisney.)
Ultimately, the last couple of weeks have been the calm crowds before the holiday storm. November and December will almost certainly be the two busiest months of 2023, and that will start sometime this week–if it hasn’t already begun. Even with the lulls in each of those months–which includes Our Favorite Week of the Entire Year at Walt Disney World (During Christmas)–the high highs are enough to put November and December over the top.
As noted above, this week includes both Jersey Week and Veterans’ Day, and will be busy as a result. It’s really a question of whether the week starts out strong with high crowd levels even on Monday and Tuesday (my bet is that it does!) or gets progressively busier heading into the weekend.
Regardless of what happens this coming week, we’re hopeful that the following week (November 12-17, 2023) and the week after Thanksgiving (November 26 to December 2, 2023–you might even be able to expand that to November 25 to December 3) will see reprieves from the peak season crowds. Those dates along with a scattering of others in December shouldn’t be terrible.
After the second full week of December 2023, all bets are off. Crowds won’t let up in any consistent manner until after winter school breaks end in the second week of January 2024. If you’re wondering why Walt Disney World is rolling back so many policies on January 9, 2024 instead of New Year’s Day, that’s precisely why. That’s the next day of the off-season at Walt Disney World!
Planning a Walt Disney World trip? Learn about hotels on our Walt Disney World Hotels Reviews page. For where to eat, read our Walt Disney World Restaurant Reviews. To save money on tickets or determine which type to buy, read our Tips for Saving Money on Walt Disney World Tickets post. Our What to Pack for Disney Trips post takes a unique look at clever items to take. For what to do and when to do it, our Walt Disney World Ride Guides will help. For comprehensive advice, the best place to start is our Walt Disney World Trip Planning Guide for everything you need to know!
YOUR THOUGHTS
Thoughts on the Halloween and early November crowds at Walt Disney World? Predictions for the 2023 Christmas season? How bad do you expect crowds to get for the heart of the holiday season? Thoughts on our forecast, analysis, or anything else? Do you agree or disagree with anything in our report? Any questions we can help you answer? Hearing your feedback–even when you disagree with us–is both interesting to us and helpful to other readers, so please share your thoughts below in the comments!


We have a party of 15 arriving on 12/10 and we’re happy we will leave before the tsunami comes. I’ve tried to explain to my family that this will indeed be ‘more crowded than last year during Ian’…. but they’ll need to see for themselves. It’s hard when their only experience was during a hurricane with super low crowds.
My concern is that after WDW, we’re going to Universal for 5 nights… and this is all new for all of us. Wish us luck!
Nothing available in any resort Nov 9 to Nov 12.
The storm is here, and it’s Cat 4, minimum.
For what it’s worth, nothing has been available for several of those nights for months. (I’m sure availability has been up and down, like always, but the point stands.)
Between that and the midnight closings…it’ll be interesting to see just how bad it gets.
Somewhat anecdotal, somewhat data driven, and I’m sure you’re aware, but NJ week tends to overlaps with Halloween when it’s on a Saturday/Sunday (Halloween that is)…for reasons that I’m sure exist unbeknownst to me, the teachers convention (driving force for “NJ week”) that usually occurs the 2nd week of November occurs the 1st week of November those years. So once or twice, every 6-7 years, the crowds spread out between the first and second weeks of November (between Halloween/NJ week/Veterans Day. I’d imagine Halloween those years are worse than average.
Thanks for that!
Even though I’ve been covering Walt Disney World crowds for a while and know Jersey Week plays a big role, I still always have to look up when it’s happening (because I know it fluctuates slightly for whatever reason). That’s part of why I hedged on ‘potentially’ changing the crowd forecast for next year–because I haven’t done my due diligence on Jersey Week past and future (only present).
It’s still wild to me that one state has such an outsized impact on crowds (outside of the South–it makes complete sense when it’s Louisiana or Georgia), but it really does!
I was there for a long weekend last weekend. There were definitely times where it felt much more crowded but also we used a lot of zig while they zag strategies thanks to Tom that helped keep our lines super reasonable the whole trip. The fact that crowds were even lower than expected like Tom said, probably means those strategies were even more effective
(Daylight saving time fans, it’s our time!)
Fall marks the end of daylight saving, Tom. I’ve noticed this in a couple of articles recently. What you’re loving so much is actually standard time.
Now that I think about it, I’m pretty sure someone corrected me on this last year and I still managed to make the mistake this year. Maybe I can pretend that I like more daylight in summer, but enjoy early evenings in winter. In which case, I’d be a DST fan! 😉
Thanks for sharing your thoughts. I am curious to see what happens on weekends going forward particularly for HS. We’re planning on being at HS on a Saturday when we visit 12/9-16. If weekends crumble there, I need to change our strategy.
Saturday and Sunday have been reliable days of the week at DHS since reopening, and that included last year’s holiday season. I’d be really surprised if that changes, outside of like the Sunday before Thanksgiving (or other such examples when people are arriving for a holiday in the coming week).
Resort-wide, it’s possibly a different story.
I’m curious how the Florida Resident Weekday Magic tickets will impact weekdays vs. weekends during the holiday season. We’ll be there Thanksgiving Day through the following Monday, and I’m torn whether to go to the parks on Black Friday or wait until Saturday the 25th, since those Weekday Magic tickets would be blocked out then.
I have no special insights, but I like reading about the data and appreciate your analysis! I’m starting to think about a December 2024 trip, so I’m looking forward to seeing how this season shakes out.
I appreciate your insights and look forward to them everyday but I don’t understand what this one means:
(specifically the ‘component of the culture wars’.)
“reports that have been, essentially, “make up your mind–are crowds low or high?!” There’s a subtext to this sentiment suggesting we have some sort of agenda in wanting Walt Disney World attendance to be high or low. I don’t totally blame people for wondering this, as Disney crowds have (sadly) become a component of the culture wars. It’s very stupid, but true”
I would assume by “culture wars”, he means that those folks who are mad at Disney for political reasons are citing low crowds to support their theory that nobody is going to Disney anymore. Conversely, those who support Disney’s stated political positions cite high crowds as Disney is still doing very well. Perhaps, you have to spend a little time on social media to see this is a thing and it’s ridiculous. In any case, Disney crowds have always been Disney crowds and has only to do with times of year, special events, new attractions, school vacations, etc…
My family is going on 12/9. I wanted to high-tail it out of there by the 15th! I hope this turns out to be a good plan! Fingers crossed 🙂
Katie hit the nail on the head.
Thanks Katie and all!
Just cancelled our Nov 26th to Nov 30th, which I recently shortened from Nov 25th to Dec 3rd. We’ love WDW during the Christmas season but couldn’t do a week and then it made no sense to drive two days to spend 3 days and drive two days back. That will still be a good week. People are generally out shopping Black Friday and all that weekend or returning home after visiting relatives for Thanksgiving. Once I cancelled our resort, I called Disney who graciously allowed me to change my renewed AP to a New AP. You lose the 15% discount but you still have AP rights such as booking resorts at AP rates with the advantage that your year doesn’t start till you return. For us currently that’s next August. One caveat, I believe you must start your AP BEFORE checking into your hotel or you will revert to rack rates.
My son and I are going to WDW Nov. 11 – 17. We went for a last minute two day whirlwind trip last year during the same November week and it wasn’t so bad as crowds go. We have fingers crossed for the same “not so bad” crowds this year. This week long trip is to make up a canceled vacation from Spring of 2020 when the pandemic was just getting out of hand. We are super excited to have a whole week to spend no matter what the crowds are like! (But still hoping for manageable crowds ☺️).