
Early December Drop in Crowds at Disney World!
Attendance levels and wait times have dropped to start December 2022 at Walt Disney World, as predicted. This crowd report shares recent data, thoughts on what’s likely to happen next with attendance this week, and our experience with “feels like” crowds at Walt Disney World in the week-plus since Thanksgiving.
We always spend a lot of time in Walt Disney World the week after Thanksgiving, putting our money where our mouths are (I guess? We have APs so it’s not like we’re actually paying for each visit?) during our favorite week of the entire year at the parks. (See our Best & Worst Months to Visit Walt Disney World.) This year was no different, and it was (spoiler alert) great, as always.
Despite it being our top pick, that’s largely for qualitative reasons and not purely wait times. The first week of December is the best week of the month, but it’s during a season that sees higher attendance across the board. Early to mid-December is still significantly busier than the early fall off-season. The difference is that Walt Disney World doesn’t celebrate Christmas during mid-September (yet). With that said, I’ve been very pleasantly surprised by both wait times and congestion in the last week-plus at Walt Disney World.
As I type this opening, I can already anticipate the angry comments from Walt Disney World veterans who visited after Thanksgiving for the first time in several years and found the crowds to be far worse than “normal.” I want to start by addressing that, as this has been a common complaint every single time there’s a wait times report suggesting that crowds were below average. On that note, a few points.
First, what’s covered in these “crowd” reports is actually posted wait time data. These numbers are pulled from My Disney Experience constantly by Thrill-Data.com and compiled into graphs and all sorts of interesting charts. In short, the wait time data is the wait time data. It is not wrong. The numbers do not lie, but they also don’t necessarily tell the full story.
Second and perhaps most importantly, Walt Disney World attendance has surged by tens of millions of guests per year in the last decade-plus. Attendance at Magic Kingdom alone climbed from 16 million to nearly 21 million guests. Animal Kingdom did even better in percentage terms, jumping from 9.5 million to 14 million–with almost all of that coming post-Pandora World of Avatar.
Disney’s Hollywood Studios was to have its own coming-out party in 2020 with the completion of expansions, but that didn’t materialize for obvious reasons. Still, its attendance was up by 2 million from 2007 to 2019. EPCOT was just under that.
At the same time that attendance is significantly higher, regular park hours have been reduced by several hours per day–most notably at Magic Kingdom. (The big exceptions to this are at Animal Kingdom and World Showcase, both of which have longer hours now than their historical norms.)
There’s also less entertainment due to the stage shows and atmospheric acts that have been cut, as well as the loss of 3 different parades. This means more people are concentrated into fewer operating hours, effectively exacerbating ‘feels like’ crowds and wait times during those hours.
The end result is that virtually every single day of 2022 has higher wait times and is significantly more crowded than 2012. Similarly, 2022 is much busier than 2020 and 2021. (The second half of 2019 is a bit of an anomaly due to an unprecedented crowd dynamic with the staggered opening of Star Wars: Galaxy’s Edge.)
Numerical crowd calendar scores are calculated on a rolling basis, meaning a low day on the Walt Disney World crowd calendar is relative to other dates in the last year–not in 2012. (If the latter were used as the benchmark, crowd calendars would be 300+ days of 9/10 or 10/10 crowds!) In other words, a 1/10 today is not the same as a 1/10 in September 2012 or October 2015. Today’s 1/10 might be closer to a 5/10 from five years ago.
Moreover, crowd levels are also relative to their respective parks–meaning today’s 1/10 does not even mean the same average wait time at Magic Kingdom and Hollywood Studios. (This is because Magic Kingdom has a larger and more varied ride roster.) There is no universal standard for crowd levels; it is all relative.
Finally, wait times are not conclusive of in-park congestion. There are several other variables that can impact “feels like” crowds, from festivals at EPCOT to weather to guest demographics to ride breakdowns to operational efficiency to time of day or day of the week. And that’s just a partial list! Beyond that, wait times can be manipulated by Walt Disney World. They’re often inflated, or otherwise inaccurate. (Paradoxically, there’s usually consistency with this inaccuracy.)
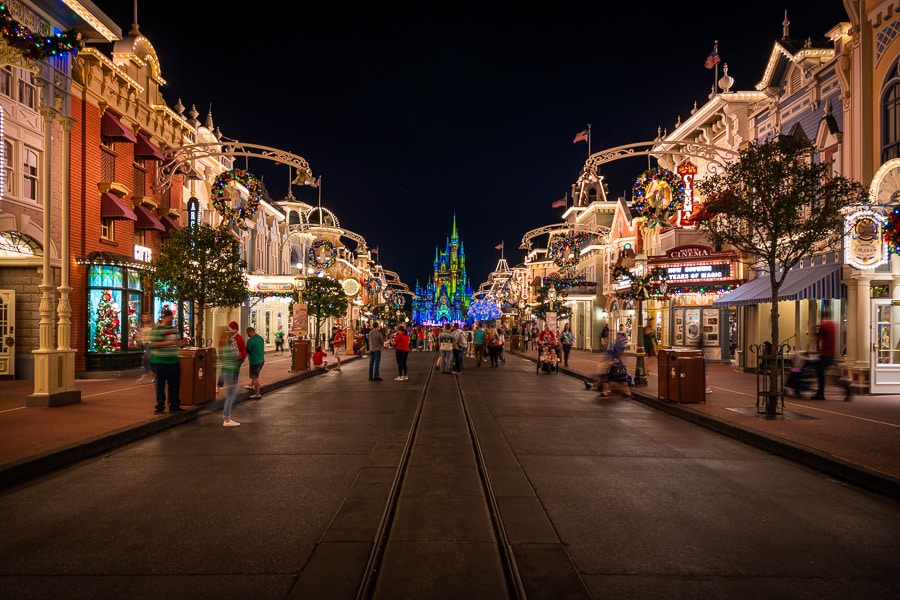
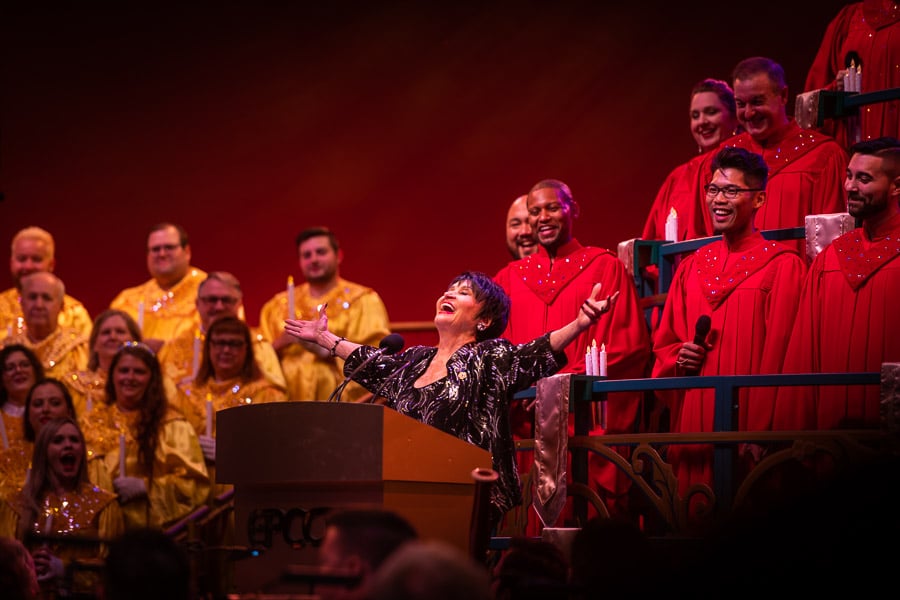
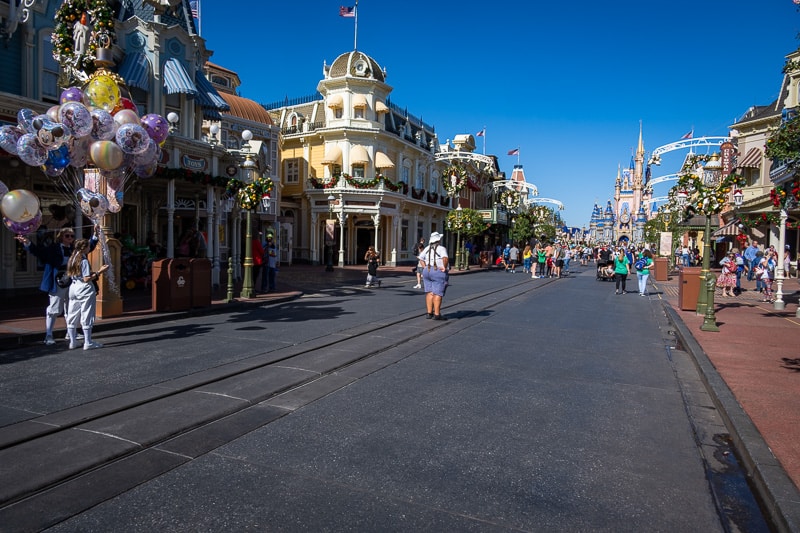
Seasonal events are another big one, and it’s currently the heart of the holidays at Walt Disney World. Christmas entertainment can make a big difference, especially if you spend an hour in line for Candlelight Processional or are trying to get a family Christmas card photo on Main Street at the end of the night in Magic Kingdom. (Thankfully, our beloved Merry Menagerie still flies under the radar!)
Point being, wait times are an imperfect measure of Walt Disney World’s raw attendance or crowds. They’re also one that is commonly “contradicted” by Walt Disney World fans who have been visiting for decades and contrast the current year to 5 or 10 years ago. That may be the comparison you want to use and, if so, crowd reports are of exactly 0 value to you. Your personal headline would always be “Crowds Increase for X Week or Month as Compared to 2012.”
For those who are interested in wait time reports or crowd calendars for current reference or determining when to plan future trips, they are still incredibly useful. This is especially true with park reservations being increasingly irrelevant and things starting to normalize at Walt Disney World. If anything, this type of post is the most useful they’ve been in the last ~3 years. (And I write this as someone who had included a preface on crowd calendars that they are not reliable ‘right now’ for the last several years.)
With that said, on-the-ground reader reports and comments about “feels like” crowds during recent trips, and how that differed from posted wait times, are valuable as supplemental color commentary. That’s particularly true when coming from those who visit regularly or during the same week every year. It helps manage others’ expectations and contextualize what things are like beyond the numbers. Of course, that’s not the same as saying the wait time data is wrong.
Anyway, enough with the rambling preface. I’ve shared similar sentiment repeatedly, but felt this was worth reiterating for new readers, first-timers, or longtime fans who have been away for a while. It’s important to understand how these posts work, what’s actually being measured, limitations, etc. With that out of the way, let’s dig into the data and look at Walt Disney World wait times. As always, all graphs and stats are courtesy of Thrill-Data.com:
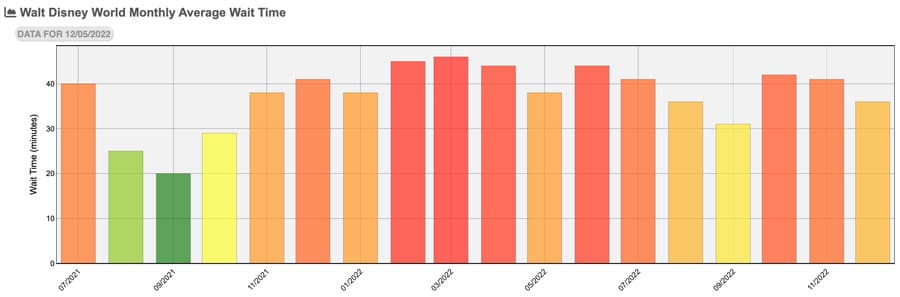
We’ll start with the monthly numbers for Walt Disney World as a whole. The far right bar is December 2022, which is currently below both October and November.
It’s still way higher than September, which ended up having the lowest wait times of the year by a wide margin. The green and yellow bars on the far left are August through October last year, but that’s a total anomaly– skewed by surging cancellations due to the Delta variant and reinstated mask rules. All things considered, December 2022 is looking really good thus far.
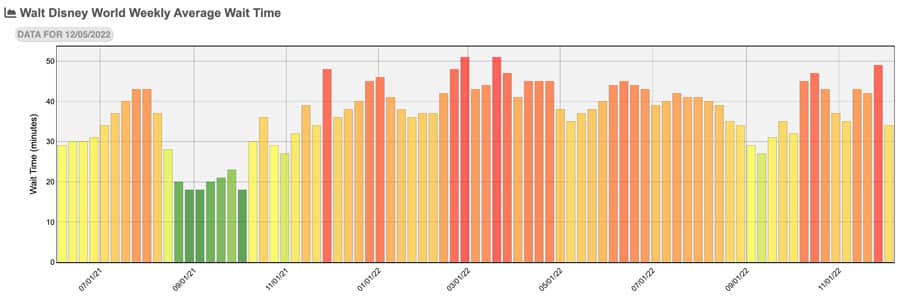
Moving to weekly wait times, it’s easier to see the peaks and valleys of the holiday season so far. Thanksgiving week (the tallest red line) is the third highest week of the year to date, behind only Presidents’ Day and the peak of spring break season.
The week-to-week drop is pretty pronounced. The week following Thanksgiving averaged a 34 minute wait time (3/10 on the crowd calendar), as compared to 49 minutes during the week of Thanksgiving (10/10 on the crowd calendar). That 15 minute difference may seem insignificant, but it’s actually huge–and really adds up over the course of a day.
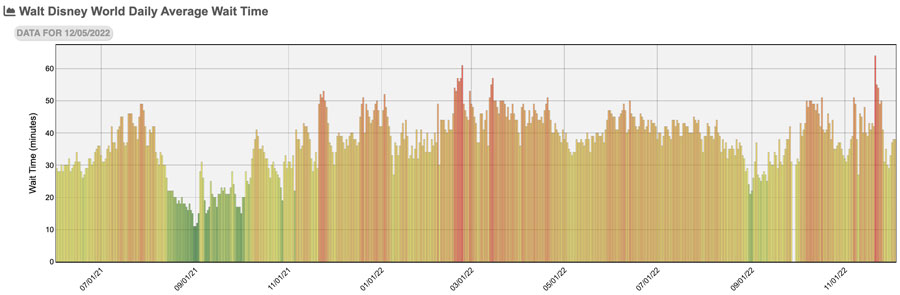
Breaking it down by day, we see an even more interesting dynamic emerge. Thanksgiving week wait times actually topped out on Monday (November 21), with every day after that decreasing on average. Those are still in the 9/10 to 10/10 range, they just look a lot lower because Monday wait times were so much higher. The scale caps out at 10/10, otherwise those dates would be well above the upper limit.
By the Saturday after Thanksgiving, crowd levels were back to 6/10. On that Sunday (November 27), wait time levels plummeted to 2/10. Since then, they’ve bounced back a bit, but have still yet to exceed 5/10 on the crowd calendar. Even by historical standards for the week after Thanksgiving, that’s really good.
So really, it’s not “just” early December wait times that are down–that would only be a few days worth of data points and would be premature to call it a trend. In actuality, we’re at nearly two weeks of crowd levels trending downward–and a full week of downright low crowd levels per wait time data.
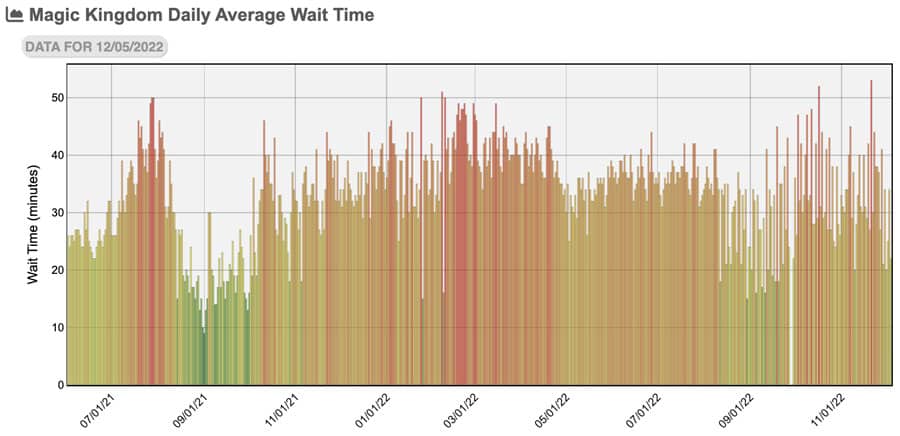
Breaking this down by park, where we’ll start with Magic Kingdom.
Magic Kingdom continues its porcupine impression, which has been the case ever since party season started in August. As always, this is due to Mickey’s Very Merry Christmas Party, which really disrupts attendance patterns at Magic Kingdom. This is something we’ve covered at length, again and again. Thus far, most days of MVMCP at Magic Kingdom have been below 3/10 on the crowd calendar. All December 2022 dates have been 1/10 or 2/10.
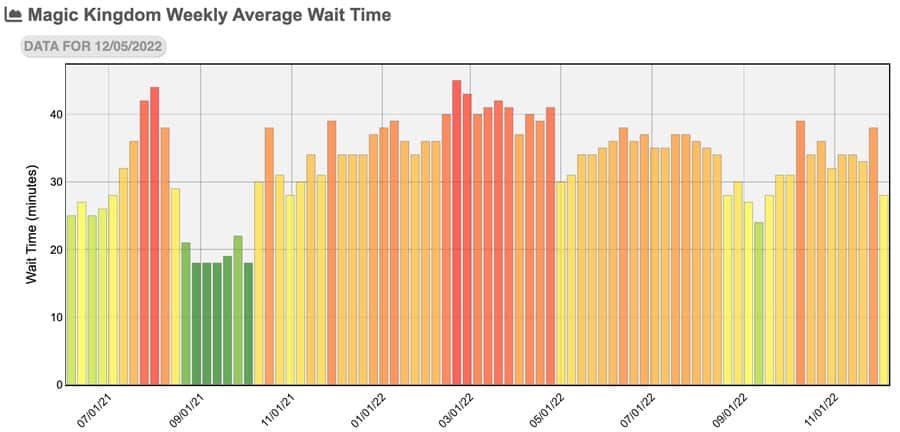
That roller coaster graph isn’t easy to read, so let’s take a look at weekly wait times, which smooth out the MVMCP v. non-party days.
From this, we can see Magic Kingdom drop from 8/10 during Thanksgiving week to 2/10 in the past week. I’m actually surprised the most popular park was only 8/10 during the peak holiday window. A couple of the other parks being off the charts is what lifted the overall average.
I can’t really explain Magic Kingdom only being 8/10 the week of Thanksgiving. I have a couple of guesses, though. First, Walt Disney World limited Park Pass reservation availability to push attendance to other parks and normalize numbers (this definitely happened to some extent). Second, the lack of party dates that week helped Magic Kingdom better absorb crowds. Those are just my working theories–I’m open to alternative explanations, so feel free to share your ideas in the comments!
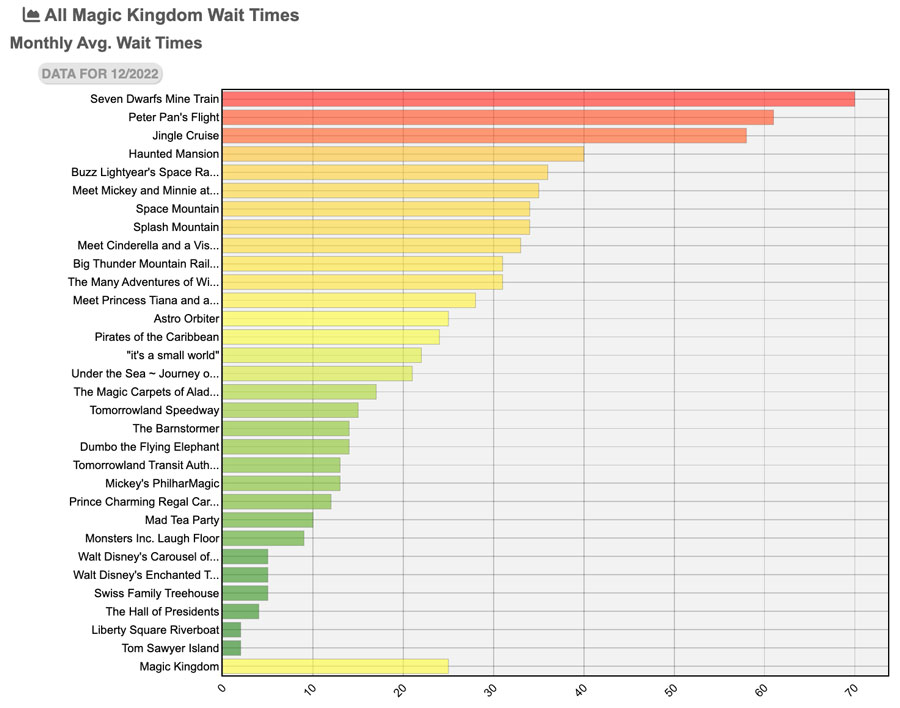
Above are attraction wait times for December 2022 thus far at Magic Kingdom, which obviously exclude the week of Thanksgiving and days thereafter in November.
Nothing really comes as a surprise here–maybe Haunted Mansion and Buzz Lightyear’s Space Ranger Spin being so high, but that’s hardly unprecedented. Splash Mountain is further down the list, but that’s a byproduct of weather. I wonder if we’ll see that climb up the rankings now that there’s a concrete closure date.
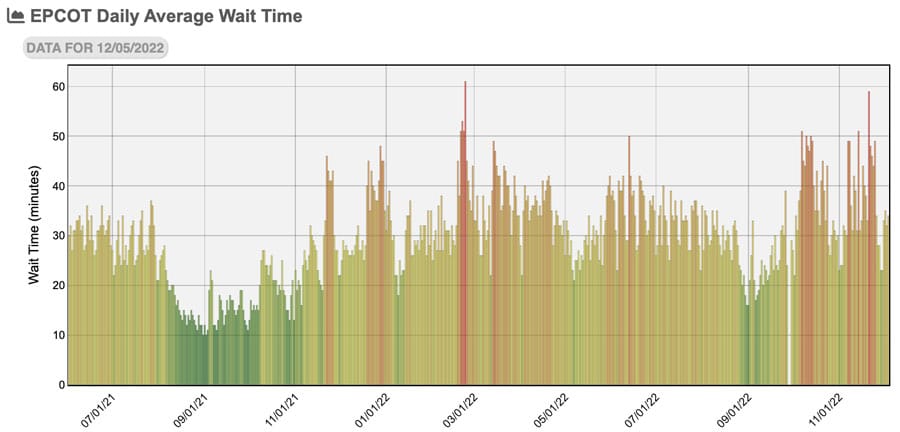
Continuing to Epcot, where crowd levels are now back down to their pre-Thanksgiving levels once again. After spiking to a 10/10 for the holiday, levels are back to moderate levels for the last (almost) two weeks.
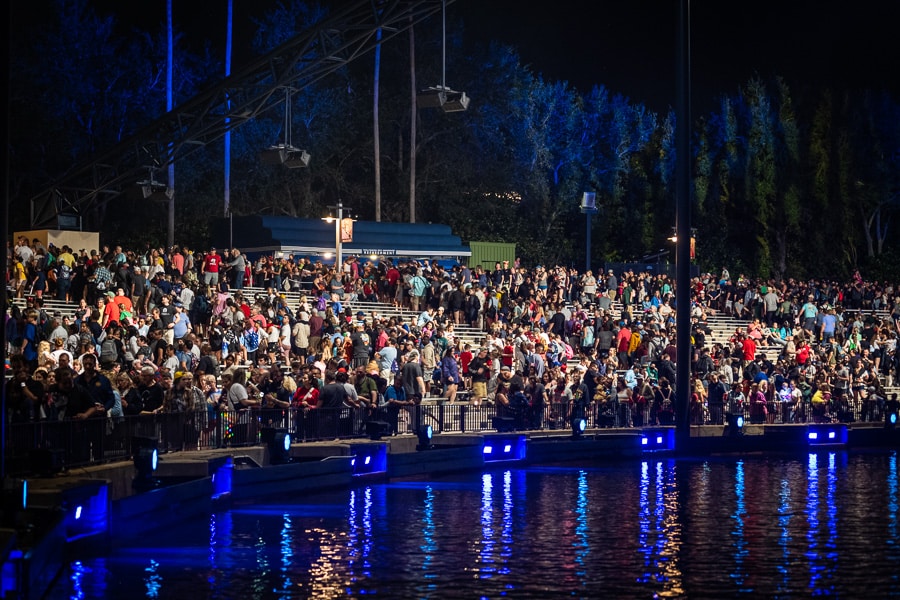
As always, “feels like” crowds at Epcot–especially in World Showcase–are always worse on weekends and evenings. I spent a lot of time at EPCOT last week and it definitely felt busy. However, the return of Fantasmic has definitely relieved some of the pressure on Harmonious, with many Park Hopping guests clearly preferring to see the superior nighttime spectacular. Candlelight Processional crowds also weren’t as bad as expected.
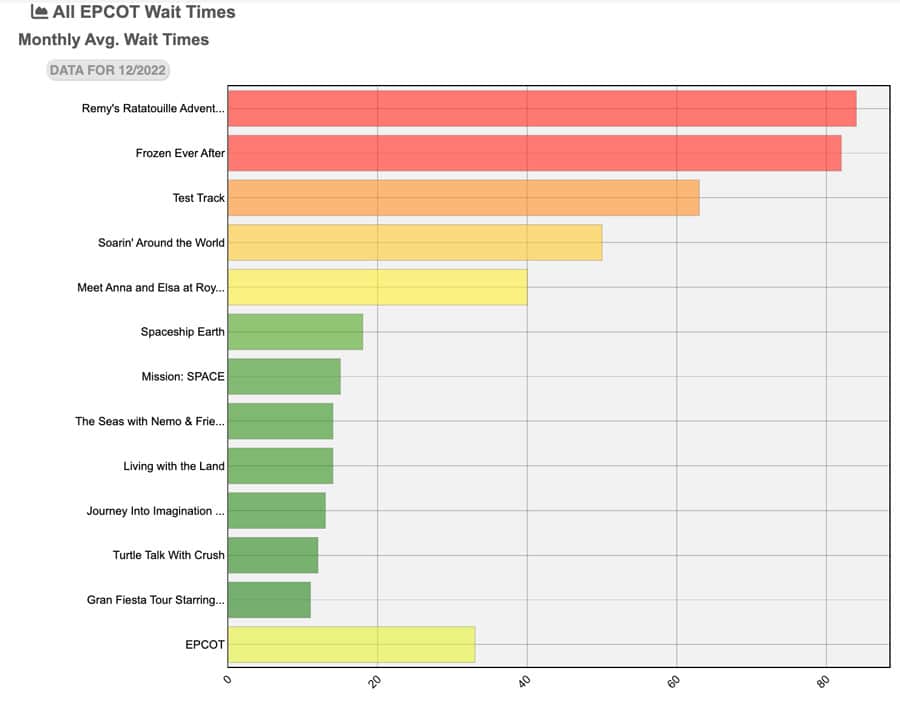
When looking at attraction wait times, there are no surprises at EPCOT, either.
The top trio of Remy’s Ratatouille Adventure, Frozen Ever After, and Test Track are all above an hour, but everything else is perfectly manageable. The actual wait times for everything in the front of the park (including Test Track and Soarin’ Around the World) plummet in the evening, as the ghost of Future World becomes a ghost town and ~95% of the guests in EPCOT all cram into World Showcase.
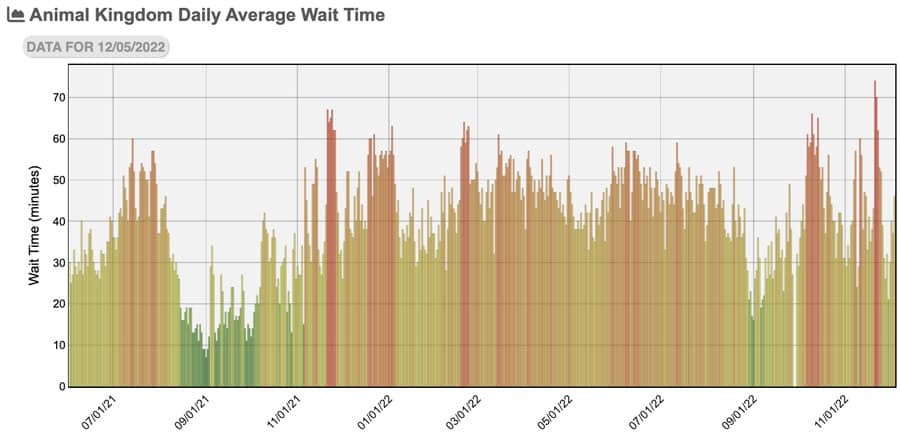
Animal Kingdom had its busiest day of the year Thanksgiving week, and by a wide margin. The average wait time was 74 minutes, which would be a 15/10 or so if the crowd calendar went above 10. This is the busiest day we’ve seen at Animal Kingdom since we began tracking wait times in 2019. I can’t see how it compares to the Pandora opening summer, but it wouldn’t surprise me if this is on par–or even worse–than then.
Crowd levels have plummeted since. November 30 was the lowest low, with a 1/10 crowd level and 21 minute average wait. That makes it rank as the #496 most crowded day in the last 500 days. (Or stated more positively, as the 4th least-crowded day during that time.) By dumb luck, I happened to be in Animal Kingdom on that day, and it was incredible.
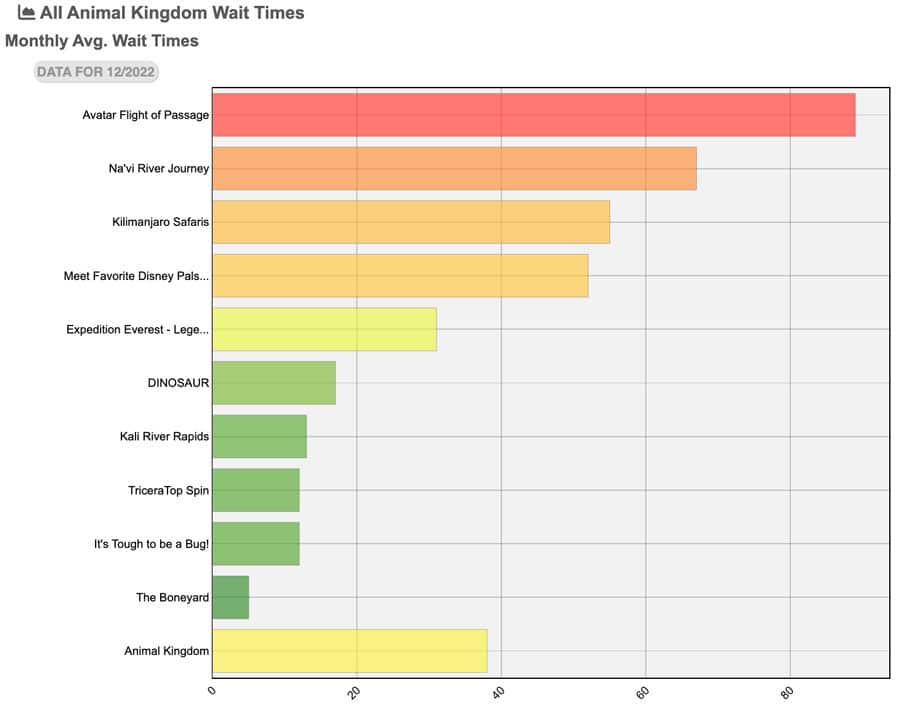
As with the other parks, individual ride wait times are almost exactly what we’d expect thus far in December 2022.
Avatar Flight of Passage has by far the highest average wait time, followed by Na’vi River Journey and Kilimanjaro Safaris. I do want to draw your attention to the Adventurers Outpost meet & greet, which continues to climb the charts. We’ve pointed this out previously, and increased its priority for both standard itineraries and Genie+ users.
It’s worth reiterating, as meet & greets are something that normal Walt Disney World guests overlook until later in the day. However, you can still hit it with a short wait at about 10 am. (I was literally the only person in the standby line for this at around noon on 11/30, but again, that was an absolute anomaly. Do NOT expect the same results!)
This is also true with meet & greets at the other 3 parks. One of the “underrated” ways of beating crowds and higher wait times is prioritizing popular meet & greets or doing them strategically (e.g. during or immediately as Festival of Fantasy concludes at Magic Kingdom, around 10 am at DHS, etc.).
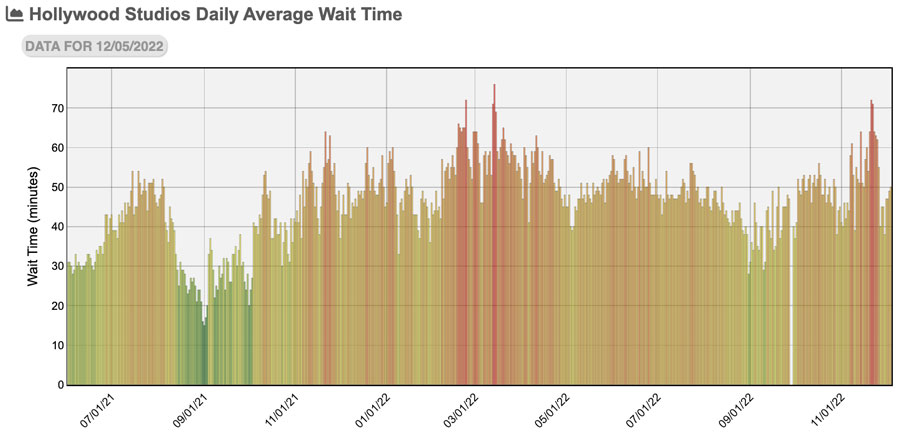
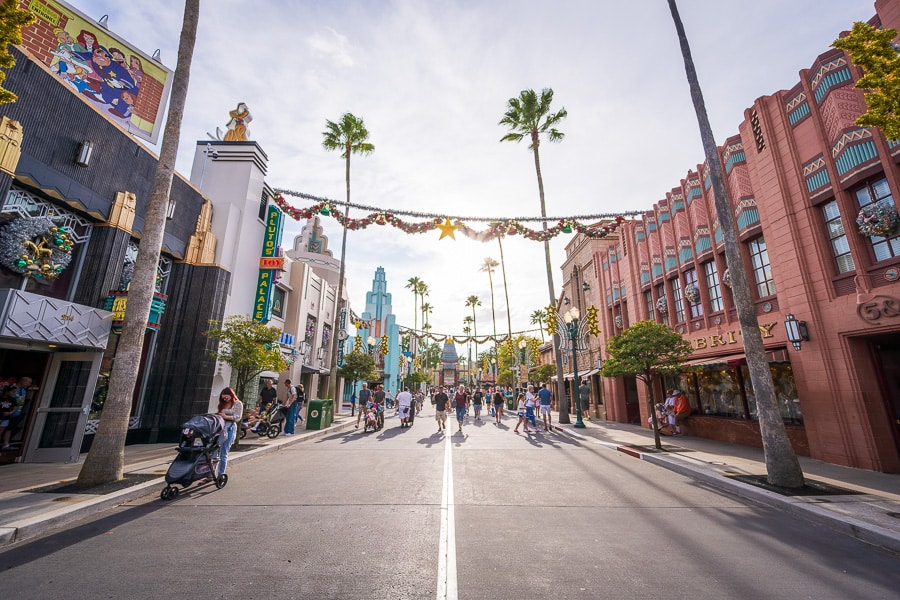
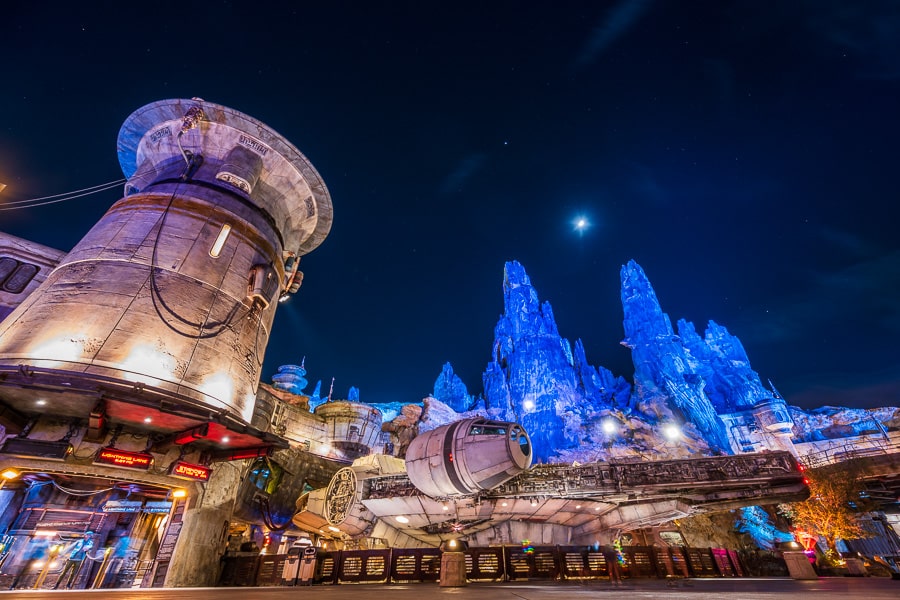
Finally, there’s Disney’s Hollywood Studios. After several days of 10/10 crowd levels and 70+ minute average wait times during the week of Thanksgiving, numbers sharply declined during the week after. Wait times have been in the 40 minute range since, which is a huge decrease.
As always, DHS continues to be the busiest park at Walt Disney World. Anything above 7/10 here is arguably in unpleasant territory. I doubt many people in the park on only the “less busy” days in the last couple of weeks would describe their visit as such. Disney’s Hollywood Studios simply cannot absorb crowds very well. Thankfully, the return of Fantasmic has already started to help redistribute crowds over the course of the day, but it can only do so much–even with two showtimes.
This is nothing new–see our pre-closure post: Disney’s Hollywood Studios: WDW’s Best Rides & Most Frustrating Park.
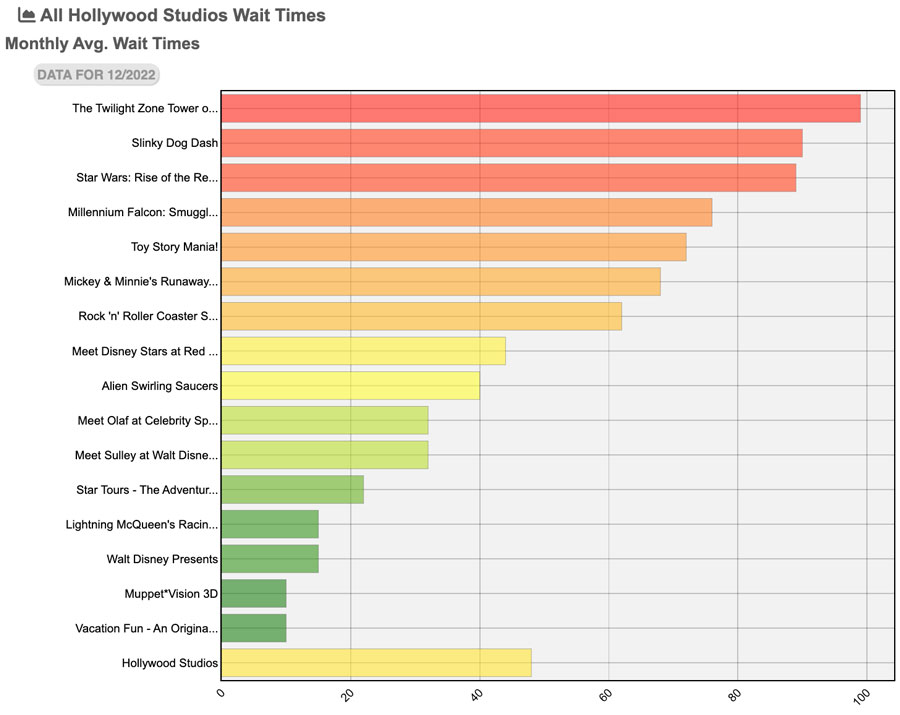
Disney’s Hollywood Studios is where the individual attraction wait times get interesting. That’s not an error–Tower of Terror is #1. This is due to one of the elevator shafts being out of service (again). I still haven’t been able to determine whether this is planned or unplanned downtime. Earlier this year, one side was refurbished and the exact same thing happened. I would hope that Disney didn’t deliberately take the other side down during the holiday season, but who knows. Either way, its wait times have been bad.
Also interesting is Slinky Dog Dash edging out Star Wars: Rise of the Resistance. After that, 4 other attractions are all above 60 minutes. These are the longest averages for headliners in any park at Walt Disney World, and the only reason the average wait time is brought down is because it includes things that don’t really have wait times.
On a positive note, I observed significantly lower wait times during Fantasmic, as that soaks up a large portion of crowds in DHS. Literally every attraction was under an hour between the first and second showings of Fantasmic last week. Judging by what I saw, I’m guessing actual wait times were all under 30 minutes. Here’s hoping this continues, as it’ll mean that staying late is still a great way to beat the crowds at DHS!
Due to an extended trip to Japan, this last week was the first time I’ve been in the parks at Walt Disney World this holiday season. Consequently, I missed the Veterans Day and Thanksgiving week crowds–but have a pretty good idea of how bad they were based on last year. (Not disappointed that I missed any of that!)
I also spent every day in the parks last week, from opening to closing (or later!) on most days. As mentioned above, we have a lot of experience with this particular week, as it’s our favorite week of the year at Walt Disney World. That’s been true for ages. Back when we lived in the Midwest, our annual Christmas trip usually started the Sunday after Thanksgiving. I don’t keep track, but if I had to guess at which week of the year we have spent the most minutes in Walt Disney World since 2007, it would be this one. Probably by a pretty wide margin. We absolutely love the week after Thanksgiving.
Given those years of historical experience–plus how things have changed since around 2018–I have to say I’m pretty happy and pleasantly surprised by the “feels like” crowds and wait times I encountered this past week.
To be sure, there were times when headliner rides had triple-digit waits and walkways were congested. However, that’s par for the course. I also say totally empty walkways and the headliners in every park with 40 minute or lower posted wait times. (Avatar Flight of Passage was 40 minutes during the lunch lull one day, which I haven’t seen in a while.)
I know some longtime Walt Disney World fans are bound to disagree, hence the long and rambling post preface, but this was the best holiday week for crowds that I’ve experienced in a long time. As compared to last year, the return of Fantasmic–and it having 2 showtimes despite not needing both–definitely helped. As did more entertainment and stage shows being back. Ditto earlier opening times for all 4 parks, including Magic Kingdom on party days.
Speaking of which, I did not visit Magic Kingdom on 11/30 or 12/3. Those were its non-party days, wedged among a sea of Mickey’s Very Merry Christmas Party dates. Consequently, crowds “spiked” to 5/10 both days. Every day I did Magic Kingdom in the last week, it was a 1/10. These lower crowd days were easily predictable and we’ve been shouting since July that they wouldn’t be busy, so if you went on one of the 5/10 days instead and have a different perception of crowds as a result…that’s kind of on you.
Looking forward, it’s pretty safe to predict that this week will be busier than last week. Another not-so-bold prediction is that the next week will be busier than that. Guess what, the week before Christmas will be even busier. The stretch between then and New Year’s Eve will be even busier still, especially with both Christmas and NYE bookending that week.
None of these predictions are particularly bold. Historically, crowd levels incrementally increase throughout the month of December, with the biggest wildcards being the last couple of weeks (based upon the days of week of Christmas and NYE). Barring wild weather or other unforeseen circumstances, crowd levels are probably going to jump from 3/10 last week to 5/10 (or so) this week to 7/10 and then to 9/10 or 10/10.
If you’re a local or otherwise have the chance for a last-minute weekend getaway, we’d highly recommend visiting Walt Disney World this week through the middle of next week. This is a great window of nice weather, seasonal events, and low-to-moderate wait time and crowd levels. That window will start to close as locals start realizing it’s their last chance to visit before the Christmas and New Year’s Eve blockouts take effect.
Planning a Walt Disney World trip? Learn about hotels on our Walt Disney World Hotels Reviews page. For where to eat, read our Walt Disney World Restaurant Reviews. To save money on tickets or determine which type to buy, read our Tips for Saving Money on Walt Disney World Tickets post. Our What to Pack for Disney Trips post takes a unique look at clever items to take. For what to do and when to do it, our Walt Disney World Ride Guides will help. For comprehensive advice, the best place to start is our Walt Disney World Trip Planning Guide for everything you need to know!
YOUR THOUGHTS
Predictions on crowds for the rest of December 2022? If you visited during the week of Thanksgiving or thereafter, what was your perception of “feels like” crowds? If your trip overlapped the two weeks, did you feel a noticeable drop the weekend after Thanksgiving? Thoughts on our predictions or anecdotal observations? Agree or disagree with our opinion that last week was the best time of the entire year to visit Walt Disney World? If you’ve visited in prior months during the last year, how did crowds compare between then and now? What did you think of the wait times? Any parks or times of day noticeably worse than the others? Do you agree or disagree with anything in our report? Any questions we can help you answer? Hearing your feedback–even when you disagree with us–is both interesting to us and helpful to other readers, so please share your thoughts below in the comments!


Just got home last night- was there from dec 1st-6th. This was our sixth trip to DW snd sadly probably our worst experience . The parks are really overcrowded- particularly Hollywood Studios. Disney has been a favorite destination for my family but its hard to justify spending the money to basically be in a crowded mess.
I agree sadly, been going for 35 years from UK plus 20 0dd disney cruises
Just got back from 16 nights, whilst still had some magic, food has gone up considerably and parks far too crowded
so you are basically paying for the weather! and walking.
Our strategy was up early 2 or 3 hours in park and then off somewhere else
sometimes we go twice a year but flights are so expensive., been following the business for years and this is the worst we have seen it thus far. even housekeeping is reduced now and all the other little perks it is probably more value in an off property hotel/resort
Makes us very very sad, but hoping Iger will reinstate some more magic
WE JUST RETURNED ALSO! DID SAME DATES YOU DID! 10th trip to Disney and found sit down meals $$$$$$ and quality of of food less than expected because we have dined at all these before Mama Melrose 50 Prime Be our Guest ! Paddle fish was good at Disney Springs and Polite Pig was good food!! my most enjoyable meal was Breakfast at Rain Forest at Animal Kingdom! bring back the old Disney i loved!!!! was dissapointed in Mickey Christmas Party also except for the fireworks show!