
Disneyland Crowds Are Getting Worse in 2024.
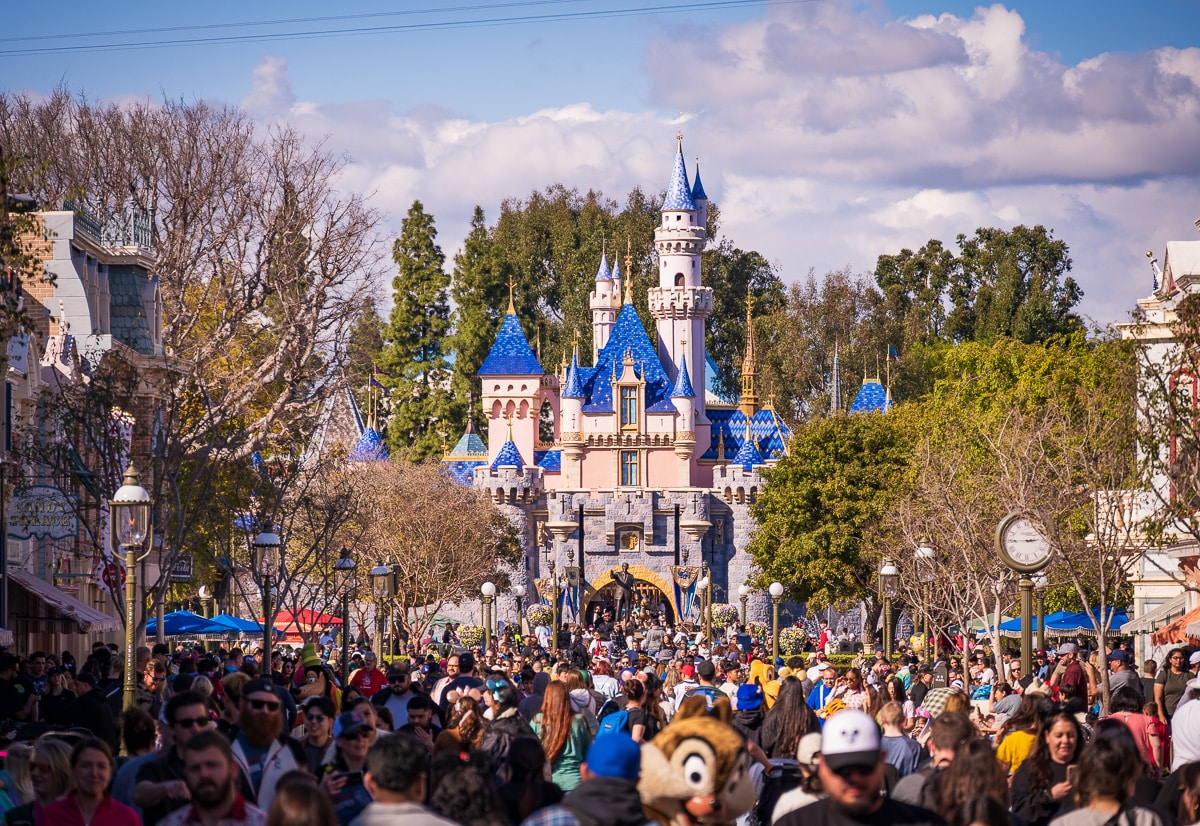
It’s time for an on-the-ground report on winter and early spring crowds at Disneyland. We’ll take a look at January through March 2024 wait times, how busy the parks are right now, and the notion that “revenge travel” is (supposedly) burning out. Plus, predictions for Spring Break season at Disney California Adventure and Disneyland.
Let’s start by bringing you up to speed on crowds at Disneyland. There was a slight slowdown last year after the boom of pent-up demand in 2022. Average wait times were down year-over-year by 5 minutes, which is very significant. However, it’s also lacking in context.
While that was the biggest annual drop since we’ve been measuring crowd levels at Disneyland, it also followed the biggest annual spike. Wait times increased by a whopping 9 minutes from 2021 to 2022, which was more of an average year (average wait times in 2019 and 2020 pre-closure were both 26 minutes). In other words, the 5 minute drop was a lot…but it still amounted to wait times that were +3 as compared to 2019.
Further context is that Walt Disney World saw a greater exhaustion in pent-up demand last year. However, Walt Disney World also saw revenge travel crowds arrive earlier since Florida effectively reopened before California. (Remember, Disneyland was closed for over a year–Walt Disney World only for a few months.) Because of that, Disneyland’s pent-up demand has lagged Walt Disney World by about a year.
Because of that, Walt Disney World has seen falling attendance and hotel occupancy, and has resorted to more aggressive discounts and more in order to entice people to visit. This is all according to Disney’s own earnings calls, and is not speculative. Because of that, we suspect (here comes the speculative part) that Disney wanted to get ahead of the same dynamic occurring at Disneyland in 2024.
As a result, the company released the full 2024 calendar of events at Disneyland and the entertainment schedule for 2024 far earlier than normal in an effort to get people to plan and book trips. Even more significantly, another “lever” Disney pulled was the release of the Kids’ Ticket Discount at Disneyland, which offered $50 tickets for kids. We’ve heard it was incredibly popular–it ends on March 10, 2024 just in time for the start of Spring Break.
Other moves are less noteworthy. The Southern California resident ticket deal is back, but it’s always offered this time of year. This year’s quirk is that the end date is later than normal, and overlaps with the return of Fantasmic–and also that there’s a version including weekends. Magic Key sales have also resumed–twice–but the same thing happened last year. The added wrinkle is that they went on sale again right before Spring Break, which could suggest some softness in Disney’s projections. Or not, who even knows anymore!
Against that backdrop, let’s turn to some of the numbers so far for 2024. Note that what’s covered here is posted wait times pulled from the Disneyland app and compiled into graphs covering various days, weeks, months, and years. Posted wait times are good for identifying big picture trends, but the data is not conclusive of in-park congestion or “feels like” crowds.
Posted wait times offer insight into how busy Disneyland is, but they are an imperfect measure of crowds, especially if you’re comparing current conditions to prior years. Disneyland attendance has increased by several million people since the overhaul of Disney California Adventure, and demographics have also shifted. The end result is that the majority of days in 2024 will be more crowded than their counterparts in 2012, 2015, 2017, 2019, etc. Basically, any year that is not 2022!
With that out of the way, let’s dig into the data and look at Disneyland Resort wait times. As always, graphs and stats are courtesy of Thrill-Data.com:
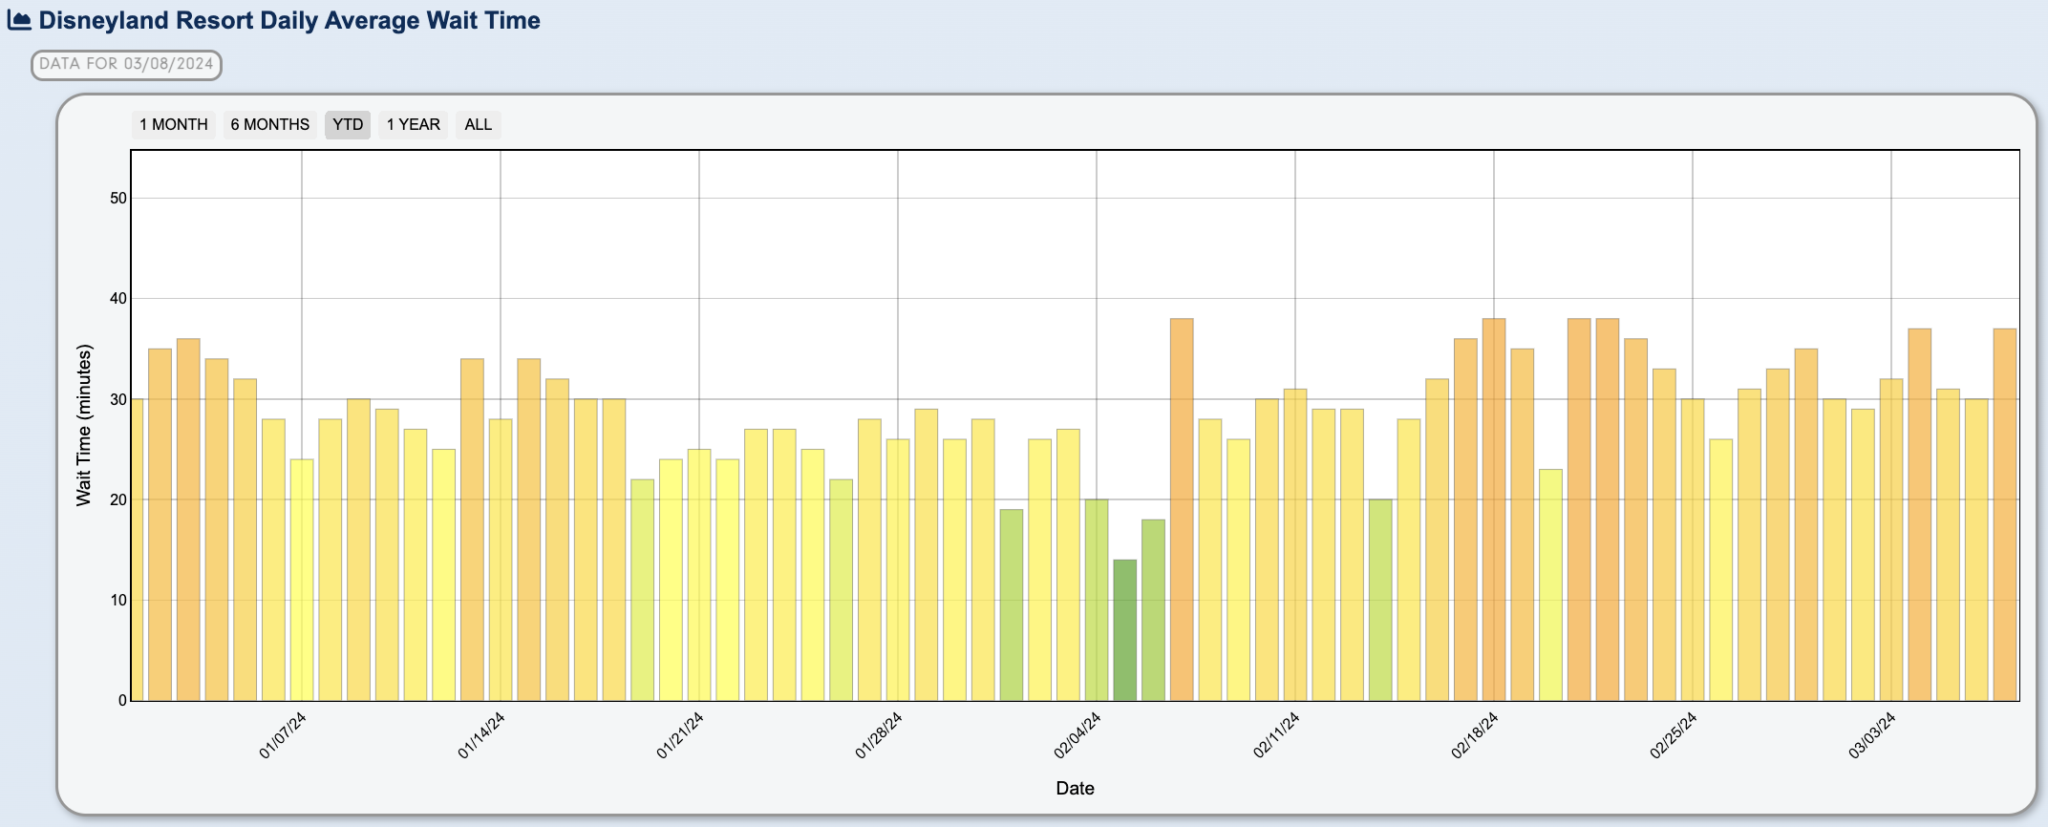
Looking at daily numbers across all of Disneyland year-to-date, it’s a story that’s somewhat similar to our wait time reports from Walt Disney World–except with higher averages across the board and much more consistency. This is actually a surprising amount of consistency, and not the norm for the first couple months of the year.
Typically, there would be a huge spike for the first week as the parks came down off their holiday highs. Once schools went back into session, there’d be a lull with the exception of increases for certain days of the week and holidays. This year, we also could’ve expected an increase for the return of the Disneyland Half Marathon. But aside from that, lots of ‘green days’ on the crowd calendar/wait times report.
What we actually got were a few light green days and only 3 truly uncrowded dates. Unfortunately, those three days at the beginning of February had absolutely nothing to do with the winter off-season. Those were the return of California’s atmospheric river, basically monsoon days at Disneyland. Once the weather got better, there was a sharp spike and crowds have been even more elevated ever since.
Some of you might say that this is unsurprising and how Disneyland crowd levels should look, given the park reservation system that’s still in place and the lack of availability on many dates. And you’re right about the second point–it should look like this! But you’re wrong about the first point…
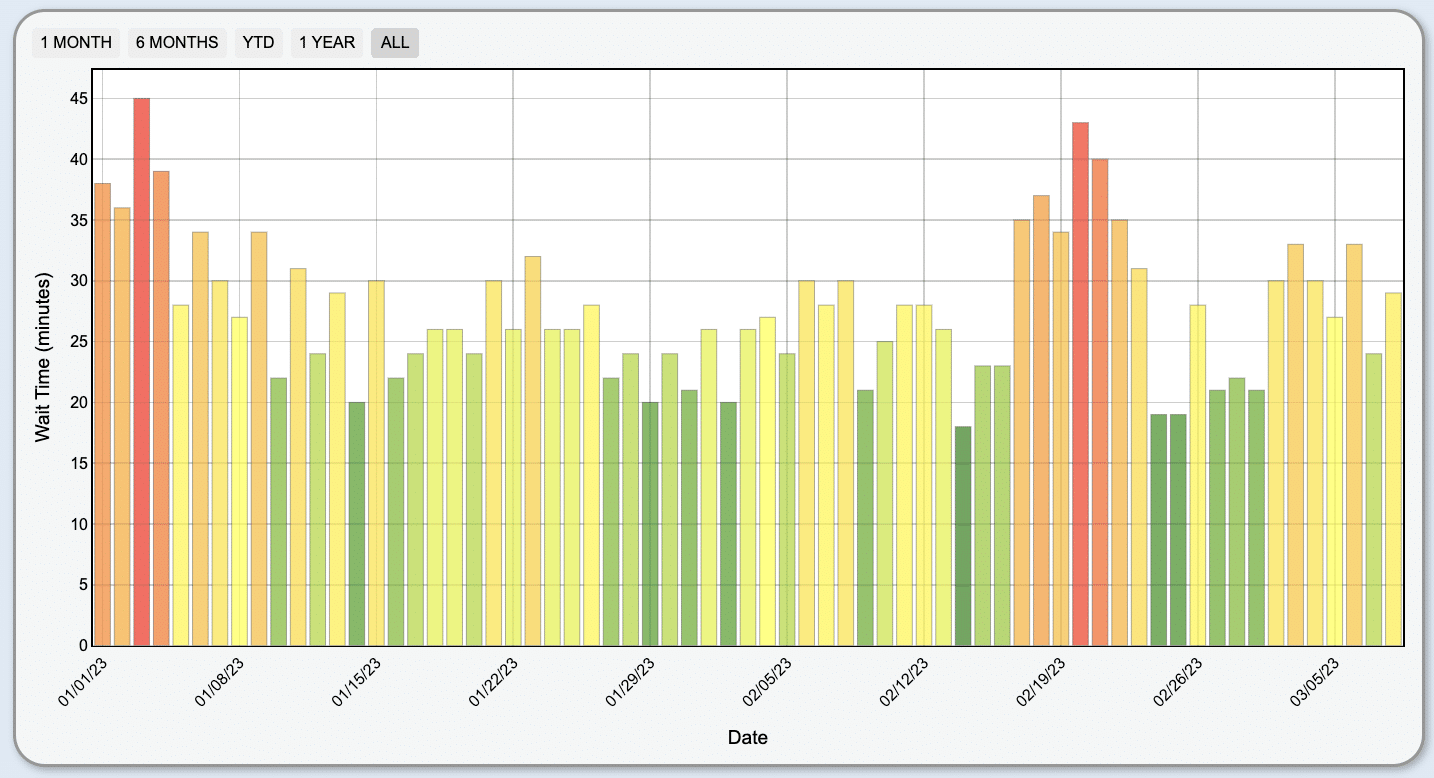
Above is the same daily graph, but for 2023 through the start of Spring Break season. This still isn’t normal by ~2019 standards, but it gives us a better approximation of what winter crowd trends are like. Here you can see everything that’s described above–crowds starting high after New Year’s but leveling off until Ski Week/Mid-Winter Break.
There’s a bit too much day-to-day volatility (as compared to the norm), which was probably due to Disneyland not having quite enough finesse with the park reservation system. In any case, there were a lot of dates where reservation availability for everyone except Magic Key APs was abundant. Exactly what you’d expect to see during the winter months, though.
It’s also worth noting that this encompassed the start of Disney100 at Disneyland, which included the opening of Mickey & Minnie’s Runaway Railway and debuts of both Wondrous Journeys and World of Color – ONE. Magic Happens also returned after a nearly three-year hiatus and was basically brand-new. Point being: although some “stuff” has happened in early 2024, a lot more occurred in early 2023.
This year-over-year increase in consistent crowds for 2024 as compared to 2023 is interesting because it’s the opposite of what we would’ve expected to occur. As discussed in the preface, Disneyland is lagging Walt Disney World by about a year in terms of pent-up demand. So all else being equal, we would’ve anticipated a further downtrend this year at Disneyland.
That’s especially the case when comparing the seasonal or special offerings between the two years. The start of Disney100 and stuff opening then was a big deal, as was the return of Magic Happens after a long absence. This year brought with it Mickey’s Mix Magic, plus offerings that were also available last year, minus Fantasmic. It was an objectively weaker slate, and given how much of Disneyland’s demand is driven by locals, should have meant lower attendance.
And that’s what would’ve happened, if it weren’t for those meddling Disney executives! They pulled some of their “levers” to entice more demand, and voila, it worked. The outcome-determinative “lever” pretty much had to have been the kids ticket deal, since that was not offered last year.
It’s also possible that the rebound is due partly or entirely to externalities. This is something we discussed recently in Re-Revenge Travel at Walt Disney World in 2024. In a nutshell, possible factors for the bounceback are that fears of a recession are diminishing, inflation is easing, real wages are increasing, and consumer confidence is improving.
Another possibility is that this might be a slight ‘reverberation’ after the pent-up demand of 2022. That 2023 was the ‘break’ year for families that visit Disneyland semi-frequently, and they’re returning in 2024. If you’re a Disneyland fan, you’re probably familiar with Southern California traffic–think of it like the accordion effect there. Or perhaps the ripple talked about in World of Color – ONE.
A final more unique-to-California possibility is the rebound of international tourism. This isn’t entirely unique, it’s occurring in Florida, too. The difference is demographics. Southern California is drawing more from Asia, and many countries there had far slower reopenings. Year-over-year in January, Los Angeles International Airport saw a 19% increase in inbound international passenger volume (versus a 2% decrease in domestic). Meanwhile, Universal Studios Hollywood just brought back Mandarin on the Studio Tram Tour.
In other words, the kids tickets could be one driver of the increase–but there are also a lot of real world factors at play that could also explain Disneyland’s resilient attendance in the winter (air quotes) “off-season.”
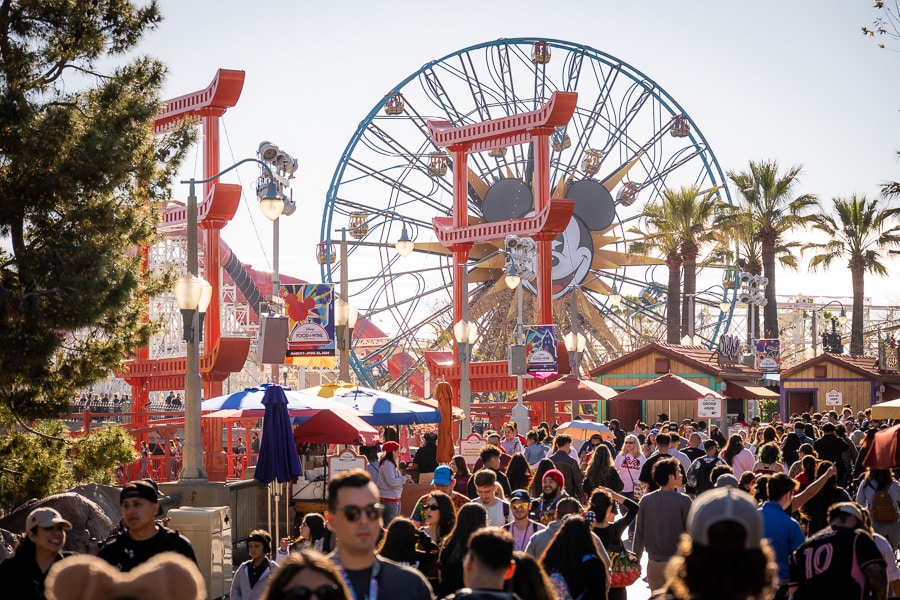
With the wait times data out of the way, let’s turn to our on-the-ground observations. We pop into the parks on a regular basis, but honestly, haven’t had any lengthy park time this year until the past couple of weeks. Having a baby had limited our visits to 4-5 hours at a time, but she’s starting to really respond to and enjoy the visits, so we’ve been going longer.
Our experiences more or less match the data. Yep, it’s busy at Disneyland! Very insightful, right? Taking that a step further, there were a couple of things that I noticed. The first is that there seem to be more families with small children. Frankly, this could be confirmation bias. My theory for the increased crowds has been the kids ticket deal, so maybe I was looking for signs of it.
There’s also the kinda weird fact that I now find myself “checking out” strollers and other kid-related products to see what other parents are using and trying to figure out if we need something we don’t yet have. This isn’t the first time I’ve been afflicted with GAS (it doesn’t mean what you think it means). It’s a known condition in the photography community, and stands for Gear Acquisition Syndrome. I used to find myself checking out others’ cameras and lenses, now I’m doing the same thing with strollers and accessories. Now I know what “history doesn’t repeat itself, but it often rhymes” means.
Anyway, I’m pretty sure there have been more strollers at Disneyland than normal. That or I’m noticing more of them. But I’m pretty sure it’s both, which would make sense given the kids ticket deal.
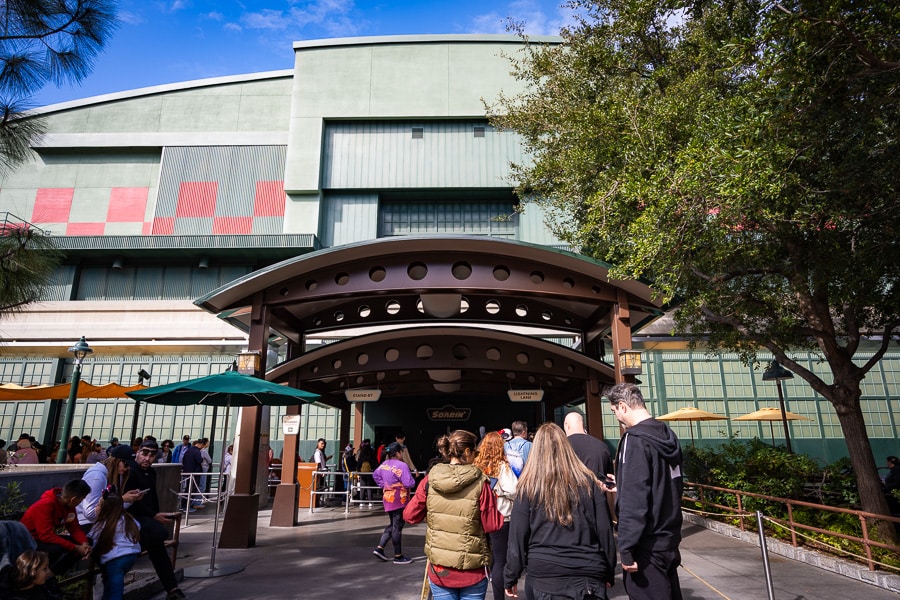
The other trend of which I’m absolutely positive is that Lightning Lane return lines are longer. This is something that’s gotten progressively worse on both coasts over the course of the last year-plus, so it’s not the least bit surprising, but it’s definitely happening. For many attractions, there are now dedicated Lightning Lane switchbacks outside the entrance.
Some Disneyland diehards have noticed this and drawn exactly the wrong conclusion, which is that people are suckers to pay for Genie+ because now the standby line is shorter. I’ve even seen some videos showing long Lightning Lane returns and short standby lines.
What these videos do not show is the merge point, where standby comes to a standstill as the ratio of guests skews strongly in favor of the Lightning Lane. Of course, the point isn’t accuracy–it’s shock value. But who cares about the physical length of a line? By this same standard, the ~15 minute wait times during the physically distanced era that had long lines due to spacing were also bad. It’s the wait time that matters, and those are far worse for standby than Lightning Lane users.
To be clear, this isn’t a defense or endorsement of Genie+ or Lightning Lanes. I’m simply pointing out what’s meaningful versus what’s meaningless. Lightning Lane return lines have gotten longer, that part is true. The service isn’t quite as efficient as it was in 2022. The percentage of guests using Lightning Lanes–either as a result of Genie+ or DAS–has also likely gone up. But that doesn’t make the standby line more efficient–that part is most definitely untrue. Standby is even worse on most attractions!
The good news is that crowd levels are not static throughout the day. During a normal tourist season, Disneyland sees an increase in earlier arrivals, as visitors on vacation are more inclined to arrive for or closer to rope drop. By contrast, locals are more likely to roll up late, having to contend with SoCal traffic and parking.
I’ve done a few Early Entry and rope drop days at both Disneyland and DCA, and found the crowd levels to be very manageable until around 11 am. It’s still possible to beat the crowds and get a ton done first thing. Early Entry is still excellent, even with the reduced schedule. It’s a similar scenario at the end of the evening, especially on school nights.
Suffice to say, you can accomplish a lot in the first few hours of the day or last couple hours at Disneyland and Disney California Adventure. You can still rope drop Peter Pan’s Flight and knock out the entirety of Fantasyland with minimal wait. You can also hit Star Wars: Rise of the Resistance at rope drop for a 45 minute or less standby wait.
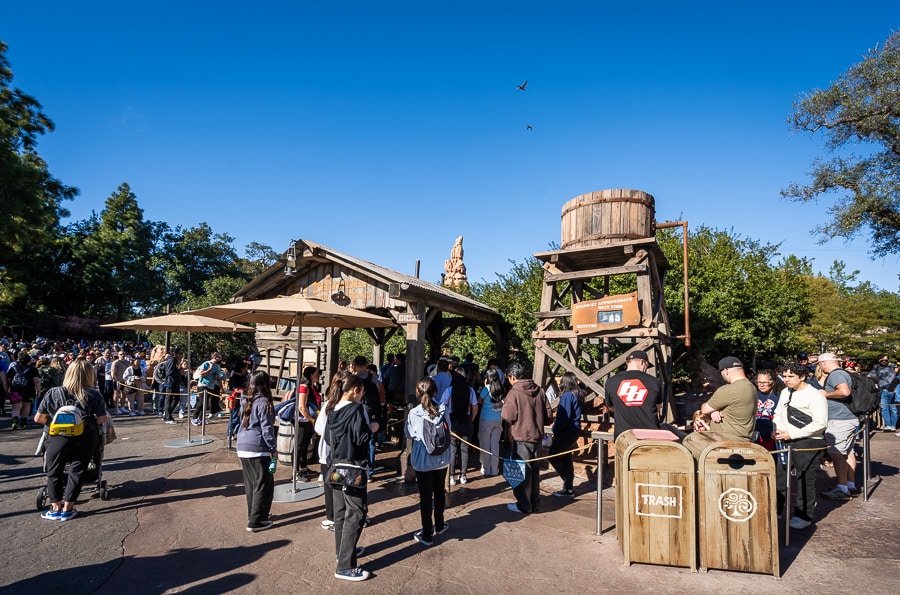
For that matter, you can do Star Wars: Rise of the Resistance even after that initial wave and still not have too long of a wait. Same goes with Mickey & Minnie’s Runaway Railway, Space Mountain, and Indiana Jones Adventure. All of these rides can have longer wait times later in the day–and lines that move at a snail’s pace due to the Lightning Lanes–but they’re are blissful early on. They are also, unfortunately, all in different corners of the park, which makes strategizing tricky unless you don’t mind a lot of backtracking.
This will probably change with the arrival of Spring Break season, and return again during the shoulder season before the scales tip significantly in favor of tourists from June through mid-August. But the main point is that Genie+ is not a must-buy. You’ll get more done with it during the heart of the day (and we recommend at least one day with paid FastPass–see our Guide to Genie+ and Lightning Lanes at Disneyland & DCA for more on that), but if you can’t or don’t want to splurge, getting up and out the door early still works!
Looking forward, the next few weeks are Spring Break season at Disneyland. Objectively speaking, average wait times should spike. Subjectively, we’d expect even more congestion–especially for entertainment. Wondrous Journeys returns March 22 for a brief 3-week run, and Main Street is sure to be packed hours in advance of that fan-favorite fireworks show.
Although the start of Spring Break season is upon us, it shouldn’t kick into high gear until March 15, 2024. In perusing local school calendars, the second most-common week is March 18-22, 2024. Far and away the most common is March 25-29, 2024; that includes the massive Los Angeles Unified School District.
Surrounding states (especially Utah and Nevada) also factor into the mix, meaning that Disneyland will be seeing significant Spring Break crowds from roughly March 15 until April 8, 2024. The good news is that this is actually shorter than the window for Walt Disney World Spring Break season, owing to districts in the Midwest and Northeast that have much later recesses not really factoring into California crowds.
The bad news is pretty much already discussed above–that crowds have been consistently bad thus far in 2024. While it’s possible that there will be a spike and a decrease, it’s also possible that Disneyland stays consistently busy. Unless it rains. Or unless the kids ticket deal actually was the big driver of crowds thus far in 2024. I guess we shall see!
Planning a Southern California vacation? For park admission deals, read Tips for Saving Money on Disneyland Tickets. Learn about on-site and off-site hotels in our Anaheim Hotel Reviews & Rankings. For where to eat, check out our Disneyland Restaurant Reviews. For unique ideas of things that’ll improve your trip, check out What to Pack for Disney. For comprehensive advice, consult our Disneyland Vacation Planning Guide. Finally, for guides beyond Disney, check out our Southern California Itineraries for day trips to Los Angeles, Laguna Beach, and many other SoCal cities!
YOUR THOUGHTS
Thoughts on the crowds in 2024 thus far at Disneyland? Do you think the big driver of higher attendance and wait times has been the kids ticket deal or the real world externalities…or a bit of both? Predictions on crowds for Spring Break 2024? Think there will finally be a slowdown for shoulder season? If you’ve visited last two months, what did you think of crowds and wait times? Thoughts on Lightning Lane return lines? Any days or times seem noticeably worse than the others? Do you agree or disagree with anything in our report? Any questions we can help you answer? Hearing your feedback–even when you disagree with us–is both interesting to us and helpful to other readers, so please share your thoughts below in the comments!


Hi Tom,
I’m playing a trip to Disneyland for August 2025. My intention is to do three days at DP and three days at CA. Given your wealth of knowledge around crowds; what dates and/or days of the week would be best for me to avoid crowds?
I intend to rope drop, use Genie + and park hop (on a CA day over to DP) to maximise my time. It seems reading your posts that the tail end of the week (Thur-Sun) would be my best bet. One final question: what do you predict crowd levels will be like in August 2025 compared to say, this August? I was there before in March and November of 2018 (the November was horrendous while March was tolerable).
Kind regards,
Stephen Evans 18.03
I am a long time reader of the blog. Have been to WDW 5 times and planning our first DL trip in late May as part of a SoCal trip. I am trying to look at grad nights, park pass block outs, crowd calendars, etc to decide where in our trip to put our DL days. Looking at either before Memorial Day Thursday (grad night) and Friday (Fantasmic returns, some AP block outs) or the following week Wednesday and Thursday (no grad nights, no AP block outs). Any advice on which would be better?
I’m so glad I came across this article! When I was prepping for our first ever DLR visit in 2019, I RIGOROUSLY studied your guides. Now that I’m somewhat of a seasoned pro myself after going to DLR dozens of times now, it’s fun to come across this and be able to join in with an opinion on this stuff!
Compared to 2019, crowds are DEFINITELY higher with more families than before, at least in my humble opinion. Comparing 2022 to 2023, I’d say 2023 was also a lot more mellow than the year before unless you were like me and went during NYE (I’ll never do that again, lol!). However, I do think some of the entertainment that DLR is missing (Jedi Training, shows at the Hyperion, etc) really hurts the park’s wait times because there’s nowhere else for people to go unless it’s rides or parades. We’re gearing up for our first visit (of many) to the parks for 2024, so I’ll report back from my perspective on crowds of 2023 versus 2024. Thanks Tom for all the help you gave me during my pre-Disney days!
Operationally, Disneyland feels like a mess on the ground. Not just a ton of E-tickets being down, but massively inconsistent operations that can’t keep up with demand and the resulting LL pile ups.
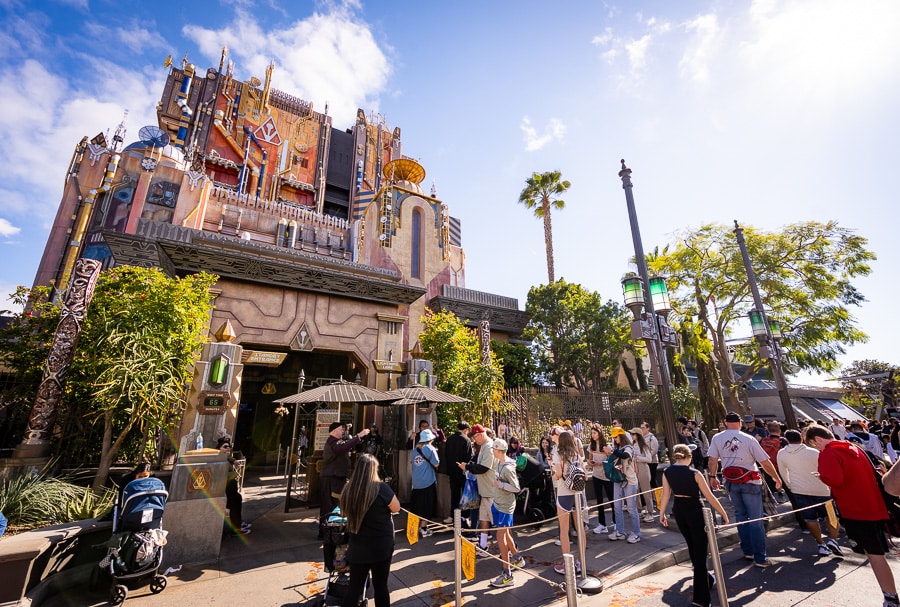
Tonight, very busy (tons of strollers due to last weekend of kids deal) half of DCA was down at one point (Cars, Incredicoaster (refurbishmement – after weeks of downtime in November!), a shaft of Guardians, and Web Slingers, and my poor Golden Zephyr shutting down in 12mph wind), and all these lightning lanes pile into the couple of attractions left.
I just left the park, and Indy, Railway, and Rise are down at Disneyland.
These operational messes just keep piling up, and it feels like they are pushing wait times through the roof. Plus, a real lack of entertainment means there’s not really anywhere for people passively to go.
Meanwhile, I can eat at almost any restaurant I want at 7:00 with immediate Mobile Order times.
Disneyland feels broken. Especially compared to Walt Disney World. I don’t know if it’s staffing or what.
I would actually say the opposite. In my experience DL is better run and has more entertainment and characters out.
We have only been to WDW, but on our last trip (an insane week in March 2023), ride downtime and glitches had a huge impact on the quality of our experience. I would be very curious to hear Tom’s thoughts about which park is handling maintenance better.
Yikes, Hastin. That is a rough night. Also glad we didn’t go…were debating this weekend for a while, but figured they’ve probably released more reservation availability for the last hurrah of the kids tickets. That always seems to happen with the SoCal ones.
As for whether WDW or DLR is worse, it’s honestly very difficult to say. What I will say is that neither is markedly better than the other, at least in my firsthand experience. Moreover, both are markedly worse than 2019.
One of the problems at Disneyland is the lack of entertainment relative to its past self, not to WDW. (That’s Hastin’s point.) Mobile Order has gotten better, but it feels like it’s back to historical norms, which I assume is improved staffing.
My own perception of breakdowns is that they’re worse at Walt Disney World (YMMV). Not in volume, but the crippling effect. All it takes is two rides at DHS or DAK to do major damage because that’s such a (comparatively) high percentage of the ride roster and total capacity. Two rides going down at Disneyland is obviously not good, but it’s a much lower percentage. I’ve had several mornings at DHS that are a lost cause due to breakdowns in the last few years; I’ve had that happen a couple of times at DCA but not DL. This is all totally anecdotal, though, and good/bad luck definitely plays a role. Maintenance and ride reliability have gotten worse on both coasts.
Tom great article as usual. I also have been looking at data from Thrill-data and Touring Plans. We used TP on a past WDW and fount it pretty spot on. We are planning a trip to DLR late Feb. 2025 and hope that TP is accurate again.
As to strollers. What a pain. We went to WDW with a 4 and 7 year old grand kids. No stroller and no problems. We saw many families with strollers for kids that were 10+. They used the strollers as battering rams and a way to push through crowds and cut lines. I get you need a stroller for an infant or young toddler, but they are being WAY over used. It makes transportation a royal pain. I think the increase in strollers has nothing to do with increase in kids, just an increase in people using them when not needed.
A lot of “it seems busy” “maybe it is” “maybe it’s not”…not much conclusive evidence, just kind of a ramble. I will agree that Lightning Lanes are wayyyy too long and Disney really needs to increase the price of Genie+ dramatically. I think somewhere around $100 would be the sweet spot. Thirty bucks is way too cheap and we’re seeing how that degrades the experience (both LL and Standby) for everyone.
You’re right that there’s no conclusive evidence as to the cause of crowds, but I think the wait times data from January through March speaks for itself and shows consistently elevated crowds.
That’s funny that you post about high crowds and Disneyland, when Touring Plans just lowered all of their predictions because they’ve seen a lower number of guests than predicted so far for 2024 in Disneyland. Sorry, but I’m a firm follower of Touring Plans and their rigorous data crunching
The backwards-looking wait times data for the last two months is what it is. I don’t know what TP sees to lower forward-looking projections, so I guess we’ll see what happens.
Touring Plans has data showing that their DL modeling has consistently been less precise than their FL modeling for both WDW and DL over the past 5 years: https://touringplans.com/blog/2023-disneyland-crowd-calendar-retrospective/
I suspect that is because locals are more likely to respond to data that’s harder to predict like weather, and Disneyland has a higher percentage of locals than either FL park (and perhaps less predictable weather, though that’s just a guess).
Tom, my husband is disabled and will be using a scooter. Do you think we’ll still need to use Genie Plus, given that we can get a return time ticket for a disabled person?
I’m not the best person to answer that, but I think Genie+ is probably unnecessary for most people who qualify for DAS.
Disney will say that if you use a scooter you don’t need DAS pass. They don’t consider mobility a DAS issue, even if there is another unseen issue. I was refused this last visit. Some people are saying if one cast member turns you down go to another. If that’s the case it’s not going to fix the problem( but that’s a separate issue). I’ve got better things to do while in the Park than shop around for a cast member and just went with the Genie.
Thanks for the analysis. Another thing to consider when comparing 2023 to 2024 is that last year Southern California was being hammered by rain up until June. We’ve had some storms this year but nothing like last year.
Has precipitation really been that different? I haven’t seen stats, but feel like the last two years have both been pretty rainy.
We just spent 4 days at Disneyland & California Adventure this week. It seems like the current unavailability of Haunted Mansion and Splash Mountain impacts the wait times for all the other rides. Those 2 rides accommodate a lot of guests and to have them not running makes a huge difference.
Yes! I forgot to include that as another factor, but you’re absolutely right.
In general, increased downtime is certainly playing a role, but that ‘corner’ of the park being out of commission is a big deal.
I agree with Wendy that having these 2 people-eating attractions down is a major factor in larger crowds everywhere else at the resort. NOS train station is also closed. And so is Astro Orbiter, which can hold an hour’s worth of suckers in its line.
Thank you so much for the analysis. I do believe at least one driver of crowds this time of year is frequent visiting Californians (not necessarily Southern Californians) going during the “traditional” off-season. Several of them have been surprised at the elevated crowds and will likely adjust in the future. Or realize that “elevated” for the off-season is still lower than the busy seasons. Crossed fingers that they bring back the Kid’s Ticket next year. I would love to see the Lunar New Year celebration.
I think you’re correct both in the current analysis and the outcome.
I’d also add that two consecutive years of very rainy winters in SoCal could cause a change in guest behavior of frequent-visitors. Certainly not of everyone or even a majority, but if you encountered rain instead of sunshine two straight years…you might shift to August/September!
Any insight on DL vs WDW in Mid August (14th-18th) in terms of crowds? I know WDW will for sure be hotter and muggier, why is why I want to try DL this year. But this post has me nervous!
Disneyland will be busier than Walt Disney World in all likelihood, but that’ll still be one of the best times to visit DLR. You’re hitting a sweet spot after school’s back in session but before the (early) start to Halloween.
The biggest issue you’re going to encounter is the lowest tier of AP being unblocked starting Aug 12. After not being able to visit all summer, there will be pent-up demand among those passholders.
This was perfectly timed content as we leave for DLR tomorrow, so thank you! Our East Coast spring break is earlier than most. I’ll be curious to see the impact of the discount kids’ tickets on our first park day–this Sunday at Disneyland–which is the last day those tickets are redeemable. I’m anticipating a crush of people trying to use them before they expire, but who knows! We’ll rope drop, follow your advice, and try to stay ahead of the wave.
Good analysis. The parks still deliver the quality experience fans want – always a fun escape!
I am a long time reader of the blog. Have been to WDW 5 times and planning our first DL trip in late May as part of a SoCal trip. I am trying to look at grad nights, park pass block outs, crowd calendars, etc to decide where in our trip to put our DL days. Looking at either before Memorial Day Thursday (grad night) and Friday (Fantasmic returns, some AP block outs) or the following week Wednesday and Thursday (no grad nights, no AP block outs). Any advice on which would be better?