
Wait Times Are Down, But Attendance Is Up at Disney World. Here’s How Both Can Be True.

If you go by wait times data, the last few months have seen a measurable slowdown at Walt Disney World. If you go by the company’s reported attendance numbers, the 2026 shoulder season and summer have seen a modest increase. So who is lying? We explain how both could possibly be true at the same time, advancing several theories for the lower crowd levels coupled with higher attendance.
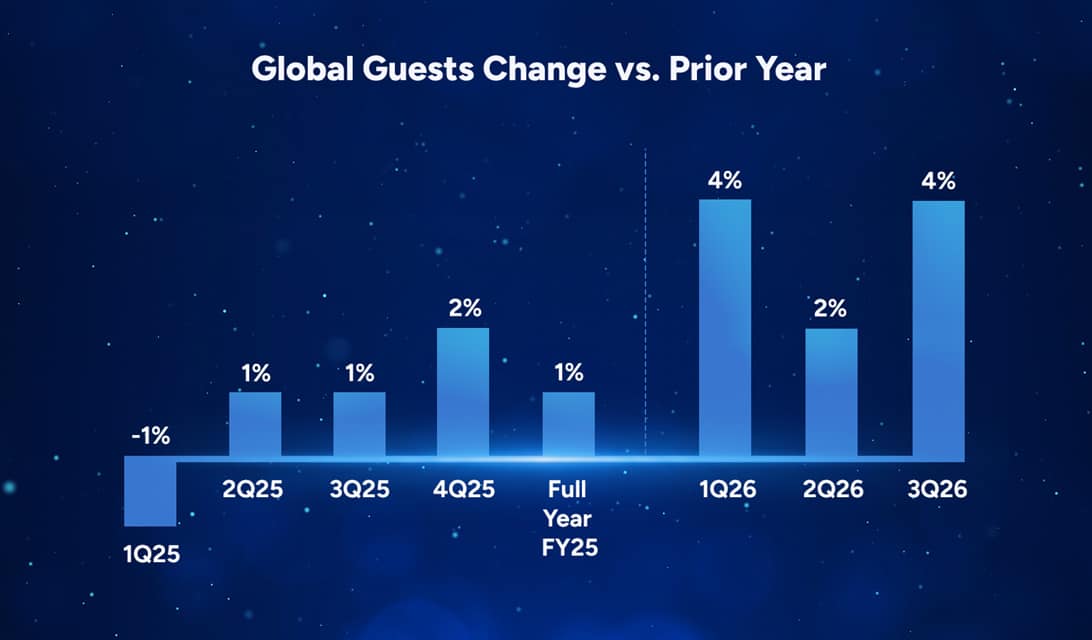
As basic background, the Walt Disney Company recently reported its third quarter earnings for the months of April, May and June 2026. With the Parks & Resorts segment, Walt Disney World was specifically ‘congratulated’ for its stand-out performance.
No matter how you slice it, Walt Disney World exceeded expectations. Domestic park attendance was up 3%, resort hotel occupancy increased by 5%, and per guest spending rose 3%. We covered this in length here, but the bottom line is that Walt Disney World (along with Disney Cruise Line, which added two new ships) was the growth engine for the segment, and beat all reasonable outside expectations.
That’s doubly true in light of the Comcast earnings for the same period, which raised red flags for the broader Orlando market. I will be the first to admit that I was surprised by these results. If you asked me what I expected going into the call, it would’ve been a repeat of the prior quarter, which saw a 1% dip in domestic attendance.
Our post covering the earnings call offers our theories for the increase, which mostly revolve around Walt Disney World becoming more adept at targeted discounting and pulling the right levers. After a fairly hasty roll-out last year, Walt Disney World fleshed out its Cool Kids’ Summer campaign this year, and it seems to me that is paying dividends.
At the same time, wait times are down this summer. The data on that is clear and conclusive. This is precisely why I would’ve predicted a 1% decrease in attendance as opposed to an increase. And even a 1% decrease would still be fairly respectable results, as Walt Disney World is a couple of years removed from its last brand-new attraction, still over a year out from Tropical Americas, and currently a construction zone!
Wait times being down will not come as a surprise to regular readers of this blog. This is a point we’ve been stressing for years, most recently in Should You Visit Disney World in Summer? That post offers our verdict on whether visiting this time of year is “worth it,” which basically comes down to weather and longer days versus lower crowds and better deals. There’s more to it than that, but that’s the nutshell version of the salient points.
As we’ve covered in countless other posts, the summer slowdown is not a new development. It has simply become more pronounced and travel has continued to shift in the last few years. However, summer hasn’t been peak season since 2016.
Third Quarter WDW Wait Times
The wait times for April, May and June 2026 (courtesy of thrill-data.com) bear this out.
Here are the monthly averages for this year:
- April 2026: 34 minutes
- May 2026: 30 minutes
- June 2026: 27 minutes
Here are the monthly averages for last year:
- April 2025: 34 minutes
- May 2025: 32 minutes
- June 2025: 31 minutes
My on the ground experience more or less corroborates this. I spent extensive time in the parks before and after Easter, which was a predictable madhouse. The shoulder season lead-up to Memorial Day wasn’t nearly as busy as I expected. Meanwhile, my June visits were the least busy I’ve seen the parks since last year’s off-season. Which is unsurprising, as June 2026 was only one minute one busier than September 2025, the slowest month of last year!
The above data is pulled directly from the My Disney Experience app, so it is accurate as to posted wait times in the park. While not conclusive of crowdedness or congestion (or attendance, for that matter), the wait times data is accurate and indisputable. So, how is it possible that park attendance increased?
We’ll break it down here, but first, a related note on Walt Disney World’s attendance numbers…
The Data is the Data
We’ve long “warned” fans against taking at face value everything Disney says in marketing materials. However, earnings calls are not a press release. These numbers come straight from a Form 10-Q filing by the Walt Disney Company with the United States Securities and Exchange Commission.
There are no rules about what is said on stage at Destination D23 or in the Disney Parks Blog. Anything goes. Neil Patrick Harris could come out next weekend, slander the good name of Figment, call Goofy’s Sky School a fan-favorite attraction, or claim that CommuniCore Hall is an exemplar of Imagination. He’d be lying, of course, but law enforcement officers could not rush the stage to apprehend him for any such remarks, however false and inflammatory.
By contrast, this is a legal filing with the SEC, and its rules prohibit companies from fraudulent, false or misleading statements to investors. This prevents Disney or any other company from releasing reports with inaccurate data or executives from making knowingly false claims that analysts and investors might rely upon. The distinct seems rather obvious to us.
Accordingly, we take earnings reports at close to face value. Disney is still going to frame everything in the most favorable light and spin to the extent possible. But the data tells the story here, full stop.
You might be saying, “well obviously” in response to that, but there’s a subset of the fan community that wants badly to believe their preordained narrative. Disney cannot be doing well, because that would burst their bubble and the entire worldview they’ve constructed. Either Disney is lying or the goalposts must move. That is, unless what Disney says comports with their agenda, in which case, Disney is telling the truth for once.
This has gotten worse with the rise of online polarization, but it’s been a thing for as long as I’ve been a member of the fan community, so dating back for over the last two decades. If you believe some of these people, the Bobs and now Chapek, plus a long line of CFOs are going to be busted for fraud any day now.
There are any number of reasons why this is nonsense. For one, Disney reports negative numbers all the time. One of the reasons Disney’s stock cratered from all-time highs is because of self-reported streaming results. Bob Chapek lost the faith of investors and was fired because he didn’t treat the numbers he was announcing with sufficient seriousness!
Unless Disney lies selectively and arbitrarily, reporting some really bad numbers while lying about modestly good ones? In that case, why not lie harder?! Lie all the way until that stock is $200 per share! Like any conspiracy, this one falls apart under any degree of scrutiny when you consider how many people would have to maintain a lie to make it work. No one is risking it all to claim attendance and occupancy were up by single digits when they were actually down by single digits.
This just is not happening in any meaningful sense. The lack of arrests tells the tale. The numbers are the numbers. With that little rant out of the way, let’s talk possible theories as to why wait times might be down at Walt Disney World even as attendance is up…
Fewer Ride Refurbishments
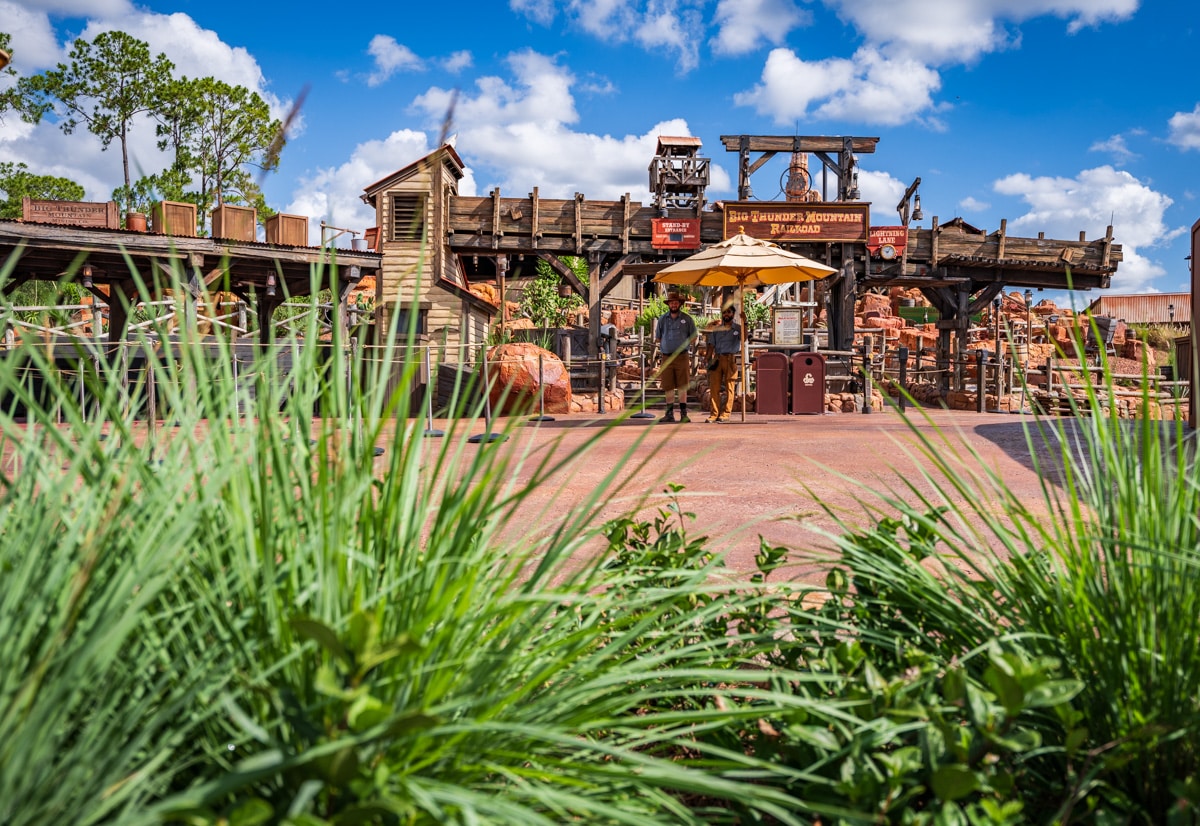
Although there is a ton of construction (probably precisely because there’s so much) around Walt Disney World right now, there have been very few routine refurbishments this shoulder season and summer. Not only that, but there are also several rides back online that weren’t last year.
Big Thunder Mountain Railroad is probably the best example, but so too is Test Track. Both are incredibly popular, and were closed for the entirety of the third quarter last year. And although it was open at this time last year, Buzz Lightyear’s Space Ranger Spin has become more popular and undoubtedly improved utilization.
In terms of stage shows, “The Little Mermaid – A Musical Adventure” and “Villains Unfairly Ever After” were open for this entire quarter but not the same time for all of last year. In fairness, several attractions that were open in last year’s third quarter have since closed, but most were comparatively underutilized. Speaking of which…
Reinvigorating Underutilized Capacity
One of Walt Disney World’s stated goals for the last three years has been “bringing new life to underutilized areas.” Those are the words that former WDW President Jeff Vahle used when referring to the replacements for Rivers of America, Tom Sawyer Island, Muppets Courtyard, and Dinoland, much to the consternation of fans.
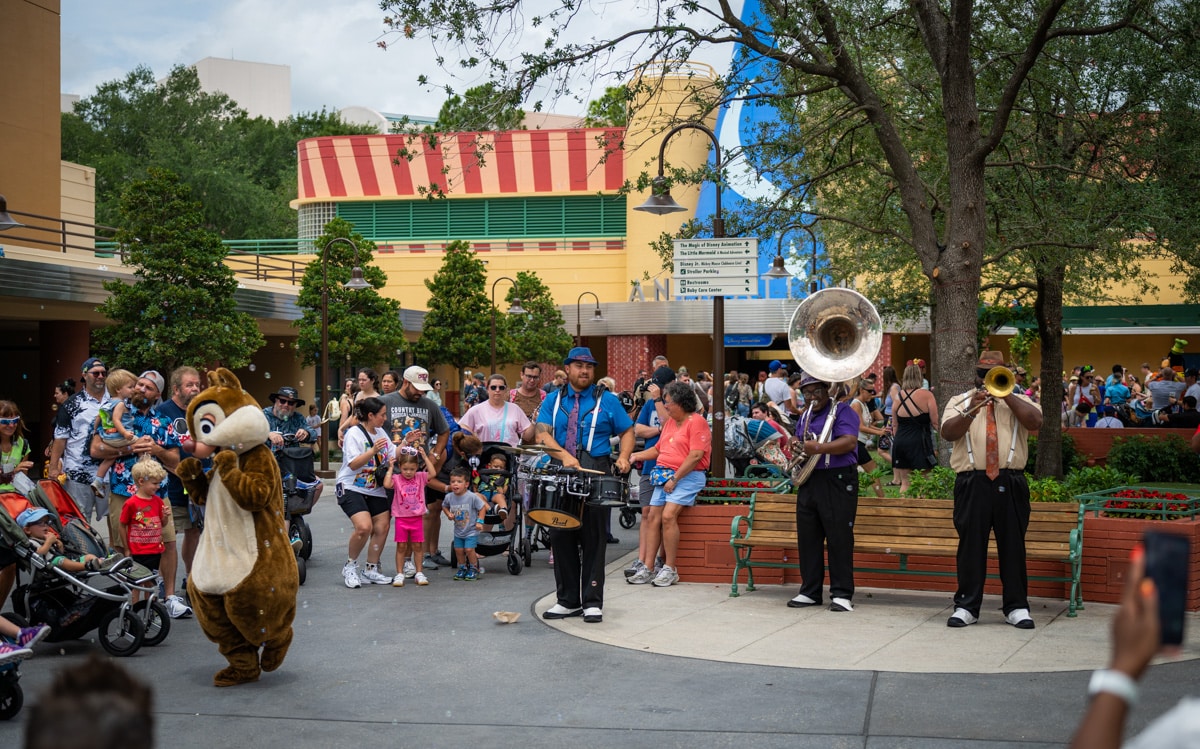
Obviously, those are all construction zones. But the Walt Disney Studio Lot, for example, is not. That courtyard has gone from having dead mall vibes to being one of the most bustling in all of Walt Disney World. All those people wandering around that courtyard are doing something other than waiting in a line, so they’re contributing to crowds without adding to wait times.
That’s just one example of Walt Disney World gaining attendance-absorbing capacity in the last year. We’ve seen similar initiatives with indoor spaces around the parks, which are being put to better use, especially during the summer months when they once sat empty.
Added Entertainment
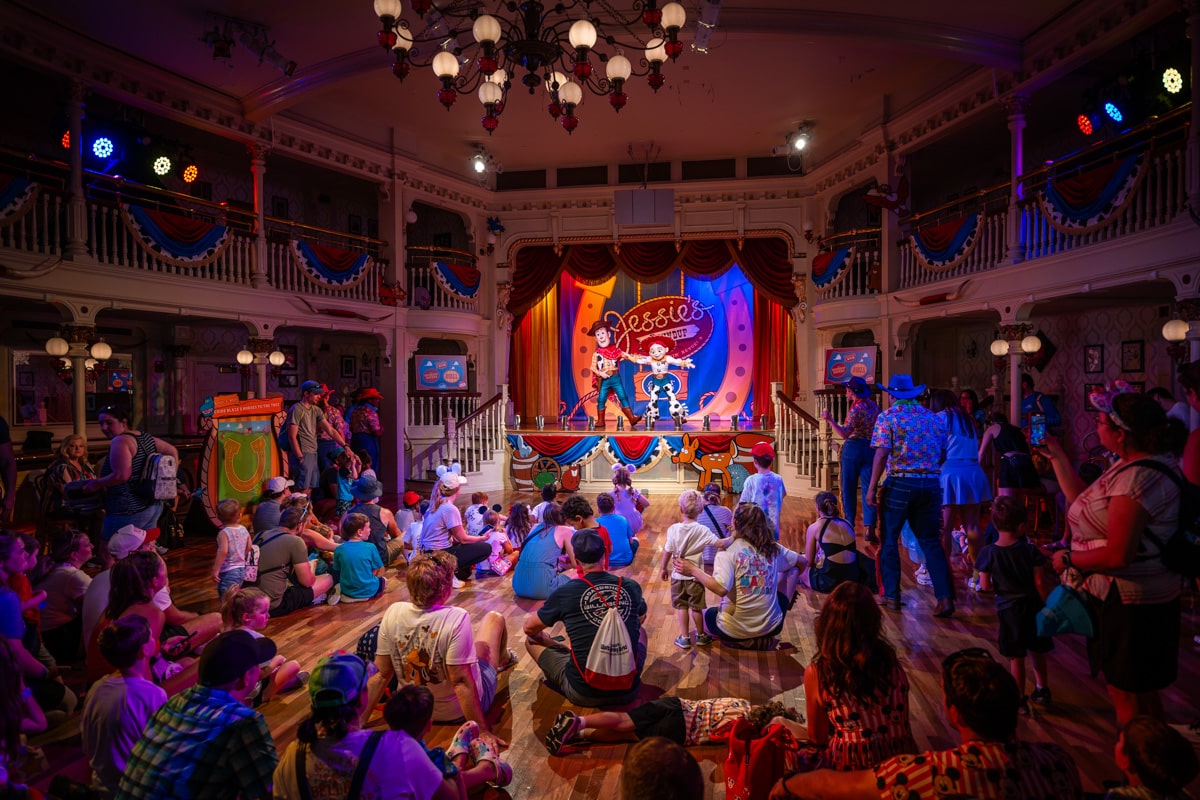
As an extension of the above point, there’s the added entertainment for Cool Kids’ Summer, which brings indoor interactive activities and dance parties to all four parks to give families a break from the Florida heat. At Magic Kingdom, Jessie’s Roundup: A Rip-Roarin’ Revue takes over the air-conditioned Diamond Horseshoe for interactive games, crafts, and rotating 15-minute shows with Woody, Jessie, and Bullseye.
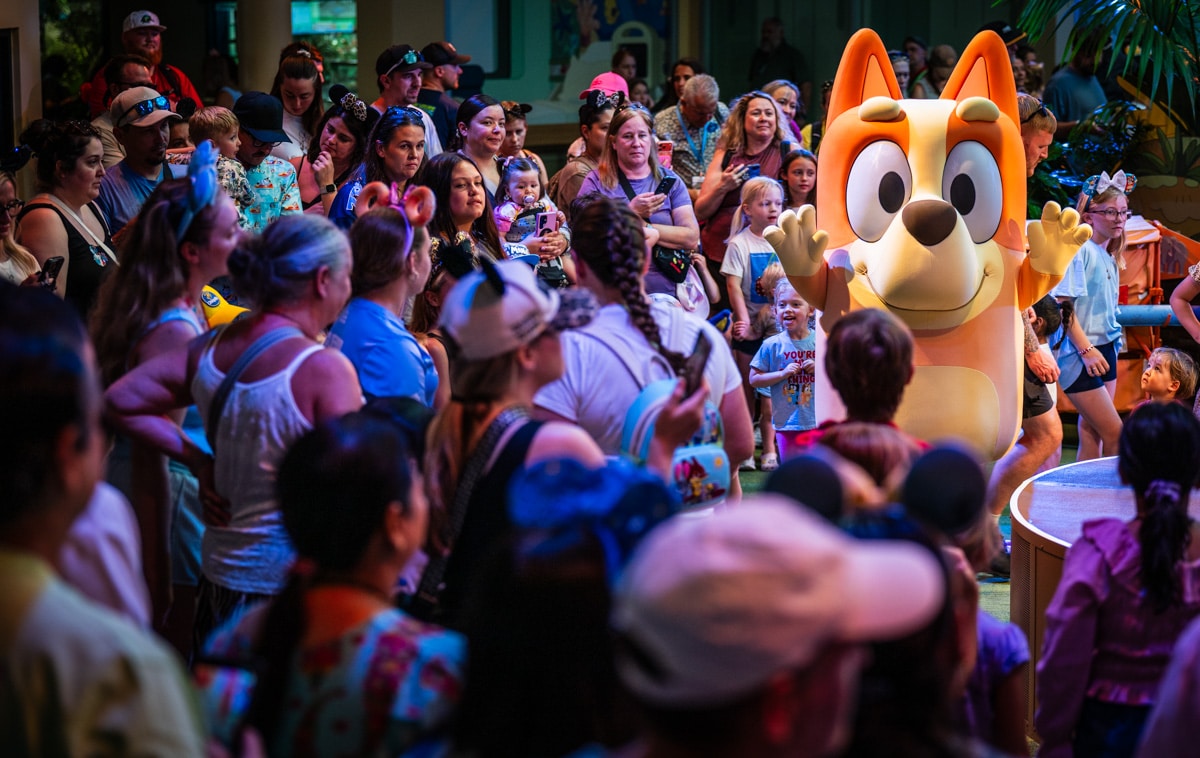
The most notable of these additions is at Animal Kingdom, which introduced Bluey’s Wild World at Conservation Station, allowing kids to dance and play games alongside Bluey and Bingo. This one requires a fairly significant time commitment, meaning it soaks up crowds for a longer portion of their day. EPCOT brings high-energy fun to CommuniCore Hall with GoofyCore, an indoor dance and activity party hosted by Goofy and DJ Dance Pants.
Disney’s Hollywood Studios features the live stage show Disney Jr. Mickey Mouse Clubhouse Live!, where kids dance along with Mickey, Minnie, and friends on a musical road trip. Two of these existed last year, so they wouldn’t explain a year-over-year change unless their utilization increased (and I’m actually guessing it did).

Starlight Started
Most notably, there’s the addition of Disney Starlight: Dream the Night Away. This marquee night parade at Magic Kingdom did not exist at all last year. It’s a pure addition that doesn’t replace anything. Not only is this pulling people away from attractions for its two nightly performances (most dates), but it’s also likely redistributing guests throughout the day.
The average family that’s staying late to watch the 11 pm Starlight is probably not also rope dropping Magic Kingdom. Or if they are doing both, they’re also taking a midday break. Meanwhile, the local Annual Passholder may opt to show up later in the evening to do dinner at a monorail loop resort, and then walk over to Magic Kingdom for Happily Ever After and Starlight as a way to beat the Florida heat. There are probably other scenarios I’m not considering.
The point is that adding entertainment has cascading effects. There are countless ways it helps absorb attendance and redistribute crowds. This is precisely why, historically, the Disney parks have offered so much live entertainment. Conversely, it’s why it has been so perplexing that Disney now acts downright allergic to spending money on live entertainment.
It’s also why ‘feels like’ crowds can be worse at parks like DCA, which have shuttered venues and fewer atmospheric acts, despite lower attendance than 2019. Entertainment matters, and Magic Kingdom is a good illustration of the upside of adding more of it.
Park Hours
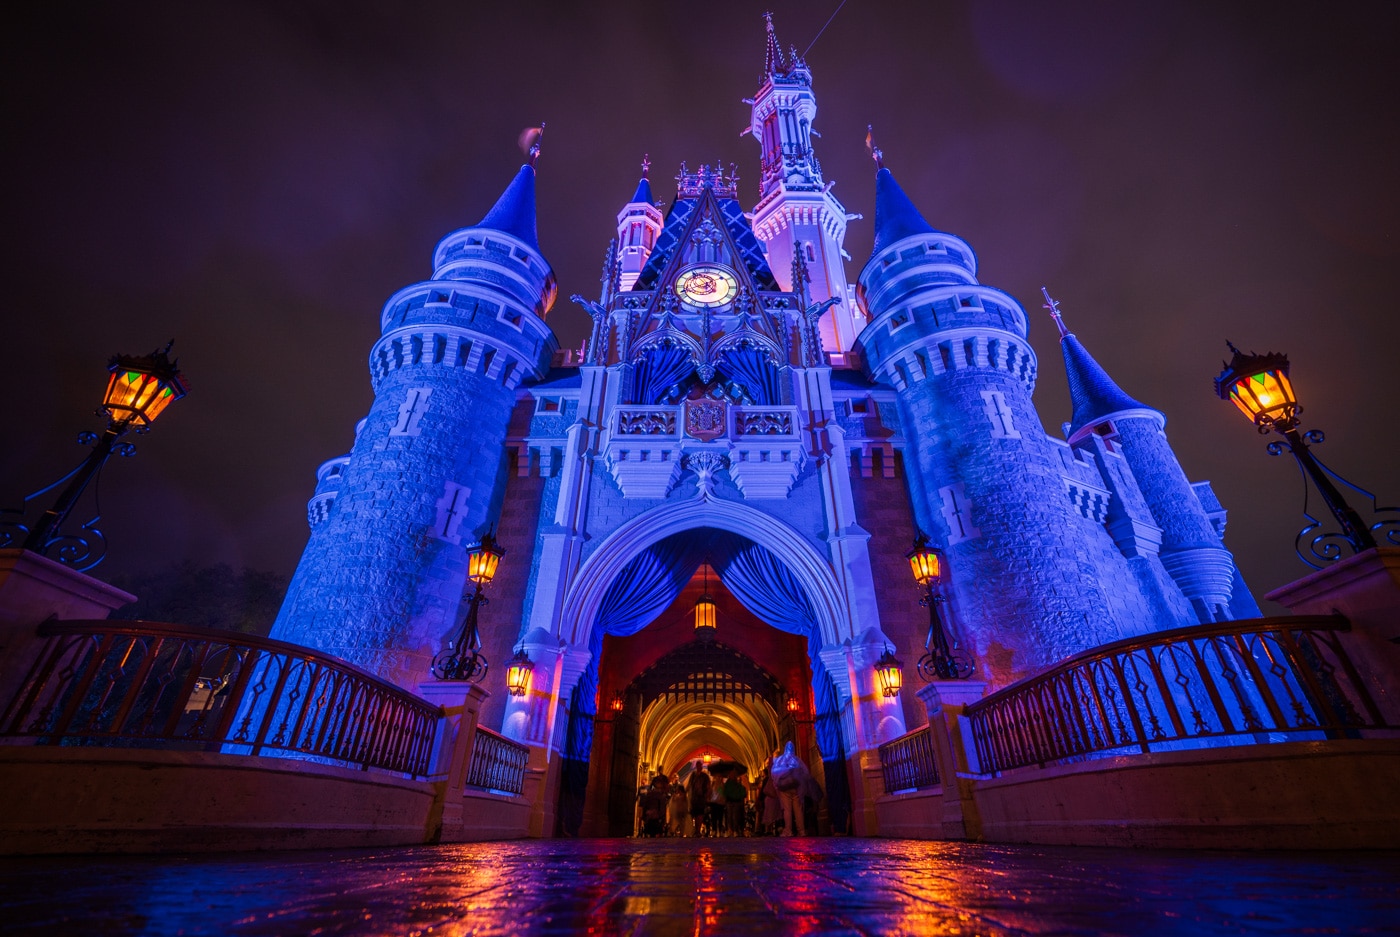
Summer hours at Walt Disney World are shorter in 2026 than they were in 2009. But the thing is, our frame of reference here isn’t 2026 vs. 2009, it’s year-over-year.
Park hours this summer have been longer than last. Not by a lot or at all four parks, but by a bit. Due to the debut of Starlight, Magic Kingdom closes at 11 pm with regularity during the summer, and is effectively open even later since that’s when the second Starlight steps off.
Along with that, Disney’s Hollywood Studios has had hours extended to 10 pm with some degree of frequency, along with a second showing of Fantasmic added at 10:30 pm. Animal Kingdom hours have likewise been extended on some dates, although that’s a fairly negligible number versus last year.
Most guests don’t spend full days in the parks, so adding hours essentially dilutes crowds. It also makes midday breaks more likely, which are presumably being further hollowed out by the extreme heat Central Florida has experienced on many dates this summer.

Improving Uptime & Efficiency
This one is speculative, based on an event that I attended at Disneyland and covered here: Disney Addresses Third Biggest Guest Complaint, Decreasing Downtime for 1.5 Million More Rides!
The short version of that article is that Disneyland had 1.5 million more rides or ‘guests carried’ during the last fiscal year due to increased attraction availability. That’s according to the Director of Attractions Engineering Services at the Disneyland Resort, who walked through the several ways her team accomplished that feat. Some of those explanations are specific to Disneyland, but most are likely applicable to Walt Disney World, as well.
In the months since, I’ve been trying to get someone from Walt Disney World to specifically comment on comparable changes at the Florida parks. From these conversations, I have reason to believe the same or similar initiatives are being undertaken at Walt Disney World. But I have no data or on the record explanations to support that.

What I will say is that things got bad post-COVID. For one thing, there was the loss of institutional knowledge with the furloughs and layoffs back in 2020. Maintenance departments were decimated and now have far fewer years of tenure. For another, there were supply chain disruptions that made routine upkeep challenging. Finally, refurbishments were deferred either due to the above, or cost-cutting, or both.
To be sure, downtime is still an issue. It’s one of those things that I hesitate to discuss because there are countless (completely legitimate!) anecdotes about guests getting really unlucky, and having really bad days. Nevertheless, my gut is that it’s better today than it was last year or in 2020-2024 (and steadily improving), but still worse than in 2019 or earlier. Even so, any improvement would be reflected as a decrease in year-over-year wait times.
As an addendum to this, I don’t buy the conspiracy theories about Walt Disney World reducing operational efficiency in order to push Lightning Lane sales. If you see instances of one load platform being down at certain attractions, that’s almost certainly not a purposeful cutback. I have it on pretty solid authority that this is not happening.
Lightning Lane Utilization
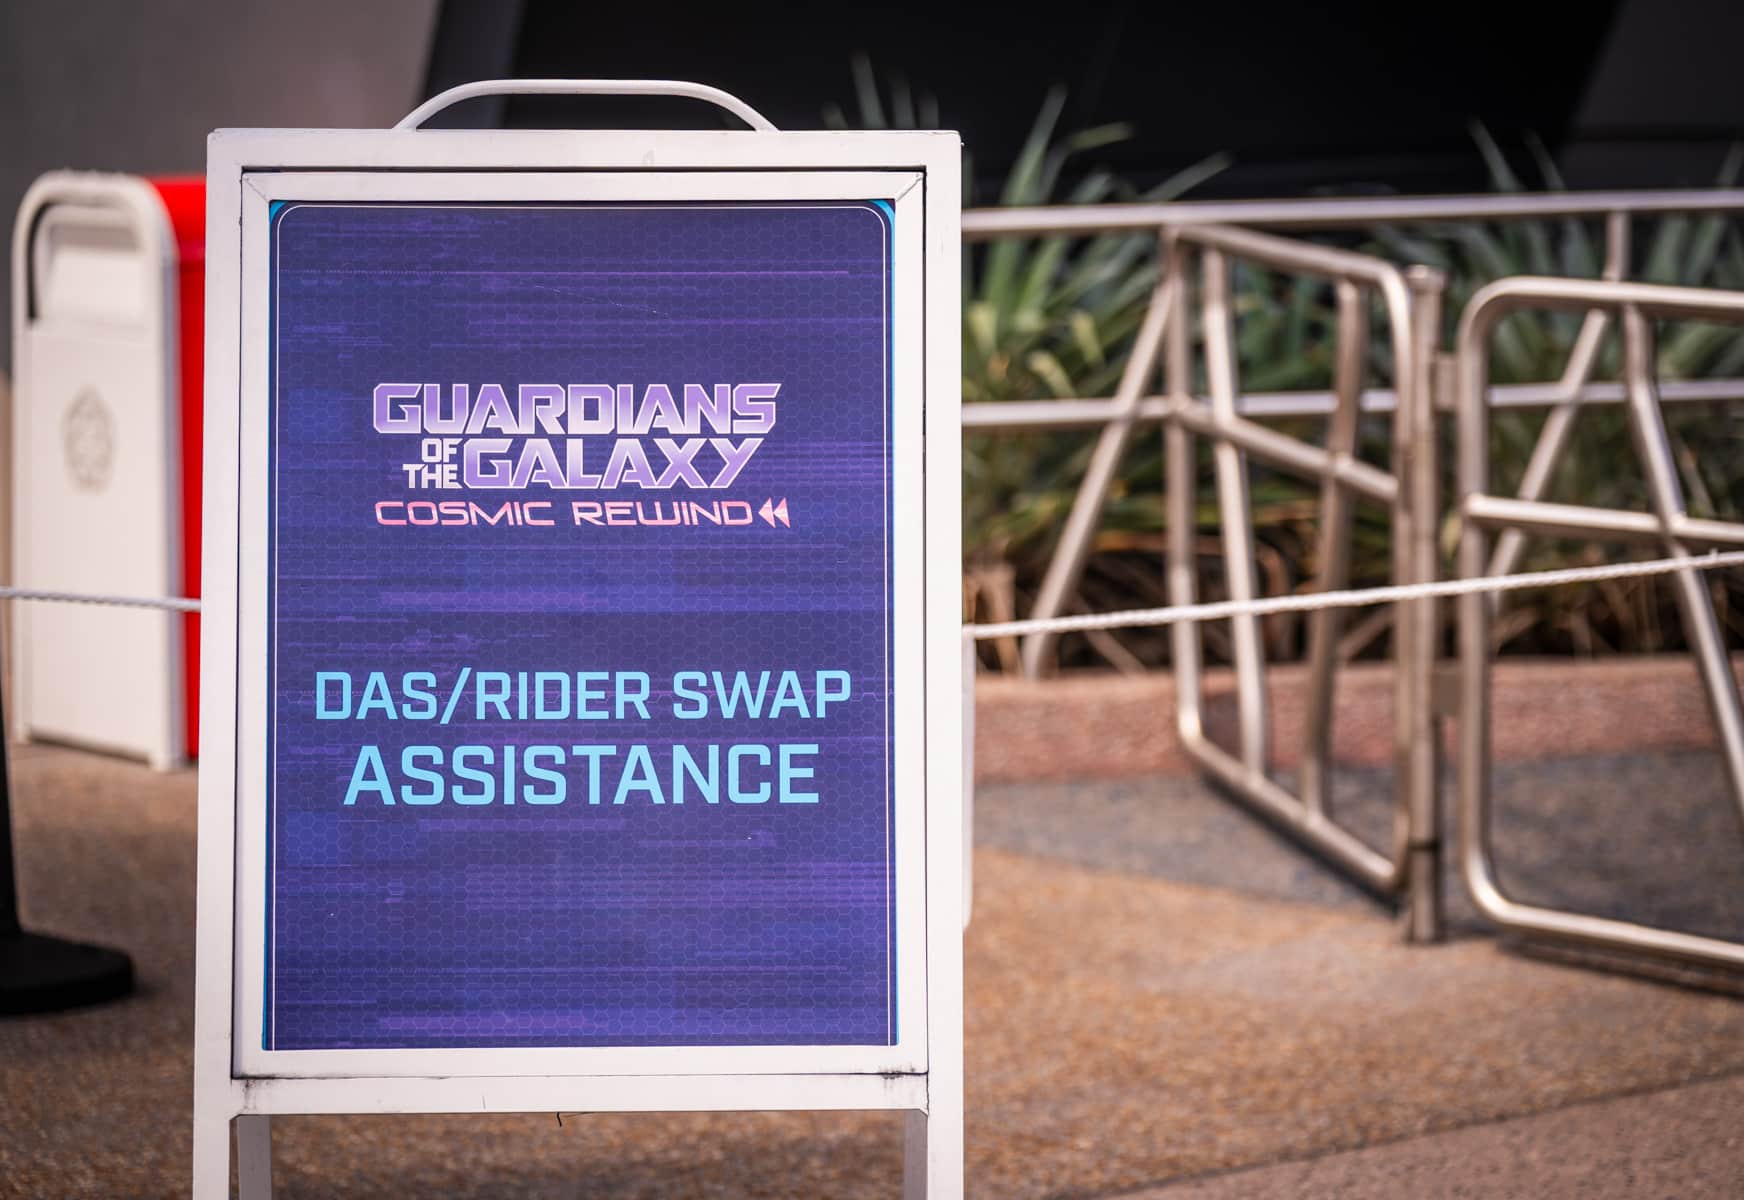
Two years ago, Disney overhauled Disability Access Service. According to the company, the changes were due in large part to abuse, misuse, and proliferation of the program’s use–with issuances of DAS tripling from 2019 to last year. (See Disability Access Service (DAS) Changes at Walt Disney World FAQ.)
Shortly thereafter, Walt Disney World introduced pre-arrival Lightning Lanes. With that, they also reduced the inventory of ride reservations, effectively reducing how many lines the average guest skips per day with Multi-Pass. We’ve written a lot about the indirect impacts of the DAS changes and Lightning Lane allocation on wait times at Walt Disney World. Most recently about a month ago in Is Lightning Lane Multi Pass Still “Worth It” at Disney World?
The salient point with this has been that standby lines are shorter and faster moving, with wait times being lower year-over-year as a direct result of the DAS crackdown. Even if attendance is exactly the same, crowd levels (as reflected in wait times) would be lower than the same dates last year as a result.
There’s only issue with this explanation. The bulk of those changes happened in mid-2024, which means that Walt Disney World should have already lapped their biggest impacts. But we believe tweaks have continued since, and at the same time, it seems possible that fewer guests are purchasing Lightning Lane Multi-Pass as budgets get squeezed and people pull back on their discretionary spending. As such, this explanation still feels like a significant one to include.
More Accurate Wait Times
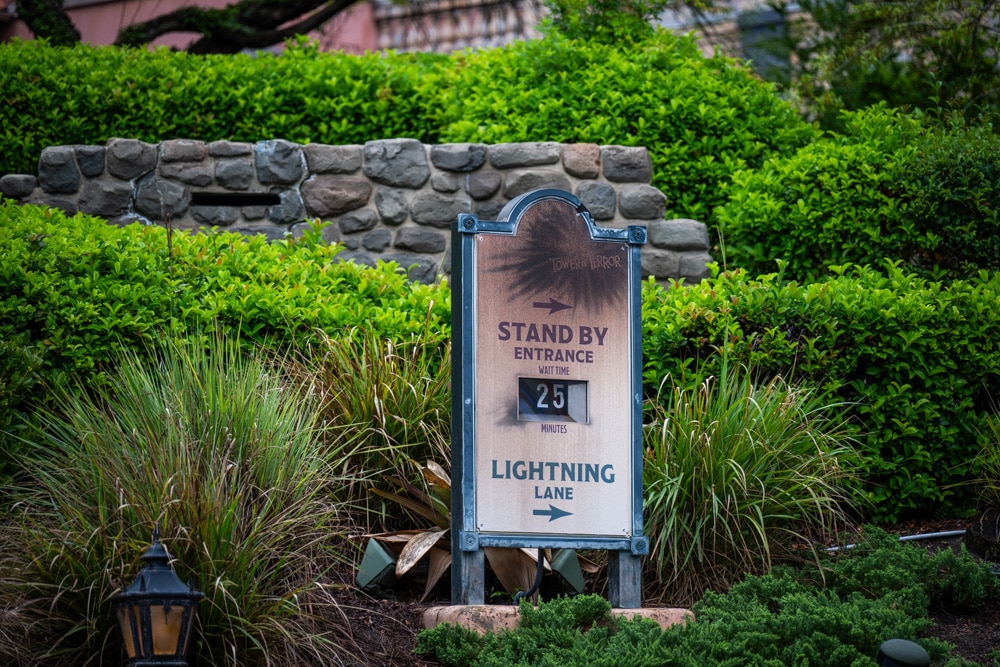
Back in June, we reported on Disney Sunsetting FLIK Wait Times Estimate Tool. One of the explanations we’ve since heard for that is a newer initiative for even more accurate wait times via a comprehensive digital toolkit.
The latter half of that is nothing new. Most Walt Disney World attractions actually haven’t used FLIK cards for a while, and have instead used an array of automated technology to measure wait times, from MagicBands to RFID.
The new part is the initiative of having more accurate wait times, and this being an important metric for Walt Disney World operations leadership. (It’s a similar story with attraction availability, which is what undercuts the notion that Disney purposefully closes load platforms.)
Honestly, I have a difficult time corroborating this based on my on-the-ground experience. From what I’ve seen, wait time inflation is still very much a thing. But maybe it’s slightly less of a thing year-over-year? After all, we’re only talking a few percentage points.
It’s not as if wait time inflation needs to go from 30 minutes on a posted 60 minute wait to 55 minutes. Even getting that to 40 of 60 minutes would alone fully explain the disparity between wait times and attendance numbers.
Finally, if you want to understand more about Walt Disney World misconceptions about crowds, see our list of the “Top” 10 Ways Walt Disney World Fans Are Wrong About Crowds. That’s worth reading if you want a better understanding of WDW attendance patterns, feels like crowds vs. wait times, and a few fairly easy ways to “beat” the crowds.
Ultimately, these are our theories to reconcile the lower average wait times with the higher attendance for the same period. Any or all of them could be wrong. But if both sets of data are accurate, an assumption we do believe to be true, there has got to be some explanation (or multiple) for the discrepancy. From the outside looking in, these strike us as the most plausible.
The good news is that this is mostly a positive story! Walt Disney World decreasing wait times while increasing attendance is the ultimate win-win for guests, especially if the underlying reasons for that are added entertainment, more ride availability, longer park hours, or anything else discussed here.
Even though this is happening alongside higher guest spending, it’s also accompanied by better discounts on tickets and resorts that allow savvy planners to take the cheapest trips since 2019. Oh, and don’t forget the added bonus of Walt Disney World’s overperformance meaning that Wall Street will want the company to double-down on investing in new lands and expansion! From where we sit, this is pretty positive news all around!
Planning a Walt Disney World trip? Learn about hotels on our Walt Disney World Hotels Reviews page. For where to eat, read our Walt Disney World Restaurant Reviews. To save money on tickets or determine which type to buy, read our Tips for Saving Money on Walt Disney World Tickets post. Our What to Pack for Disney Trips post takes a unique look at clever items to take. For what to do and when to do it, our Walt Disney World Ride Guides will help. For comprehensive advice, the best place to start is our Walt Disney World Trip Planning Guide for everything you need to know!
Your Thoughts
Do you agree or disagree with our assessment as to why wait times are down year over year at Walt Disney World while the company is reporting higher attendance? Or, do you disagree entirely, and think one set of numbers is wrong or misleading? Any observations about crowd trends for the shoulder season and first half of summer? Hearing your feedback about your experiences is both interesting to us and helpful to other readers, so please share your thoughts or questions below in the comments!


I always appreciate your legal and MBA-infused analyses, unusual (to put it mildly) in the Disney fan space. Thanks.
Good article. Agree wholeheartedly about live entertainment pulling crowds and needing more of it (!), keep it coming. I remember more about the entertainment vibes and fun from when I was a child than any of the rides. However…
… you have a lot of faith in our Securities and Exchange Commission.
“you have a lot of faith in our Securities and Exchange Commission.”
Ha! More like I have a lot of faith in Disney execs not to risk it all, regardless of what the SEC would (or wouldn’t) do.
I was thinking the same with Early Entry and evenings. Thank you for your opinion. That kind of wait is not a big deal at all. The lines are half the fun sometimes anyway! Taking in the vibes at WDW is so much a part of the fun. 🙂
I agree I think this is great for guests. In my opinion I am not sure I care how it’s happening as long as discounts are offered and crowds feel lower.
If wait times are down but feels like is still high that is still an unpleasant experience in my opinion. I’m really hoping our trip first week of September holds out to be true for super low crowds (in the scheme of Disney). We chose this week over November because the price difference was substantial ($1k+), our toddler needs a midday nap anyway so we would be out of the peak heat of the day), and our toddler is a highly sensitive kid she cannot handle a wait over 15 minutes without starting to lose it (ask my how I know after our first week of March trip where our last Epcot day even with lightning lanes we didn’t do ANY rides because the waits were all 15-20min+. I was so glad she was under 3 and free lol)
I was wondering about the discrepancy between wait times and attendance. This is an excellent analysis. Thank you very much.
This year with a trip in May and another in July was my best year since 2019 for ride downtime. A few rides were down when we were headed in their direction, but they were usually up and running within a half hour. Things are definitely running better each year post pandemic!
Tom, related question/advice. My family is headed to WDW 09/01 – 09/08. From what I see crowds should be light. In your opinion would you recommend skipping LL for this time? My girls are 15 and 12.
Our thought was we’d plan on doing a single LL if there was a ride we wanted to “secure” in the moment. What do you advise? Thank you! I love the blog!
I personally would do Early Entry and evenings, skipping LLMP/SP, but everyone has different wait time tolerances.
Crowds will absolutely be low that week, but you can still expect averages for certain headliners to be 45-65 minutes midday. I can work around that, but others prefer line-skipping. YMMV.